Fort Smith metropolitan area
The Fort Smith Metropolitan Statistical Area, as defined by the United States Census Bureau, is a five-county area including three Arkansas counties and two Oklahoma counties, and anchored by the city of Fort Smith, Arkansas. The total MSA population in 2000 was 273,170 people, estimated by the Bureau to have grown to 289,693 people by 2007.[1]
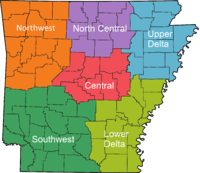
| Part of a series on |
| Regions of Arkansas |
|---|
 |
|
Geographic Regions |
|
Administrative divisions
|
Other major cities located within the area include the Arkansas cities of Van Buren and Ozark and the Oklahoma cities of Poteau and Sallisaw. It is directly positioned under Crawford County in the western part of Arkansas.
Counties
Constituent counties of the MSA include:
Arkansas
Oklahoma
Communities
Communities are categorized based on their populations in the 2000 U.S. Census.
Places with more than 75,000 inhabitants
- Fort Smith, Arkansas (Principal city)
Places with 10,000 to 25,000 inhabitants
Places with 1,000 to 10,000 inhabitants
- Alma, Arkansas
- Arkoma, Oklahoma
- Barling, Arkansas
- Cedarville, Arkansas
- Charleston, Arkansas
- Greenwood, Arkansas
- Heavener, Oklahoma
- Lavaca, Arkansas
- Mansfield, Arkansas (partial)
- Mulberry, Arkansas
- Muldrow, Oklahoma
- Ozark, Arkansas
- Panama, Oklahoma
- Pocola, Oklahoma
- Poteau, Oklahoma
- Roland, Oklahoma
- Sallisaw, Oklahoma
- Spiro, Oklahoma
- Talihina, Oklahoma
- Vian, Oklahoma
- Wister, Oklahoma
Places with 500 to 1,000 inhabitants
- Bonanza, Arkansas
- Brent, Oklahoma (census-designated place)
- Brushy, Oklahoma (census-designated place)
- Carlisle, Oklahoma (census-designated place)
- Central City, Arkansas
- Dyer, Arkansas
- Gore, Oklahoma
- Hackett, Arkansas
- Hartford, Arkansas
- Howe, Oklahoma
- Huntington, Arkansas
- Kibler, Arkansas
- Mountainburg, Arkansas
- Rock Island, Oklahoma
- Shady Point, Oklahoma
Places with fewer than 500 inhabitants
- Akins, Oklahoma (census-designated place)
- Altus, Arkansas
- Belfonte, Oklahoma (census-designated place)
- Bokoshe, Oklahoma
- Branch, Arkansas
- Cameron, Oklahoma
- Cecil, Arkansas
- Chester, Arkansas
- Cowlington, Oklahoma
- Denning, Arkansas
- Dwight Mission, Oklahoma (census-designated place)
- Evening Shade, Oklahoma (census-designated place)
- Fanshawe, Oklahoma (partial)
- Flute Springs, Oklahoma (census-designated place)
- Fort Coffee, Oklahoma
- Gans, Oklahoma
- Le Flore, Oklahoma
- Long, Oklahoma (census-designated place)
- Marble City Community, Oklahoma (census-designated place)
- Marble City, Oklahoma
- McKey, Oklahoma (census-designated place)
- Midland, Arkansas
- Moffett, Oklahoma
- Notchietown, Oklahoma (census-designated place)
- Paradise Hill, Oklahoma
- Pinhook Corners, Oklahoma (census-designated place)
- Redbird Smith, Oklahoma (census-designated place)
- Remy, Oklahoma (census-designated place)
- Rudy, Arkansas
- Short, Oklahoma (census-designated place)
- Stony Point, Oklahoma (census-designated place)
- Sycamore, Sequoyah County, Oklahoma (census-designated place)
- Wiederkehr Village, Arkansas
Largest cities in the MSA
| City | County | State | Population (2007 est.)[2][3] |
|---|---|---|---|
| Fort Smith | Sebastian | Arkansas | 84,375 |
| Van Buren | Crawford | Arkansas | 22,001 |
| Sallisaw | Sequoyah | Oklahoma | 8,740 |
| Greenwood | Sebastian | Arkansas | 8,482 |
| Poteau | Le Flore | Oklahoma | 8,246 |
| Alma | Crawford | Arkansas | 4,948 |
| Barling | Sebastian | Arkansas | 4,439 |
| Pocola | Le Flore | Oklahoma | 4,435 |
| Ozark | Franklin | Arkansas | 3,557 |
| Heavener | Le Flore | Oklahoma | 3,265 |
| Roland | Sequoyah | Oklahoma | 3,258 |
| Muldrow | Sequoyah | Oklahoma | 3,168 |
| Charleston | Franklin | Arkansas | 3,007 |
| Spiro | Le Flore | Oklahoma | 2,316 |
| Arkoma | Le Flore | Oklahoma | 2,181 |
Demographics
| Historical population | |||
|---|---|---|---|
| Census | Pop. | %± | |
| 1910 | 150,991 | — | |
| 1920 | 171,393 | 13.5% | |
| 1930 | 155,138 | −9.5% | |
| 1940 | 171,416 | 10.5% | |
| 1950 | 154,336 | −10.0% | |
| 1960 | 145,323 | −5.8% | |
| 1970 | 171,722 | 18.2% | |
| 1980 | 218,216 | 27.1% | |
| 1990 | 234,078 | 7.3% | |
| 2000 | 273,170 | 16.7% | |
| 2010 | 298,592 | 9.3% | |
| Est. 2019 | 300,221 | 0.5% | |
| U.S. Decennial Census[4] 2019 Estimate[5] | |||
As of the census[6] of 2000, there were 273,170 people, 104,506 households, and 75,005 families residing within the MSA. The racial makeup of the MSA was 82.78% White, 3.46% African American, 5.80% Native American, 1.80% Asian, 0.04% Pacific Islander, 2.26% from other races, and 3.87% from two or more races. Hispanic or Latino of any race were 4.54% of the population.
The median income for a household in the MSA was $30,500, and the median income for a family was $35,902. Males had a median income of $28,074 versus $20,182 for females. The per capita income for the MSA was $15,039.
See also
- Arkansas metropolitan areas
- Arkansas census statistical areas
- Oklahoma census statistical areas
References
- "Annual Estimates of the Population of Metropolitan and Micropolitan Statistical Areas: April 1, 2000 to July 1, 2007 (CBSA-EST2007-01)". 2007 Population Estimates. United States Census Bureau, Population Division. 2008-03-27. Archived from the original (CSV) on 2008-09-05. Retrieved 2008-03-28.
- "Table 4: Annual Estimates of the Population for Incorporated Places in Arkansas, Listed Alphabetically: April 1, 2000 to July 1, 2007" (CSV). 2007 Population Estimates. United States Census Bureau, Population Division. 2008-07-10. Retrieved 2009-01-01.
- "Table 4: Annual Estimates of the Population for Incorporated Places in Oklahoma, Listed Alphabetically: April 1, 2000 to July 1, 2007" (CSV). 2007 Population Estimates. United States Census Bureau, Population Division. 2008-07-10. Retrieved 2009-01-01.
- "U.S. Decennial Census". Census.gov. Archived from the original on May 12, 2015. Retrieved April 18, 2020.
- "County Population Totals and Components of Change: 2010-2019". United States Census Bureau. Retrieved April 18, 2020.
- "U.S. Census website". United States Census Bureau. Retrieved 2008-01-31.

Oklahoma City (capital) | ||
| Topics |
|  |
| Society |
| |
| Regions | ||
| Largest cities | ||
| Counties |
| |