2020 United States presidential election in North Carolina
The 2020 United States presidential election in North Carolina is scheduled to take place on Tuesday, November 3, 2020, as part of the 2020 United States elections in which all 50 states plus the District of Columbia will participate.[1] North Carolina voters will choose electors to represent them in the Electoral College via a popular vote. The state of North Carolina has 15 electoral votes in the Electoral College.[2]
| |||||||||||||||||
| |||||||||||||||||
| |||||||||||||||||
.jpg)
| Elections in North Carolina | ||||||||||||||
|---|---|---|---|---|---|---|---|---|---|---|---|---|---|---|
 | ||||||||||||||
|
||||||||||||||
|
State executive
|
||||||||||||||
|
State legislature |
||||||||||||||
|
Mayoral elections
|
||||||||||||||
Primary elections
Presidential preference primaries were held on March 3, 2020, for each of the political parties with state ballot access.
Democratic primary
Despite speculation that he might seek the Democratic nomination, Roy Cooper, the Governor of North Carolina, declined to run.[3][4]
Democratic primary polling
| Polling Aggregation | |||||||||||
|---|---|---|---|---|---|---|---|---|---|---|---|
| Source of poll aggregation | Date Updated | Dates polled | Joe Biden |
Bernie Sanders |
Michael Bloomberg |
Elizabeth Warren |
Tulsi Gabbard |
Other/ Undecided[lower-alpha 1] | |||
| 270 to Win | March 3, 2020 | February 21–March 2, 2020 | 27.8% | 25.8% | 17.0% | 11.6% | 0.8% | 17.0% | |||
| RealClear Politics | March 3, 2020 | February 27–March 2, 2020 | 36.7% | 23.3% | 14.3% | 10.7% | 1.0% | 14.0% | |||
| FiveThirtyEight | March 3, 2020 | until March 2, 2020[lower-alpha 2] | 34.5% | 22.1% | 14.4% | 11.3% | 0.2% | 17.5% | |||
| Average | 33.0% | 23.7% | 15.2% | 11.2% | 0.7% | 16.2% | |||||
| North Carolina primary results (March 3, 2020) | 43.0% | 24.1% | 13.0% | 10.5% | 0.5% | 8.9% | |||||
| Tabulation of individual polls of the 2020 North Carolina Democratic primary | ||||||||||||||||
|---|---|---|---|---|---|---|---|---|---|---|---|---|---|---|---|---|
| Poll source | Date(s) administered |
Sample size[lower-alpha 3] |
Margin of error |
Joe Biden |
Michael Bloomberg |
Cory Booker |
Pete Buttigieg |
Kamala Harris |
Bernie Sanders |
Elizabeth Warren |
Andrew Yang |
Other | Undecided | |||
| Klobuchar withdraws from the race | ||||||||||||||||
| Spry Strategies/Civitas | Mar 1–2, 2020 | 543 (LV) | ± 4.2% | 45% | 11% | – | 3% | – | 18% | 7% | – | 6%[lower-alpha 4] | 11% | |||
| Swayable | Mar 1–2, 2020 | 1,209 (LV) | ± 3.0% | 36% | 18% | – | 4% | – | 23% | 10% | – | 10%[lower-alpha 5] | – | |||
| Data for Progress | Feb 28–Mar 2, 2020 | 334 (LV) | ± 5.3% | 36% | 18% | – | 3% | – | 27% | 14% | – | 3%[lower-alpha 6] | – | |||
| Buttigieg withdraws from the race | ||||||||||||||||
| Elucd | Feb 26–Mar 1, 2020 | 657 (LV) | ± 3.8% | 25% | 15% | – | 6% | – | 26% | 12% | – | 6%[lower-alpha 7] | 10% | |||
| East Carolina University | Feb 27–28, 2020 | 499 (LV) | ± 5.1% | 29% | 14% | – | 4% | – | 25% | 11% | – | 9%[lower-alpha 8] | 9% | |||
| High Point University | Feb 21–28, 2020 | 274 (LV) | – | 14% | 20% | – | 8% | – | 28% | 12% | – | 13%[lower-alpha 9] | 7% | |||
| 472 (RV) | – | 14% | 18% | – | 8% | – | 31% | 11% | – | 11%[lower-alpha 10] | 7% | |||||
| Spry Strategies/Civitas | Feb 26–27, 2020 | 581 (LV) | ± 4.1% | 27% | 16% | – | 4% | – | 19% | 11% | – | 10%[lower-alpha 11] | 15% | |||
| Marist College | Feb 23–27, 2020 | 568 (LV) | ± 5.1% | 24% | 15% | – | 7% | – | 26% | 11% | – | 8%[lower-alpha 12] | 7% | |||
| 974 (RV) | ± 3.9% | 22% | 15% | – | 7% | – | 27% | 11% | – | 9%[lower-alpha 13] | 8% | |||||
| Data for Progress | Feb 23–27, 2020 | 536 (LV) | ± 4.2% | 25% | 18% | – | 10% | – | 27% | 11% | – | 8%[lower-alpha 14] | – | |||
| Public Policy Polling | Feb 23–24, 2020 | 852 (LV) | ± 3.4% | 23% | 17% | – | 9% | – | 20% | 11% | – | 8%[lower-alpha 15] | 11%[lower-alpha 16] | |||
| Meredith College | Feb 16–24, 2020 | 430 (LV) | – | 17.9% | 17.0% | 0.7% | 10.0% | – | 19.5% | 10.9% | – | 7.6%[lower-alpha 17] | 16.5%[lower-alpha 18] | |||
| Spry Strategies/Civitas | Feb 21–23, 2020 | 561 (LV) | ± 3.75% | 20% | 20% | – | 3% | – | 20% | 9% | – | 13%[lower-alpha 19] | 14% | |||
| University of Massachusetts Lowell | Feb 12–18, 2020 | 450 (LV) | ± 6.5% | 16% | 19% | – | 10% | – | 23% | 13% | – | 13%[lower-alpha 20] | 6% | |||
| SurveyUSA/WRAL News | Feb 13–16, 2020 | 698 (LV) | ± 5.0% | 20% | 22% | – | 11% | – | 22% | 8% | – | 7%[lower-alpha 21] | 11% | |||
| New Hampshire primary; Yang withdraws from the race after close of polls | ||||||||||||||||
| High Point University | Jan 31–Feb 6, 2020 | 225 (LV) | – | 24% | 16% | 0% | 8% | – | 20% | 11% | 3% | 9%[lower-alpha 22] | 8% | |||
| 399 (RV) | – | 19% | 13% | 1% | 6% | – | 25% | 12% | 4% | 8%[lower-alpha 23] | 12% | |||||
| Public Policy Polling | Feb 4–5, 2020 | 604 (LV) | – | 25% | 14% | – | 9% | – | 16% | 12% | 5% | 7%[lower-alpha 24] | 13%[lower-alpha 25] | |||
| Booker withdraws from the race | ||||||||||||||||
| Public Policy Polling | Jan 10–12, 2020 | 509 (LV) | – | 31% | 8% | 1% | 6% | – | 18% | 15% | 5% | 6%[lower-alpha 26] | 11%[lower-alpha 27] | |||
| Harris withdraws from the race | ||||||||||||||||
| Bloomberg launches his campaign | ||||||||||||||||
| Fox News | Nov 10–13, 2019 | 669 | ± 3.5% | 37% | – | 2% | 6% | 4% | 14% | 15% | 2% | 8%[lower-alpha 28] | 10% | |||
| HighPoint University | Nov 1–7, 2019 | 347[lower-alpha 29] | ± 6.4% | 33% | – | 2% | 4% | 5% | 18% | 13% | 2% | 6%[lower-alpha 30] | 10% | |||
| 1,049[lower-alpha 31] | ± 3.6% | 18% | – | 2% | 4% | 4% | 15% | 7% | 2% | 7%[lower-alpha 32] | 23% | |||||
| Siena Research/New York Times | Oct 13–26, 2019 | 324 | – | 29% | – | 1% | 1% | 1% | 13% | 15% | 0% | 3%[lower-alpha 33] | 32% | |||
| High Point University | Sep 13–19, 2019 | 348 (A) | – | 31% | – | 4% | 3% | 6% | 20% | 15% | 4% | 3%[lower-alpha 34] | 9% | |||
| SurveyUSA/Civitas | Aug 1–5, 2019 | 534 | ± 6.1% | 36% | – | 1% | 5% | 8% | 15% | 13% | 1% | 2%[lower-alpha 35] | 17% | |||
| Emerson College | May 31 – Jun 3, 2019 | 397 | ± 4.9% | 39% | – | 1% | 8% | 5% | 22% | 15% | 1% | 7%[lower-alpha 36] | – | |||
Results
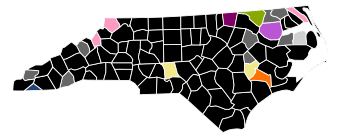
%2C_2020.svg.png)
- Biden—<30%
- Biden—30–40%
- Biden—40–50%
- Biden—50–60%
- Biden—60–70%
- Sanders—30–40%
- Sanders—40–50%
| Candidate | Votes | % | Delegates[6] |
|---|---|---|---|
| Joe Biden | 572,271 | 42.95 | 68 |
| Bernie Sanders | 322,645 | 24.22 | 37 |
| Michael Bloomberg | 172,558 | 12.95 | 3 |
| Elizabeth Warren | 139,912 | 10.50 | 2 |
| Pete Buttigieg (withdrawn†) | 43,632 | 3.27 | |
| Amy Klobuchar (withdrawn†) | 30,742 | 2.31 | |
| Tom Steyer (withdrawn†) | 10,679 | 0.80 | |
| Tulsi Gabbard | 6,622 | 0.50 | |
| Andrew Yang (withdrawn) | 2,973 | 0.22 | |
| Cory Booker (withdrawn) | 2,181 | 0.16 | |
| Michael Bennet (withdrawn) | 1,978 | 0.15 | |
| Deval Patrick (withdrawn) | 1,341 | 0.10 | |
| Marianne Williamson (withdrawn) | 1,243 | 0.09 | |
| John Delaney (withdrawn) | 1,098 | 0.08 | |
| Julian Castro (withdrawn) | 699 | 0.05 | |
| No Preference | 21,808 | 1.64 | |
| Total | 1,332,382 | 100% | 110 |
†Candidate withdrew after early voting started.
Results by county
| 2020 North Carolina Democratic primary
(results per county)[5] | |||||||||||||||||||||||||||||||||
|---|---|---|---|---|---|---|---|---|---|---|---|---|---|---|---|---|---|---|---|---|---|---|---|---|---|---|---|---|---|---|---|---|---|
| County | Joe Biden | Bernie Sanders | Michael Bloomberg | Elizabeth Warren | Pete Buttigieg | Amy Klobuchar | Tom Steyer | Tulsi Gabbard | Andrew Yang | Cory Booker | Michael Bennet | Deval Patrick | Marianne Williamson | John Delaney | Julian Castro | No Preference | Total votes cast | ||||||||||||||||
| Votes | % | Votes | % | Votes | % | Votes | % | Votes | % | Votes | % | Votes | % | Votes | % | Votes | % | Votes | % | Votes | % | Votes | % | Votes | % | Votes | % | Votes | % | Votes | % | ||
| Alamance | 7,702 | 43.61 | 4,383 | 24.82 | 2,307 | 13.06 | 1,646 | 9.32 | 600 | 3.40 | 386 | 2.19 | 112 | 0.63 | 85 | 0.48 | 42 | 0.24 | 29 | 0.16 | 27 | 0.15 | 17 | 0.10 | 17 | 0.10 | 24 | 0.14 | 23 | 0.13 | 261 | 1.48 | 17,661 |
| Alexander | 933 | 40.44 | 435 | 18.86 | 430 | 18.64 | 137 | 5.94 | 87 | 3.77 | 81 | 3.51 | 50 | 2.17 | 20 | 0.87 | 16 | 0.69 | 8 | 0.35 | 3 | 0.13 | 6 | 0.26 | 3 | 0.13 | 5 | 0.22 | 3 | 0.13 | 90 | 3.90 | 2,307 |
| Alleghany | 366 | 33.83 | 210 | 19.41 | 244 | 22.55 | 54 | 4.99 | 56 | 5.18 | 62 | 5.73 | 13 | 1.20 | 10 | 0.92 | 2 | 0.18 | 1 | 0.09 | 0 | 0 | 3 | 0.28 | 2 | 0.18 | 3 | 0.28 | 3 | 0.28 | 53 | 4.90 | 1,082 |
| Anson | 2,077 | 62.28 | 431 | 12.92 | 365 | 10.94 | 88 | 2.64 | 32 | 0.96 | 54 | 1.62 | 37 | 1.11 | 12 | 0.36 | 9 | 0.27 | 11 | 0.33 | 23 | 0.69 | 9 | 0.27 | 5 | 0.15 | 4 | 0.12 | 1 | 0.03 | 177 | 5.31 | 3,335 |
| Ashe | 969 | 40.27 | 536 | 22.28 | 379 | 15.75 | 233 | 9.68 | 101 | 4.20 | 72 | 2.99 | 13 | 0.54 | 21 | 0.87 | 5 | 0.21 | 2 | 0.08 | 6 | 0.25 | 1 | 0.04 | 1 | 0.04 | 2 | 0.08 | 2 | 0.08 | 63 | 2.62 | 2,406 |
| Avery | 457 | 44.07 | 272 | 26.23 | 128 | 12.34 | 87 | 8.39 | 20 | 1.93 | 39 | 3.76 | 5 | 0.48 | 7 | 0.68 | 0 | 0 | 1 | 0.10 | 1 | 0.10 | 1 | 0.10 | 0 | 0 | 2 | 0.19 | 0 | 0 | 17 | 1.64 | 1,037 |
| Beaufort | 2,761 | 52.34 | 774 | 14.67 | 876 | 16.61 | 267 | 5.06 | 136 | 2.58 | 147 | 2.79 | 39 | 0.74 | 43 | 0.82 | 12 | 0.23 | 13 | 0.25 | 23 | 0.44 | 10 | 0.19 | 12 | 0.23 | 12 | 0.23 | 5 | 0.09 | 145 | 2.75 | 5,275 |
| Bertie | 1,803 | 56.68 | 513 | 16.13 | 460 | 14.46 | 74 | 2.33 | 29 | 0.91 | 58 | 1.82 | 18 | 0.57 | 38 | 1.19 | 13 | 0.41 | 7 | 0.22 | 18 | 0.57 | 10 | 0.31 | 4 | 0.13 | 12 | 0.38 | 3 | 0.09 | 121 | 3.80 | 3,181 |
| Bladen | 2,499 | 59.11 | 581 | 13.74 | 515 | 12.18 | 138 | 3.26 | 40 | 0.95 | 72 | 1.70 | 42 | 0.99 | 41 | 0.97 | 12 | 0.28 | 14 | 0.33 | 14 | 0.33 | 7 | 0.17 | 10 | 0.24 | 5 | 0.12 | 4 | 0.09 | 234 | 5.53 | 4,228 |
| Brunswick | 7,806 | 45.12 | 2,600 | 15.03 | 3,558 | 20.56 | 1,082 | 6.25 | 1,029 | 5.95 | 768 | 4.44 | 125 | 0.72 | 68 | 0.39 | 13 | 0.08 | 16 | 0.09 | 21 | 0.12 | 17 | 0.10 | 16 | 0.09 | 7 | 0.04 | 5 | 0.03 | 171 | 0.99 | 17,302 |
| Buncombe | 15,533 | 24.94 | 23,440 | 37.64 | 4,928 | 7.91 | 10,655 | 17.11 | 3,074 | 4.94 | 2,397 | 3.85 | 1,193 | 1.92 | 366 | 0.59 | 109 | 0.18 | 31 | 0.05 | 49 | 0.08 | 20 | 0.03 | 40 | 0.06 | 22 | 0.04 | 22 | 0.04 | 403 | 0.65 | 62,282 |
| Burke | 3,026 | 43.88 | 1,495 | 21.68 | 1,034 | 14.99 | 478 | 6.93 | 229 | 3.32 | 224 | 3.25 | 74 | 1.07 | 45 | 0.65 | 21 | 0.30 | 20 | 0.29 | 14 | 0.20 | 6 | 0.09 | 5 | 0.07 | 11 | 0.16 | 4 | 0.06 | 210 | 3.05 | 6,896 |
| Cabarrus | 10,666 | 49.97 | 5,364 | 25.13 | 2,348 | 11.00 | 1,682 | 7.88 | 390 | 1.83 | 275 | 1.29 | 108 | 0.51 | 107 | 0.50 | 44 | 0.21 | 36 | 0.17 | 28 | 0.13 | 14 | 0.07 | 12 | 0.06 | 10 | 0.05 | 14 | 0.07 | 248 | 1.16 | 21,346 |
| Caldwell | 1,853 | 41.72 | 1,041 | 23.44 | 683 | 15.38 | 301 | 6.78 | 187 | 4.21 | 116 | 2.61 | 39 | 0.88 | 31 | 0.70 | 17 | 0.38 | 10 | 0.23 | 8 | 0.18 | 8 | 0.18 | 7 | 0.16 | 5 | 0.11 | 3 | 0.07 | 133 | 2.99 | 4,442 |
| Camden | 403 | 51.47 | 118 | 15.07 | 126 | 16.09 | 53 | 6.77 | 29 | 3.70 | 13 | 1.66 | 4 | 0.51 | 3 | 0.38 | 0 | 0 | 1 | 0.13 | 0 | 0 | 3 | 0.38 | 1 | 0.13 | 2 | 0.26 | 0 | 0 | 27 | 3.45 | 783 |
| Carteret | 2,969 | 43.55 | 1,251 | 18.35 | 1,237 | 18.15 | 502 | 7.36 | 288 | 4.22 | 248 | 3.64 | 57 | 0.84 | 52 | 0.76 | 17 | 0.25 | 10 | 0.15 | 8 | 0.12 | 5 | 0.07 | 10 | 0.15 | 5 | 0.07 | 6 | 0.09 | 152 | 2.23 | 6,817 |
| Caswell | 1,473 | 48.09 | 569 | 18.58 | 476 | 15.54 | 143 | 4.67 | 46 | 1.50 | 55 | 1.80 | 27 | 0.88 | 21 | 0.69 | 7 | 0.23 | 8 | 0.26 | 10 | 0.33 | 6 | 0.20 | 13 | 0.42 | 2 | 0.07 | 4 | 0.13 | 203 | 6.63 | 3,063 |
| Catawba | 4,618 | 41.09 | 2,775 | 24.69 | 1,732 | 15.41 | 876 | 7.79 | 502 | 4.47 | 312 | 2.78 | 94 | 0.84 | 52 | 0.46 | 30 | 0.27 | 18 | 0.16 | 14 | 0.12 | 18 | 0.16 | 9 | 0.08 | 15 | 0.13 | 5 | 0.04 | 170 | 1.51 | 11,240 |
| Chatham | 6,455 | 37.44 | 3,408 | 19.77 | 2,794 | 16.21 | 2,388 | 13.85 | 845 | 4.90 | 700 | 4.06 | 103 | 0.60 | 123 | 0.71 | 38 | 0.22 | 17 | 0.10 | 21 | 0.12 | 19 | 0.11 | 17 | 0.10 | 20 | 0.12 | 16 | 0.09 | 276 | 1.60 | 17,240 |
| Cherokee | 831 | 43.30 | 446 | 23.24 | 246 | 12.82 | 140 | 7.30 | 66 | 3.44 | 55 | 2.87 | 21 | 1.09 | 19 | 0.99 | 10 | 0.52 | 3 | 0.16 | 4 | 0.21 | 4 | 0.21 | 6 | 0.31 | 8 | 0.42 | 3 | 0.16 | 57 | 2.97 | 1,919 |
| Chowan | 831 | 54.49 | 184 | 12.07 | 275 | 18.03 | 78 | 5.11 | 45 | 2.95 | 36 | 2.36 | 9 | 0.59 | 5 | 0.33 | 2 | 0.13 | 1 | 0.07 | 5 | 0.33 | 2 | 0.13 | 6 | 0.39 | 3 | 0.20 | 1 | 0.07 | 42 | 2.75 | 1,525 |
| Clay | 416 | 42.84 | 201 | 20.70 | 130 | 13.39 | 92 | 9.47 | 41 | 4.22 | 41 | 4.22 | 8 | 0.82 | 4 | 0.41 | 1 | 0.10 | 3 | 0.31 | 6 | 0.62 | 1 | 0.10 | 1 | 0.10 | 2 | 0.21 | 2 | 0.21 | 22 | 2.27 | 971 |
| Cleveland | 4,197 | 51.73 | 1,406 | 17.33 | 1,250 | 15.41 | 424 | 5.23 | 132 | 1.63 | 174 | 2.14 | 81 | 1.00 | 41 | 0.51 | 16 | 0.20 | 16 | 0.20 | 25 | 0.31 | 17 | 0.21 | 14 | 0.17 | 12 | 0.15 | 5 | 0.06 | 304 | 3.75 | 8,114 |
| Columbus | 2,566 | 54.43 | 832 | 17.65 | 525 | 11.14 | 197 | 4.18 | 45 | 0.95 | 89 | 1.89 | 53 | 1.12 | 30 | 0.64 | 14 | 0.30 | 21 | 0.45 | 21 | 0.45 | 18 | 0.38 | 21 | 0.45 | 15 | 0.32 | 1 | 0.02 | 266 | 5.64 | 4,714 |
| Craven | 5,100 | 48.81 | 1,748 | 16.73 | 1,894 | 18.13 | 565 | 5.41 | 391 | 3.74 | 301 | 2.88 | 70 | 0.67 | 48 | 0.46 | 26 | 0.25 | 19 | 0.18 | 25 | 0.24 | 6 | 0.06 | 11 | 0.11 | 10 | 0.10 | 2 | 0.02 | 233 | 2.23 | 10,449 |
| Cumberland | 19,559 | 54.40 | 7,393 | 20.56 | 4,822 | 13.41 | 1,921 | 5.34 | 533 | 1.48 | 373 | 1.04 | 171 | 0.48 | 167 | 0.46 | 98 | 0.27 | 103 | 0.29 | 84 | 0.23 | 35 | 0.10 | 44 | 0.12 | 27 | 0.08 | 28 | 0.08 | 595 | 1.65 | 35,953 |
| Currituck | 960 | 47.60 | 427 | 21.17 | 276 | 13.68 | 171 | 8.48 | 54 | 2.68 | 36 | 1.78 | 8 | 0.40 | 18 | 0.89 | 2 | 0.10 | 4 | 0.20 | 1 | 0.05 | 0 | 0 | 1 | 0.05 | 1 | 0.05 | 3 | 0.15 | 55 | 2.73 | 2,017 |
| Dare | 2,179 | 40.91 | 1,282 | 24.07 | 780 | 14.65 | 511 | 9.59 | 233 | 4.37 | 154 | 2.89 | 26 | 0.49 | 46 | 0.86 | 7 | 0.13 | 7 | 0.13 | 11 | 0.21 | 2 | 0.04 | 7 | 0.13 | 2 | 0.04 | 2 | 0.04 | 77 | 1.45 | 5,326 |
| Davidson | 4,472 | 45.04 | 2,234 | 22.50 | 1,503 | 15.14 | 569 | 5.73 | 346 | 3.49 | 283 | 2.85 | 64 | 0.64 | 75 | 0.76 | 33 | 0.33 | 16 | 0.16 | 14 | 0.14 | 9 | 0.09 | 10 | 0.10 | 60 | 0.60 | 15 | 0.15 | 225 | 2.27 | 9,928 |
| Davie | 1,275 | 40.27 | 706 | 22.30 | 552 | 17.44 | 238 | 7.52 | 133 | 4.20 | 118 | 3.73 | 21 | 0.66 | 21 | 0.66 | 9 | 0.28 | 4 | 0.13 | 4 | 0.13 | 7 | 0.22 | 6 | 0.19 | 9 | 0.28 | 4 | 0.13 | 59 | 1.86 | 3,166 |
| Duplin | 2,486 | 55.55 | 675 | 15.08 | 689 | 15.40 | 133 | 2.97 | 45 | 1.01 | 82 | 1.83 | 25 | 0.56 | 30 | 0.67 | 14 | 0.31 | 11 | 0.25 | 17 | 0.38 | 13 | 0.29 | 9 | 0.20 | 17 | 0.38 | 6 | 0.13 | 223 | 4.98 | 4,475 |
| Durham | 29,664 | 36.22 | 22,104 | 26.99 | 7,504 | 9.16 | 16,580 | 20.24 | 2,926 | 3.57 | 1,805 | 2.20 | 263 | 0.32 | 224 | 0.27 | 137 | 0.17 | 92 | 0.11 | 63 | 0.08 | 62 | 0.08 | 43 | 0.05 | 18 | 0.02 | 27 | 0.03 | 398 | 0.49 | 81,910 |
| Edgecombe | 3,982 | 56.29 | 1,043 | 14.74 | 1,198 | 16.94 | 252 | 3.56 | 73 | 1.03 | 80 | 1.13 | 44 | 0.62 | 53 | 0.75 | 16 | 0.23 | 25 | 0.35 | 28 | 0.40 | 20 | 0.28 | 14 | 0.20 | 14 | 0.20 | 4 | 0.06 | 228 | 3.22 | 7,074 |
| Forsyth | 23,929 | 42.69 | 14,296 | 25.51 | 7,797 | 13.91 | 5,307 | 9.47 | 2,166 | 3.86 | 1,152 | 2.06 | 203 | 0.36 | 182 | 0.32 | 131 | 0.23 | 109 | 0.19 | 77 | 0.14 | 43 | 0.08 | 52 | 0.09 | 27 | 0.05 | 29 | 0.05 | 547 | 0.98 | 56,047 |
| Franklin | 3,732 | 45.94 | 1,580 | 19.45 | 1,218 | 14.99 | 496 | 6.11 | 189 | 2.33 | 460 | 5.66 | 51 | 0.63 | 47 | 0.58 | 33 | 0.41 | 22 | 0.27 | 19 | 0.23 | 15 | 0.18 | 10 | 0.12 | 10 | 0.12 | 9 | 0.11 | 232 | 2.86 | 8,123 |
| Gaston | 7,920 | 46.94 | 4,043 | 23.96 | 2,159 | 12.80 | 1,207 | 7.15 | 478 | 2.83 | 345 | 2.04 | 146 | 0.87 | 89 | 0.53 | 36 | 0.21 | 29 | 0.17 | 23 | 0.14 | 27 | 0.16 | 16 | 0.09 | 8 | 0.05 | 10 | 0.06 | 336 | 1.99 | 16,872 |
| Gates | 751 | 53.19 | 221 | 15.65 | 226 | 16.01 | 71 | 5.03 | 15 | 1.06 | 25 | 1.77 | 10 | 0.71 | 12 | 0.85 | 5 | 0.35 | 5 | 0.35 | 11 | 0.78 | 5 | 0.35 | 1 | 0.07 | 3 | 0.21 | 1 | 0.07 | 50 | 3.54 | 1,412 |
| Graham | 249 | 43.23 | 97 | 16.84 | 69 | 11.98 | 33 | 5.73 | 12 | 2.08 | 28 | 4.86 | 29 | 5.03 | 6 | 1.04 | 2 | 0.35 | 1 | 0.17 | 5 | 0.87 | 0 | 0 | 2 | 0.35 | 0 | 0 | 0 | 0 | 43 | 7.47 | 576 |
| Granville | 3,472 | 46.05 | 1,583 | 20.99 | 1,062 | 14.08 | 471 | 6.25 | 220 | 2.92 | 192 | 2.55 | 55 | 0.73 | 68 | 0.90 | 17 | 0.23 | 17 | 0.23 | 19 | 0.25 | 26 | 0.34 | 16 | 0.21 | 13 | 0.17 | 6 | 0.08 | 303 | 4.02 | 7,540 |
| Greene | 1,098 | 49.64 | 417 | 18.85 | 315 | 14.24 | 82 | 3.71 | 19 | 0.86 | 52 | 2.35 | 31 | 1.40 | 11 | 0.50 | 13 | 0.59 | 10 | 0.45 | 9 | 0.41 | 8 | 0.36 | 8 | 0.36 | 5 | 0.23 | 3 | 0.14 | 131 | 5.92 | 2,212 |
| Guilford | 37,425 | 45.65 | 21,337 | 26.02 | 10,288 | 12.55 | 7,491 | 9.14 | 2,205 | 2.69 | 1,396 | 1.70 | 298 | 0.36 | 251 | 0.31 | 181 | 0.22 | 167 | 0.20 | 131 | 0.16 | 84 | 0.10 | 63 | 0.08 | 37 | 0.05 | 39 | 0.05 | 597 | 0.73 | 81,990 |
| Halifax | 4,844 | 62.02 | 1,131 | 14.48 | 882 | 11.29 | 259 | 3.32 | 73 | 0.93 | 103 | 1.32 | 32 | 0.41 | 67 | 0.86 | 15 | 0.19 | 21 | 0.27 | 39 | 0.50 | 21 | 0.27 | 12 | 0.15 | 12 | 0.15 | 4 | 0.05 | 296 | 3.79 | 7,811 |
| Harnett | 4,324 | 49.05 | 1,924 | 21.83 | 1,157 | 13.13 | 541 | 6.14 | 218 | 2.47 | 157 | 1.78 | 61 | 0.69 | 57 | 0.65 | 37 | 0.42 | 25 | 0.28 | 27 | 0.31 | 16 | 0.18 | 11 | 0.12 | 16 | 0.18 | 5 | 0.06 | 239 | 2.71 | 8,815 |
| Haywood | 3,446 | 40.31 | 1,952 | 22.84 | 849 | 9.93 | 769 | 9.00 | 382 | 4.47 | 356 | 4.16 | 352 | 4.12 | 66 | 0.77 | 23 | 0.27 | 12 | 0.14 | 17 | 0.20 | 7 | 0.08 | 16 | 0.19 | 3 | 0.04 | 5 | 0.06 | 293 | 3.43 | 8,548 |
| Henderson | 5,713 | 38.36 | 3,729 | 25.04 | 1,588 | 10.66 | 1,641 | 11.02 | 866 | 5.81 | 698 | 4.69 | 416 | 2.79 | 68 | 0.46 | 21 | 0.14 | 8 | 0.05 | 13 | 0.09 | 7 | 0.05 | 9 | 0.06 | 4 | 0.03 | 13 | 0.09 | 100 | 0.67 | 14,894 |
| Hertford | 2,377 | 60.90 | 433 | 11.09 | 534 | 13.68 | 103 | 2.64 | 32 | 0.82 | 44 | 1.13 | 11 | 0.28 | 38 | 0.97 | 7 | 0.18 | 13 | 0.33 | 14 | 0.36 | 7 | 0.18 | 4 | 0.10 | 9 | 0.23 | 2 | 0.05 | 275 | 7.05 | 3,903 |
| Hoke | 2,801 | 53.48 | 1,114 | 21.27 | 648 | 12.37 | 215 | 4.11 | 68 | 1.30 | 55 | 1.05 | 39 | 0.74 | 20 | 0.38 | 20 | 0.38 | 23 | 0.44 | 20 | 0.38 | 6 | 0.11 | 8 | 0.15 | 8 | 0.15 | 3 | 0.06 | 189 | 3.61 | 5,237 |
| Hyde | 380 | 47.38 | 128 | 15.96 | 86 | 10.72 | 83 | 10.35 | 7 | 0.87 | 23 | 2.87 | 10 | 1.25 | 6 | 0.75 | 6 | 0.75 | 0 | 0 | 4 | 0.50 | 0 | 0 | 1 | 0.12 | 4 | 0.50 | 1 | 0.12 | 63 | 7.86 | 802 |
| Iredell | 6,245 | 41.26 | 3,424 | 22.62 | 2,509 | 16.58 | 1,181 | 7.80 | 639 | 4.22 | 426 | 2.81 | 153 | 1.01 | 92 | 0.61 | 37 | 0.24 | 31 | 0.20 | 27 | 0.18 | 16 | 0.11 | 22 | 0.15 | 12 | 0.08 | 9 | 0.06 | 312 | 2.06 | 15,135 |
| Jackson | 1,867 | 31.99 | 1,868 | 32.00 | 475 | 8.14 | 689 | 11.80 | 266 | 4.56 | 193 | 3.31 | 215 | 3.68 | 58 | 0.99 | 18 | 0.31 | 3 | 0.05 | 7 | 0.12 | 7 | 0.12 | 9 | 0.15 | 19 | 0.33 | 2 | 0.03 | 141 | 2.42 | 5,837 |
| Johnston | 8,061 | 44.38 | 4,347 | 23.93 | 2,447 | 13.47 | 1,491 | 8.21 | 586 | 3.23 | 389 | 2.14 | 88 | 0.48 | 104 | 0.57 | 29 | 0.16 | 29 | 0.16 | 27 | 0.15 | 17 | 0.09 | 15 | 0.08 | 22 | 0.12 | 14 | 0.08 | 497 | 2.74 | 18,163 |
| Jones | 820 | 61.84 | 184 | 13.88 | 181 | 13.65 | 28 | 2.11 | 15 | 1.13 | 9 | 0.68 | 11 | 0.83 | 9 | 0.68 | 3 | 0.23 | 3 | 0.23 | 6 | 0.45 | 1 | 0.08 | 0 | 0 | 5 | 0.38 | 2 | 0.15 | 49 | 3.70 | 1,326 |
| Lee | 2,520 | 44.74 | 1,233 | 21.89 | 955 | 16.95 | 333 | 5.91 | 170 | 3.02 | 169 | 3.00 | 53 | 0.94 | 35 | 0.62 | 5 | 0.09 | 12 | 0.21 | 7 | 0.12 | 9 | 0.16 | 4 | 0.07 | 7 | 0.12 | 4 | 0.07 | 117 | 2.08 | 5,633 |
| Lenoir | 3,539 | 53.40 | 1,201 | 18.12 | 1,024 | 15.45 | 228 | 3.44 | 79 | 1.19 | 112 | 1.69 | 45 | 0.68 | 28 | 0.42 | 15 | 0.23 | 18 | 0.27 | 28 | 0.42 | 16 | 0.24 | 9 | 0.14 | 14 | 0.21 | 3 | 0.05 | 268 | 4.04 | 6,627 |
| Lincoln | 2,896 | 46.66 | 1,244 | 20.04 | 1,040 | 16.76 | 373 | 6.01 | 207 | 3.33 | 140 | 2.26 | 71 | 1.14 | 36 | 0.58 | 21 | 0.34 | 9 | 0.14 | 8 | 0.13 | 10 | 0.16 | 5 | 0.08 | 8 | 0.13 | 2 | 0.03 | 137 | 2.21 | 6,207 |
| Macon | 1,445 | 39.82 | 739 | 20.36 | 460 | 12.68 | 304 | 8.38 | 172 | 4.74 | 158 | 4.35 | 205 | 5.65 | 30 | 0.83 | 7 | 0.19 | 10 | 0.28 | 5 | 0.14 | 0 | 0 | 5 | 0.14 | 7 | 0.19 | 2 | 0.06 | 80 | 2.20 | 3,629 |
| Madison | 1,066 | 27.40 | 1,295 | 33.29 | 314 | 8.07 | 481 | 12.37 | 109 | 2.80 | 166 | 4.27 | 154 | 3.96 | 54 | 1.39 | 18 | 0.46 | 9 | 0.23 | 10 | 0.26 | 9 | 0.23 | 7 | 0.18 | 5 | 0.13 | 1 | 0.03 | 192 | 4.94 | 3,890 |
| Martin | 2,132 | 60.53 | 441 | 12.52 | 400 | 11.36 | 131 | 3.72 | 37 | 1.05 | 70 | 1.99 | 33 | 0.94 | 22 | 0.62 | 6 | 0.17 | 7 | 0.20 | 9 | 0.26 | 7 | 0.20 | 5 | 0.14 | 6 | 0.17 | 2 | 0.06 | 214 | 6.08 | 3,522 |
| McDowell | 1,317 | 38.67 | 871 | 25.57 | 306 | 8.98 | 280 | 8.22 | 105 | 3.08 | 92 | 2.70 | 160 | 4.70 | 37 | 1.09 | 13 | 0.38 | 1 | 0.03 | 9 | 0.26 | 6 | 0.18 | 3 | 0.09 | 3 | 0.09 | 2 | 0.06 | 201 | 5.90 | 3,406 |
| Mecklenburg | 72,713 | 44.77 | 39,648 | 24.41 | 22,322 | 13.74 | 16,586 | 10.21 | 5,458 | 3.36 | 2,786 | 1.72 | 862 | 0.53 | 505 | 0.31 | 298 | 0.18 | 217 | 0.13 | 102 | 0.06 | 114 | 0.07 | 88 | 0.05 | 65 | 0.04 | 51 | 0.03 | 615 | 0.38 | 162,430 |
| Mitchell | 266 | 29.59 | 324 | 36.04 | 73 | 8.12 | 128 | 14.24 | 19 | 2.11 | 36 | 4.00 | 30 | 3.34 | 3 | 0.33 | 2 | 0.22 | 0 | 0 | 0 | 0 | 1 | 0.11 | 2 | 0.22 | 1 | 0.11 | 2 | 0.22 | 12 | 1.33 | 899 |
| Montgomery | 1,320 | 50.97 | 416 | 16.06 | 374 | 14.44 | 121 | 4.67 | 46 | 1.78 | 62 | 2.39 | 29 | 1.12 | 25 | 0.97 | 10 | 0.39 | 6 | 0.23 | 16 | 0.62 | 7 | 0.27 | 5 | 0.19 | 8 | 0.31 | 3 | 0.12 | 142 | 5.48 | 2,590 |
| Moore | 4,896 | 49.06 | 1,610 | 16.13 | 1,833 | 18.37 | 782 | 7.84 | 336 | 3.37 | 233 | 2.33 | 42 | 0.42 | 44 | 0.44 | 18 | 0.18 | 17 | 0.17 | 8 | 0.08 | 2 | 0.02 | 8 | 0.08 | 2 | 0.02 | 1 | 0.01 | 147 | 1.47 | 9,979 |
| Nash | 6,534 | 54.15 | 2,134 | 17.68 | 2,002 | 16.59 | 480 | 3.98 | 138 | 1.14 | 228 | 1.89 | 66 | 0.55 | 63 | 0.52 | 28 | 0.23 | 22 | 0.18 | 23 | 0.19 | 12 | 0.10 | 18 | 0.15 | 15 | 0.12 | 5 | 0.04 | 299 | 2.48 | 12,067 |
| New Hanover | 12,332 | 36.65 | 9,165 | 27.24 | 5,173 | 15.37 | 3,540 | 10.52 | 1,641 | 4.88 | 979 | 2.91 | 174 | 0.52 | 150 | 0.45 | 74 | 0.22 | 38 | 0.11 | 33 | 0.10 | 17 | 0.05 | 23 | 0.07 | 10 | 0.03 | 7 | 0.02 | 295 | 0.88 | 33,651 |
| Northampton | 2,656 | 58.70 | 499 | 11.03 | 505 | 11.16 | 126 | 2.78 | 46 | 1.02 | 83 | 1.83 | 23 | 0.51 | 89 | 1.97 | 20 | 0.44 | 18 | 0.40 | 32 | 0.71 | 11 | 0.24 | 12 | 0.27 | 9 | 0.20 | 8 | 0.18 | 388 | 8.57 | 4,525 |
| Onslow | 4,972 | 52.40 | 2,021 | 21.30 | 1,173 | 12.36 | 605 | 6.38 | 201 | 2.12 | 137 | 1.44 | 62 | 0.65 | 36 | 0.38 | 29 | 0.31 | 18 | 0.19 | 18 | 0.19 | 12 | 0.13 | 12 | 0.13 | 4 | 0.04 | 4 | 0.04 | 184 | 1.94 | 9,488 |
| Orange | 13,029 | 29.24 | 12,772 | 28.66 | 4,554 | 10.22 | 10,322 | 23.17 | 1,808 | 4.06 | 1,333 | 2.99 | 96 | 0.22 | 192 | 0.43 | 99 | 0.22 | 28 | 0.06 | 18 | 0.04 | 20 | 0.04 | 23 | 0.05 | 8 | 0.02 | 12 | 0.03 | 244 | 0.55 | 44,558 |
| Pamlico | 948 | 54.14 | 213 | 12.16 | 274 | 15.65 | 83 | 4.74 | 54 | 3.08 | 57 | 3.26 | 14 | 0.80 | 10 | 0.57 | 5 | 0.29 | 6 | 0.34 | 4 | 0.23 | 6 | 0.34 | 5 | 0.29 | 6 | 0.34 | 3 | 0.17 | 63 | 3.60 | 1,751 |
| Pasquotank | 2,415 | 56.57 | 663 | 15.53 | 628 | 14.71 | 183 | 4.29 | 89 | 2.08 | 96 | 2.25 | 23 | 0.54 | 18 | 0.42 | 9 | 0.21 | 20 | 0.47 | 7 | 0.16 | 6 | 0.14 | 4 | 0.09 | 1 | 0.02 | 0 | 0 | 107 | 2.51 | 4,269 |
| Pender | 2,513 | 45.72 | 1,191 | 21.67 | 861 | 15.66 | 392 | 7.13 | 221 | 4.02 | 139 | 2.53 | 41 | 0.75 | 31 | 0.56 | 7 | 0.13 | 5 | 0.09 | 14 | 0.25 | 6 | 0.11 | 5 | 0.09 | 2 | 0.04 | 5 | 0.09 | 64 | 1.16 | 5,497 |
| Perquimans | 594 | 45.27 | 175 | 13.34 | 262 | 19.97 | 58 | 4.42 | 31 | 2.36 | 54 | 4.12 | 12 | 0.91 | 18 | 1.37 | 4 | 0.30 | 1 | 0.08 | 5 | 0.38 | 3 | 0.23 | 4 | 0.30 | 20 | 1.52 | 2 | 0.15 | 69 | 5.26 | 1,312 |
| Person | 2,329 | 51.10 | 777 | 17.05 | 654 | 14.35 | 293 | 6.43 | 80 | 1.76 | 106 | 2.33 | 42 | 0.92 | 49 | 1.08 | 12 | 0.26 | 9 | 0.20 | 12 | 0.26 | 6 | 0.13 | 5 | 0.11 | 6 | 0.13 | 3 | 0.07 | 175 | 3.84 | 4,558 |
| Pitt | 10,329 | 48.14 | 5,105 | 23.79 | 2,639 | 12.30 | 1,554 | 7.24 | 602 | 2.81 | 454 | 2.12 | 117 | 0.55 | 92 | 0.43 | 47 | 0.22 | 38 | 0.18 | 31 | 0.14 | 27 | 0.13 | 25 | 0.12 | 8 | 0.04 | 13 | 0.06 | 376 | 1.75 | 21,457 |
| Polk | 1,066 | 41.85 | 521 | 20.46 | 299 | 11.74 | 284 | 11.15 | 132 | 5.18 | 106 | 4.16 | 96 | 3.77 | 17 | 0.67 | 3 | 0.12 | 2 | 0.08 | 2 | 0.08 | 3 | 0.12 | 2 | 0.08 | 5 | 0.20 | 0 | 0 | 9 | 0.35 | 2,547 |
| Randolph | 2,788 | 41.11 | 1,734 | 25.57 | 1,083 | 15.97 | 500 | 7.37 | 223 | 3.29 | 171 | 2.52 | 33 | 0.49 | 44 | 0.65 | 21 | 0.31 | 15 | 0.22 | 13 | 0.19 | 4 | 0.06 | 4 | 0.06 | 11 | 0.16 | 6 | 0.09 | 131 | 1.93 | 6,781 |
| Richmond | 2,654 | 53.79 | 701 | 14.21 | 693 | 14.05 | 175 | 3.55 | 72 | 1.46 | 85 | 1.72 | 59 | 1.20 | 44 | 0.89 | 20 | 0.41 | 18 | 0.36 | 15 | 0.30 | 14 | 0.28 | 10 | 0.20 | 15 | 0.30 | 3 | 0.06 | 356 | 7.22 | 4,934 |
| Robeson | 6,300 | 43.29 | 2,382 | 16.37 | 1,380 | 9.48 | 532 | 3.66 | 136 | 0.93 | 261 | 1.79 | 858 | 5.90 | 153 | 1.05 | 67 | 0.46 | 78 | 0.54 | 77 | 0.53 | 60 | 0.41 | 47 | 0.32 | 51 | 0.35 | 25 | 0.17 | 2,145 | 14.74 | 14,552 |
| Rockingham | 3,571 | 46.21 | 1,506 | 19.49 | 1,551 | 20.07 | 360 | 4.66 | 165 | 2.14 | 172 | 2.23 | 44 | 0.57 | 57 | 0.74 | 15 | 0.19 | 17 | 0.22 | 15 | 0.19 | 13 | 0.17 | 9 | 0.12 | 13 | 0.17 | 5 | 0.06 | 214 | 2.77 | 7,727 |
| Rowan | 4,799 | 46.14 | 2,393 | 23.01 | 1,507 | 14.49 | 662 | 6.37 | 298 | 2.87 | 226 | 2.17 | 102 | 0.98 | 59 | 0.57 | 26 | 0.25 | 27 | 0.26 | 21 | 0.20 | 14 | 0.13 | 11 | 0.11 | 13 | 0.13 | 11 | 0.11 | 231 | 2.22 | 10,400 |
| Rutherford | 2,153 | 47.01 | 1,146 | 25.02 | 403 | 8.80 | 276 | 6.03 | 98 | 2.14 | 105 | 2.29 | 200 | 4.37 | 37 | 0.81 | 11 | 0.24 | 3 | 0.07 | 9 | 0.20 | 6 | 0.13 | 8 | 0.17 | 5 | 0.11 | 1 | 0.02 | 119 | 2.60 | 4,580 |
| Sampson | 2,839 | 55.44 | 862 | 16.83 | 818 | 15.97 | 213 | 4.16 | 53 | 1.03 | 62 | 1.21 | 27 | 0.53 | 26 | 0.51 | 11 | 0.21 | 14 | 0.27 | 20 | 0.39 | 9 | 0.18 | 9 | 0.18 | 5 | 0.10 | 5 | 0.10 | 148 | 2.89 | 5,121 |
| Scotland | 2,075 | 55.16 | 529 | 14.06 | 330 | 8.77 | 155 | 4.12 | 65 | 1.73 | 95 | 2.53 | 212 | 5.64 | 43 | 1.14 | 13 | 0.35 | 17 | 0.45 | 8 | 0.21 | 5 | 0.13 | 7 | 0.19 | 11 | 0.29 | 4 | 0.11 | 193 | 5.13 | 3,762 |
| Stanly | 1,775 | 47.50 | 740 | 19.80 | 537 | 14.37 | 223 | 5.97 | 101 | 2.70 | 89 | 2.38 | 58 | 1.55 | 34 | 0.91 | 14 | 0.37 | 9 | 0.24 | 2 | 0.05 | 8 | 0.21 | 7 | 0.19 | 9 | 0.24 | 2 | 0.05 | 129 | 3.45 | 3,737 |
| Stokes | 1,213 | 40.22 | 681 | 22.58 | 533 | 17.67 | 174 | 5.77 | 92 | 3.05 | 74 | 2.45 | 38 | 1.26 | 21 | 0.70 | 4 | 0.13 | 5 | 0.17 | 6 | 0.20 | 6 | 0.20 | 4 | 0.13 | 3 | 0.10 | 2 | 0.07 | 160 | 5.31 | 3,016 |
| Surry | 1,949 | 41.60 | 1,021 | 21.79 | 827 | 17.65 | 305 | 6.51 | 119 | 2.54 | 147 | 3.14 | 42 | 0.90 | 37 | 0.79 | 14 | 0.30 | 8 | 0.17 | 14 | 0.30 | 5 | 0.11 | 5 | 0.11 | 12 | 0.26 | 6 | 0.13 | 174 | 3.71 | 4,685 |
| Swain | 554 | 34.69 | 470 | 29.43 | 161 | 10.08 | 111 | 6.95 | 64 | 4.01 | 58 | 3.63 | 82 | 5.13 | 21 | 1.31 | 5 | 0.31 | 3 | 0.19 | 2 | 0.13 | 4 | 0.25 | 1 | 0.06 | 4 | 0.25 | 2 | 0.13 | 55 | 3.44 | 1,597 |
| Transylvania | 1,890 | 35.83 | 1,288 | 24.42 | 552 | 10.46 | 692 | 13.12 | 298 | 5.65 | 304 | 5.76 | 148 | 2.81 | 33 | 0.63 | 7 | 0.13 | 0 | 0 | 6 | 0.11 | 1 | 0.02 | 5 | 0.09 | 2 | 0.04 | 0 | 0 | 49 | 0.93 | 5,275 |
| Tyrrell | 220 | 39.36 | 91 | 16.28 | 98 | 17.53 | 22 | 3.94 | 15 | 2.68 | 20 | 3.58 | 4 | 0.72 | 7 | 1.25 | 2 | 0.36 | 0 | 0 | 6 | 1.07 | 1 | 0.18 | 0 | 0 | 2 | 0.36 | 1 | 0.18 | 70 | 12.52 | 559 |
| Union | 9,117 | 44.44 | 4,587 | 22.36 | 3,069 | 14.96 | 1,767 | 8.61 | 844 | 4.11 | 506 | 2.47 | 157 | 0.77 | 103 | 0.50 | 42 | 0.20 | 31 | 0.15 | 24 | 0.12 | 20 | 0.10 | 19 | 0.09 | 11 | 0.05 | 10 | 0.05 | 207 | 1.01 | 20,514 |
| Vance | 3,348 | 59.20 | 794 | 14.04 | 768 | 13.58 | 217 | 3.84 | 58 | 1.03 | 87 | 1.54 | 36 | 0.64 | 46 | 0.81 | 12 | 0.21 | 21 | 0.37 | 20 | 0.35 | 11 | 0.19 | 11 | 0.19 | 7 | 0.12 | 8 | 0.14 | 211 | 3.73 | 5,655 |
| Wake | 79,007 | 40.53 | 50,919 | 26.12 | 23,544 | 12.08 | 27,837 | 14.28 | 6,821 | 3.50 | 3,759 | 1.93 | 505 | 0.26 | 812 | 0.42 | 403 | 0.21 | 175 | 0.09 | 121 | 0.06 | 89 | 0.05 | 85 | 0.04 | 35 | 0.02 | 51 | 0.03 | 763 | 0.39 | 194,926 |
| Warren | 2,211 | 57.49 | 548 | 14.25 | 480 | 12.48 | 132 | 3.43 | 46 | 1.20 | 68 | 1.77 | 22 | 0.57 | 38 | 0.99 | 10 | 0.26 | 20 | 0.52 | 12 | 0.31 | 12 | 0.31 | 14 | 0.36 | 43 | 1.12 | 6 | 0.16 | 184 | 4.78 | 3,846 |
| Washington | 1,079 | 55.82 | 292 | 15.11 | 269 | 13.92 | 56 | 2.90 | 13 | 0.67 | 43 | 2.22 | 38 | 1.97 | 12 | 0.62 | 6 | 0.31 | 4 | 0.21 | 4 | 0.21 | 4 | 0.21 | 6 | 0.31 | 6 | 0.31 | 3 | 0.16 | 98 | 5.07 | 1,933 |
| Watauga | 2,298 | 23.13 | 4,707 | 47.38 | 716 | 7.21 | 1,336 | 13.45 | 469 | 4.72 | 245 | 2.47 | 49 | 0.49 | 37 | 0.37 | 26 | 0.26 | 8 | 0.08 | 3 | 0.03 | 7 | 0.07 | 4 | 0.04 | 2 | 0.02 | 1 | 0.01 | 26 | 0.26 | 9,934 |
| Wayne | 5,781 | 49.69 | 2,340 | 20.11 | 1,672 | 14.37 | 493 | 4.24 | 207 | 1.78 | 198 | 1.70 | 115 | 0.99 | 76 | 0.65 | 32 | 0.28 | 55 | 0.47 | 39 | 0.34 | 18 | 0.15 | 29 | 0.25 | 12 | 0.10 | 11 | 0.09 | 556 | 4.78 | 11,634 |
| Wilkes | 1,787 | 45.02 | 873 | 22.00 | 634 | 15.97 | 247 | 6.22 | 87 | 2.19 | 84 | 2.12 | 22 | 0.55 | 18 | 0.45 | 6 | 0.15 | 7 | 0.18 | 7 | 0.18 | 7 | 0.18 | 3 | 0.08 | 3 | 0.08 | 4 | 0.10 | 180 | 4.54 | 3,969 |
| Wilson | 5,063 | 52.06 | 1,928 | 19.82 | 1,546 | 15.90 | 409 | 4.21 | 143 | 1.47 | 149 | 1.53 | 61 | 0.63 | 61 | 0.63 | 26 | 0.27 | 25 | 0.26 | 34 | 0.35 | 19 | 0.20 | 10 | 0.10 | 13 | 0.13 | 14 | 0.14 | 225 | 2.31 | 9,726 |
| Yadkin | 784 | 41.68 | 461 | 24.51 | 302 | 16.06 | 120 | 6.38 | 46 | 2.45 | 50 | 2.66 | 13 | 0.69 | 15 | 0.80 | 1 | 0.05 | 2 | 0.11 | 4 | 0.21 | 1 | 0.05 | 2 | 0.11 | 2 | 0.11 | 0 | 0 | 78 | 4.15 | 1,881 |
| Yancey | 848 | 34.77 | 709 | 29.07 | 206 | 8.45 | 318 | 13.04 | 79 | 3.24 | 79 | 3.24 | 76 | 3.12 | 27 | 1.11 | 3 | 0.12 | 2 | 0.08 | 4 | 0.16 | 4 | 0.16 | 2 | 0.08 | 5 | 0.21 | 0 | 0 | 77 | 3.16 | 2,439 |
| Total | 572,271 | 42.95 | 322,645 | 24.22 | 172,558 | 12.95 | 139,912 | 10.50 | 43,632 | 3.27 | 30,742 | 2.31 | 10,679 | 0.80 | 6,622 | 0.50 | 2,973 | 0.22 | 2,181 | 0.16 | 1,978 | 0.15 | 1,341 | 0.10 | 1,243 | 0.09 | 1,098 | 0.08 | 699 | 0.05 | 21,808 | 1.64 | 1,332,382 |
Republican primary
The North Carolina Republican Party submitted to the state only the name of incumbent President Donald Trump to be listed on the primary ballot. The campaign of Bill Weld "has written to the [state Board of Elections] asking to be added to the ballot, arguing that his candidacy meets the legal test because he’s received widespread news coverage, raised more than $1.2 million, and has qualified for the primary ballot in six other states," according to the News and Observer.[7] Joe Walsh similarly petitioned the state board of elections. On Dec. 20, 2019, the state board unanimously voted to include both Weld and Walsh on the ballot.[8]
Republican primary polling
| Poll source | Date(s) administered |
Sample size[lower-alpha 3] |
Margin of error |
Donald Trump |
Joe Walsh |
Bill Weld |
Undecided |
|---|---|---|---|---|---|---|---|
| SurveyUSA | Feb 13–16, 2020 | 501 (LV) | ± 5.0% | 91% | – | 5% | 5% |
| High Point University | Jan 31–Feb 6, 2020 | 198 (LV) | – | 91% | 4% | 1% | 4% |
| 400 (RV) | – | 88% | 4% | 1% | 7% | ||
| Emerson College | May 31–Jun 3, 2019 | 336 (LV) | ± 3.1% | 88% | – | 12% | – |
Results
| 2020 North Carolina Republican primary[9] | |||
|---|---|---|---|
| Candidate | Popular vote | Delegates[10] | |
| Count | Percentage | ||
| 750,600 | 93.53% | 71 | |
| Joe Walsh | 16,356 | 2.04% | 0 |
| Bill Weld | 15,486 | 1.93% | 0 |
| No Preference | 20,085 | 2.50% | 0 |
| Total | 802,527 | 100% | 71 |
Results by county
| 2020 North Carolina Republican primary
(results per county)[9] | |||||||||
|---|---|---|---|---|---|---|---|---|---|
| County | Donald Trump | Joe Walsh | Bill Weld | No Preference | Total votes cast | ||||
| Votes | % | Votes | % | Votes | % | Votes | % | ||
| Alamance | 12,843 | 94.08 | 259 | 1.90 | 208 | 1.52 | 341 | 2.50 | 13,651 |
| Alexander | 5,402 | 96.43 | 71 | 1.27 | 53 | 0.95 | 76 | 1.36 | 5,602 |
| Alleghany | 1,433 | 95.85 | 21 | 1.40 | 9 | 0.60 | 32 | 2.14 | 1,495 |
| Anson | 1,145 | 97.36 | 13 | 1.11 | 6 | 0.51 | 12 | 1.02 | 1,176 |
| Ashe | 3,321 | 94.24 | 86 | 2.44 | 39 | 1.11 | 78 | 2.21 | 3,524 |
| Avery | 3,748 | 93.54 | 77 | 1.92 | 61 | 1.52 | 121 | 3.02 | 4,007 |
| Beaufort | 5,332 | 95.88 | 78 | 1.40 | 63 | 1.13 | 88 | 1.58 | 5,561 |
| Bertie | 735 | 97.87 | 8 | 1.07 | 2 | 0.27 | 6 | 0.80 | 751 |
| Bladen | 3,044 | 97.91 | 23 | 0.74 | 12 | 0.39 | 30 | 0.96 | 3,109 |
| Brunswick | 15,269 | 94.17 | 291 | 1.79 | 273 | 1.68 | 382 | 2.36 | 16,215 |
| Buncombe | 17,893 | 92.52 | 431 | 2.23 | 476 | 2.46 | 539 | 2.79 | 19,339 |
| Burke | 7,547 | 95.23 | 121 | 1.53 | 94 | 1.19 | 163 | 2.06 | 7,925 |
| Cabarrus | 16,516 | 92.93 | 403 | 2.27 | 347 | 1.95 | 506 | 2.85 | 17,772 |
| Caldwell | 8,044 | 96.19 | 118 | 1.41 | 89 | 1.06 | 112 | 1.34 | 8,363 |
| Camden | 1,348 | 94.53 | 23 | 1.61 | 28 | 1.96 | 27 | 1.89 | 1,426 |
| Carteret | 10,696 | 95.25 | 172 | 1.53 | 138 | 1.23 | 223 | 1.99 | 11,229 |
| Caswell | 1,587 | 97.84 | 15 | 0.92 | 8 | 0.49 | 12 | 0.74 | 1,622 |
| Catawba | 18,807 | 93.74 | 411 | 2.05 | 337 | 1.68 | 508 | 2.53 | 20,063 |
| Chatham | 5,793 | 92.78 | 127 | 2.03 | 185 | 2.96 | 139 | 2.23 | 6,244 |
| Cherokee | 5,030 | 95.14 | 83 | 1.57 | 77 | 1.46 | 97 | 1.83 | 5,287 |
| Chowan | 1,239 | 96.50 | 11 | 0.86 | 9 | 0.70 | 25 | 1.95 | 1,284 |
| Clay | 2,237 | 94.51 | 33 | 1.39 | 37 | 1.56 | 60 | 2.53 | 2,367 |
| Cleveland | 8,049 | 96.73 | 79 | 0.95 | 79 | 0.95 | 114 | 1.37 | 8,321 |
| Columbus | 3,521 | 98.05 | 19 | 0.53 | 16 | 0.45 | 35 | 0.97 | 3,591 |
| Craven | 10,937 | 94.96 | 178 | 1.55 | 160 | 1.39 | 243 | 2.11 | 11,518 |
| Cumberland | 13,965 | 94.21 | 286 | 1.93 | 219 | 1.48 | 354 | 2.39 | 14,824 |
| Currituck | 3,658 | 92.75 | 80 | 2.03 | 65 | 1.65 | 141 | 3.58 | 3,944 |
| Dare | 3,082 | 93.65 | 79 | 2.40 | 66 | 2.01 | 64 | 1.94 | 3,291 |
| Davidson | 18,716 | 95.45 | 304 | 1.55 | 229 | 1.17 | 359 | 1.83 | 19,608 |
| Davie | 6,753 | 92.25 | 163 | 2.23 | 147 | 2.01 | 257 | 3.51 | 7,320 |
| Duplin | 4,252 | 97.57 | 26 | 0.60 | 20 | 0.46 | 60 | 1.38 | 4,358 |
| Durham | 6,768 | 83.74 | 424 | 5.25 | 505 | 6.25 | 385 | 4.76 | 8,082 |
| Edgecombe | 1,828 | 96.46 | 13 | 0.69 | 12 | 0.63 | 42 | 2.22 | 1,895 |
| Forsyth | 23,307 | 90.19 | 784 | 3.03 | 745 | 2.88 | 1,005 | 3.89 | 25,841 |
| Franklin | 5,011 | 94.98 | 97 | 1.84 | 57 | 1.08 | 111 | 2.10 | 5,276 |
| Gaston | 16,573 | 95.26 | 290 | 1.67 | 211 | 1.21 | 324 | 1.86 | 17,398 |
| Gates | 529 | 95.83 | 9 | 1.63 | 5 | 0.91 | 9 | 1.63 | 552 |
| Graham | 1,513 | 97.11 | 17 | 1.09 | 15 | 0.96 | 13 | 0.83 | 1,558 |
| Granville | 3,315 | 95.64 | 56 | 1.62 | 38 | 1.10 | 57 | 1.64 | 3,466 |
| Greene | 1,474 | 98.60 | 10 | 0.67 | 3 | 0.20 | 8 | 0.54 | 1,495 |
| Guilford | 27,561 | 91.32 | 828 | 2.74 | 790 | 2.62 | 1,003 | 3.32 | 30,182 |
| Halifax | 2,035 | 97.51 | 22 | 1.05 | 9 | 0.43 | 21 | 1.01 | 2,087 |
| Harnett | 9,093 | 95.56 | 124 | 1.30 | 112 | 1.18 | 186 | 1.95 | 9,515 |
| Haywood | 7,079 | 94.77 | 111 | 1.49 | 113 | 1.51 | 167 | 2.24 | 7,470 |
| Henderson | 16,339 | 94.70 | 252 | 1.46 | 277 | 1.61 | 386 | 2.24 | 17,254 |
| Hertford | 605 | 97.42 | 7 | 1.13 | 6 | 0.97 | 3 | 0.48 | 621 |
| Hoke | 1,916 | 94.95 | 32 | 1.59 | 27 | 1.34 | 43 | 2.13 | 2,018 |
| Hyde | 339 | 97.98 | 3 | 0.87 | 3 | 0.87 | 1 | 0.29 | 346 |
| Iredell | 21,150 | 93.18 | 501 | 2.21 | 376 | 1.66 | 672 | 2.96 | 22,699 |
| Jackson | 3,143 | 93.13 | 75 | 2.22 | 67 | 1.99 | 90 | 2.67 | 3,375 |
| Johnston | 19,073 | 94.89 | 350 | 1.74 | 257 | 1.28 | 420 | 2.09 | 20,100 |
| Jones | 1,021 | 97.80 | 8 | 0.77 | 4 | 0.38 | 11 | 1.05 | 1,044 |
| Lee | 3,648 | 95.40 | 52 | 1.36 | 48 | 1.26 | 76 | 1.99 | 3,824 |
| Lenoir | 4,822 | 96.83 | 46 | 0.92 | 32 | 0.64 | 80 | 1.61 | 4,980 |
| Lincoln | 10,616 | 94.10 | 216 | 1.91 | 168 | 1.49 | 282 | 2.50 | 11,282 |
| Macon | 5,527 | 94.61 | 111 | 1.90 | 79 | 1.35 | 125 | 2.14 | 5,842 |
| Madison | 2,073 | 96.37 | 26 | 1.21 | 16 | 0.74 | 36 | 1.67 | 2,151 |
| Martin | 1,370 | 97.23 | 17 | 1.21 | 8 | 0.57 | 14 | 0.99 | 1,409 |
| McDowell | 6,392 | 94.31 | 134 | 1.98 | 86 | 1.27 | 166 | 2.45 | 6,778 |
| Mecklenburg | 33,693 | 87.34 | 1,548 | 4.01 | 1,738 | 4.51 | 1,600 | 4.15 | 38,579 |
| Mitchell | 3,893 | 93.27 | 90 | 2.16 | 74 | 1.77 | 117 | 2.80 | 4,174 |
| Montgomery | 2,516 | 96.84 | 19 | 0.73 | 25 | 0.96 | 38 | 1.46 | 2,598 |
| Moore | 13,518 | 92.34 | 297 | 2.03 | 331 | 2.26 | 494 | 3.37 | 14,640 |
| Nash | 8,367 | 96.53 | 80 | 0.92 | 72 | 0.83 | 149 | 1.72 | 8,668 |
| New Hanover | 16,699 | 90.87 | 501 | 2.73 | 525 | 2.86 | 652 | 3.55 | 18,377 |
| Northampton | 659 | 97.34 | 4 | 0.59 | 4 | 0.59 | 10 | 1.48 | 677 |
| Onslow | 14,087 | 95.08 | 210 | 1.42 | 163 | 1.10 | 356 | 2.40 | 14,816 |
| Orange | 4,312 | 86.67 | 199 | 4.00 | 286 | 5.75 | 178 | 3.58 | 4,975 |
| Pamlico | 1,667 | 95.48 | 29 | 1.66 | 18 | 1.03 | 32 | 1.83 | 1,746 |
| Pasquotank | 2,081 | 94.94 | 40 | 1.82 | 21 | 0.96 | 50 | 2.28 | 2,192 |
| Pender | 5,339 | 96.25 | 56 | 1.01 | 69 | 1.24 | 83 | 1.50 | 5,547 |
| Perquimans | 1,213 | 95.89 | 16 | 1.26 | 14 | 1.11 | 22 | 1.74 | 1,265 |
| Person | 2,757 | 97.15 | 31 | 1.09 | 19 | 0.67 | 31 | 1.09 | 2,838 |
| Pitt | 10,327 | 94.66 | 212 | 1.94 | 133 | 1.22 | 237 | 2.17 | 10,909 |
| Polk | 2,157 | 95.87 | 34 | 1.51 | 31 | 1.38 | 28 | 1.24 | 2,250 |
| Randolph | 15,612 | 96.44 | 195 | 1.20 | 155 | 0.96 | 226 | 1.40 | 16,188 |
| Richmond | 2,946 | 96.84 | 31 | 1.02 | 18 | 0.59 | 47 | 1.55 | 3,042 |
| Robeson | 3,620 | 95.89 | 57 | 1.51 | 26 | 0.69 | 72 | 1.91 | 3,775 |
| Rockingham | 8,190 | 96.59 | 103 | 1.21 | 58 | 0.68 | 128 | 1.51 | 8,479 |
| Rowan | 14,447 | 95.35 | 235 | 1.55 | 195 | 1.29 | 274 | 1.81 | 15,151 |
| Rutherford | 7,214 | 95.50 | 104 | 1.38 | 95 | 1.26 | 141 | 1.87 | 7,554 |
| Sampson | 4,942 | 97.15 | 42 | 0.83 | 34 | 0.67 | 69 | 1.36 | 5,087 |
| Scotland | 1,102 | 95.41 | 20 | 1.73 | 13 | 1.13 | 20 | 1.73 | 1,155 |
| Stanly | 8,195 | 94.75 | 184 | 2.13 | 90 | 1.04 | 180 | 2.08 | 8,649 |
| Stokes | 7,316 | 95.14 | 112 | 1.46 | 71 | 0.92 | 191 | 2.48 | 7,690 |
| Surry | 7,259 | 95.19 | 118 | 1.55 | 87 | 1.14 | 162 | 2.12 | 7,626 |
| Swain | 1,128 | 94.00 | 23 | 1.92 | 18 | 1.50 | 31 | 2.58 | 1,200 |
| Transylvania | 3,797 | 94.71 | 60 | 1.50 | 68 | 1.70 | 84 | 2.10 | 4,009 |
| Tyrrell | 225 | 96.57 | 3 | 1.29 | 1 | 0.43 | 4 | 1.72 | 233 |
| Union | 21,182 | 94.76 | 371 | 1.66 | 378 | 1.69 | 422 | 1.89 | 22,353 |
| Vance | 1,210 | 96.11 | 19 | 1.51 | 12 | 0.95 | 18 | 1.43 | 1,259 |
| Wake | 52,255 | 88.57 | 2,025 | 3.43 | 2,518 | 4.27 | 2,199 | 3.73 | 58,997 |
| Warren | 791 | 95.53 | 12 | 1.45 | 11 | 1.33 | 14 | 1.69 | 828 |
| Washington | 641 | 96.68 | 5 | 0.75 | 7 | 1.06 | 10 | 1.51 | 663 |
| Watauga | 3,619 | 91.76 | 101 | 2.56 | 125 | 3.17 | 99 | 2.51 | 3,944 |
| Wayne | 10,479 | 96.36 | 109 | 1.00 | 93 | 0.86 | 194 | 1.78 | 10,875 |
| Wilkes | 10,885 | 95.02 | 171 | 1.49 | 147 | 1.28 | 252 | 2.20 | 11,455 |
| Wilson | 5,278 | 96.58 | 57 | 1.04 | 48 | 0.88 | 82 | 1.50 | 5,465 |
| Yadkin | 6,352 | 95.89 | 105 | 1.59 | 44 | 0.66 | 123 | 1.86 | 6,624 |
| Yancey | 2,568 | 96.98 | 24 | 0.91 | 30 | 1.13 | 26 | 0.98 | 2,648 |
| Total | 750,600 | 93.53% | 16,356 | 2.04% | 15,486 | 1.93% | 20,085 | 2.50% | 802,527 |
Libertarian primary
Results
| North Carolina Libertarian presidential primary, March 3, 2020[11] | ||
|---|---|---|
| Candidate | Votes | Percentage |
| None of the above | 2,060 | 30% |
| Jacob Hornberger | 604 | 9% |
| John McAfee | 570 | 8% |
| Kim Ruff (withdrawn) | 545 | 8% |
| Vermin Supreme | 410 | 6% |
| Ken Armstrong | 366 | 5% |
| Jo Jorgensen | 316 | 5% |
| Steve Richey | 278 | 4% |
| Adam Kokesh | 240 | 3% |
| Max Abramson | 236 | 3% |
| James Ogle | 232 | 3% |
| Kenneth Blevins | 199 | 3% |
| Dan Behrman | 194 | 3% |
| Jedidiah Hill | 194 | 3% |
| Souraya Faas | 193 | 3% |
| Erik Gerhardt | 150 | 2% |
| Arvin Vohra | 127 | 2% |
| Total | 6,914 | 100% |
Green primary
Results
| Party | Candidate | Votes | % | |
|---|---|---|---|---|
| Green | Howie Hawkins | 247 | 60.54% | |
| Green | No Preference | 161 | 39.46% | |
| Total votes | 408 | 100% | ||
Constitution primary
Results
| Party | Candidate | Votes | % | |
|---|---|---|---|---|
| Constitution | No Preference | 193 | 44.57% | |
| Constitution | Don Blankenship | 128 | 29.56% | |
| Constitution | Charles Kraut | 112 | 25.87% | |
| Total votes | 438 | 100% | ||
General election
Predictions
| Source | Ranking | As of |
|---|---|---|
| The Cook Political Report[15] | Tossup | July 23, 2020 |
| Inside Elections[16] | Tossup | July 17, 2020 |
| Sabato's Crystal Ball[17] | Tossup | July 14, 2020 |
| Politico[18] | Tossup | July 6, 2020 |
| RCP[19] | Tossup | August 3, 2020 |
| Niskanen[20] | Tossup | March 24, 2020 |
| CNN[21] | Tossup | August 3, 2020 |
| The Economist[22] | Tossup | August 11, 2020 |
| CBS News[23] | Tossup | August 9, 2020 |
| 270towin[24] | Tossup | August 2, 2020 |
| ABC News[25] | Tossup | July 31, 2020 |
| NPR[26] | Tossup | August 3, 2020 |
| NBC News[27] | Tossup | August 6, 2020 |
| 538[28] | Tossup | August 14, 2020 |
Polling
Aggregate polls
| Donald Trump vs. Joe Biden | ||||||
|---|---|---|---|---|---|---|
| Source of poll aggregation | Dates administered | Dates updated | Joe Biden | Donald Trump | Other/Undecided[lower-alpha 37] | Margin |
| 270 to Win | July 17–31, 2020 | August 2, 2020 | 47.2% | 45.5% | 7.3% | Biden +1.7 |
| Real Clear Politics | July 28 – August 10, 2020 | August 13, 2020 | 47.0% | 47.0% | 6.0% | Even |
| FiveThirtyEight | until August 7, 2020 | August 10, 2020 | 47.6% | 45.4% | 7.0% | Biden +2.2 |
| Average | 47.3% | 46.0% | 6.7% | Biden +1.3 | ||
June 1 – October 31, 2020
| Poll source | Date(s) administered |
Sample size[lower-alpha 3] |
Margin of error |
Donald Trump (R) |
Joe Biden (D) |
Jo Jorgensen (L) |
Howie Hawkins (G) |
Other | Undecided |
|---|---|---|---|---|---|---|---|---|---|
| East Carolina University | Aug 12-13, 2020 | 1,255 (RV) | ± 3.2% | 47% | 47% | - | - | 3% | 4% |
| NC Civitas/Harper Polling | Aug 6–10, 2020 | 600 (LV) | ± 4.0% | 44% | 45% | 2% | 1% | 1% | 7% |
| Emerson College | Aug 8–10, 2020 | 673 (LV) | ± 3.8% | 48% | 46% | – | – | – | 6% |
| CNBC/Change Research | Aug 7–9, 2020 | 493 (LV) | – | 48% | 47% | – | – | – | – |
| Rasmussen Reports/Pulse Opinion Research | Aug 6–8, 2020 | 750 (LV) | ± 3.6% | 48% | 47% | – | – | – | – |
| Data for Progress | Jul 24 – Aug 2, 2020 | 1,170 (LV) | – | 45% | 49% | – | – | – | 6% |
| 44% | 46% | 2% | 1% | – | 7% | ||||
| Public Policy Polling | Jul 30–31, 2020 | 934 (V) | – | 46% | 49% | – | – | – | 6% |
| CBS News/YouGov | Jul 28–31, 2020 | 1,129 (LV) | ± 3.9% | 44% | 48% | – | – | 2% | 5% |
| HIT Strategies (D) | Jul 23–31, 2020 | 400 (RV) | ± 4.9% | 37% | 47% | – | – | 3% | 10% |
| Change Research/CNBC | Jul 24–26, 2020 | 284 (LV) | – | 46% | 49% | – | – | – | – |
| Morning Consult | Jul 17–26, 2020 | 1,504 (LV) | ± 2.5% | 47% | 47% | – | – | – | – |
| Public Policy Polling | Jul 23–24, 2020 | 884 (V) | – | 46% | 49% | – | – | – | 5% |
| Cardinal Point Analytics | Jul 22–24, 2020 | 735 (LV) | ± 3.6% | 48% | 47% | 1% | – | – | 4% |
| Zogby Analytics | July 21–23, 2020 | 809 (RV) | ± 3.4% | 40% | 44% | 4% | 1% | – | – |
| NBC News/Marist College | July 14–22, 2020 | 882 (RV) | ± 4.0% | 44% | 51% | – | – | 2% | 4% |
| Redfield & Wilton Strategies | Jul 19–21, 2020 | 919 (RV) | – | 42% | 43% | 2% | 1% | 1% | 11% |
| Spry Strategies | July 11–16, 2020 | 600 (LV) | ± 3.7% | 49% | 46% | – | – | – | 5% |
| Cardinal Point Analytics | July 13–15, 2020 | 547 (LV) | ± 4.2% | 49% | 48% | – | – | 1% | 3% |
| Change Research/CNBC | July 10–12, 2020 | 655 (LV) | – | 46% | 47% | – | – | – | – |
| Public Policy Polling | July 7–8, 2020 | 818 (V) | ± 3.4% | 46% | 50% | – | – | – | 5% |
| Change Research/CNBC | June 26–28, 2020 | 468 (LV)[lower-alpha 38] | – | 44% | 51% | – | – | – | – |
| East Carolina University | June 22–25, 2020 | 1,149 (RV) | ± 3.4% | 44% | 45% | – | – | 7%[lower-alpha 39] | 4% |
| Public Policy Polling | June 22–23, 2020 | 1,157 (V) | – | 46% | 48% | – | – | – | 6% |
| Fox News | June 20–23, 2020 | 1,012 (RV) | ± 3% | 45% | 47% | – | – | 5%[lower-alpha 40] | 3% |
| NYT Upshot/Siena College | June 8–18, 2020 | 653 (RV) | ± 4.1% | 40% | 49% | – | – | 4%[lower-alpha 41] | 7% |
| Gravis Marketing/OANN | June 17, 2020 | 631 (RV) | ± 3.9% | 46% | 43% | – | – | – | 10% |
| Redfield & Whilton Strategies | Jun 14–17, 2020 | 902 (LV) | ± 3.26% | 40% | 46% | 1% | <1% | 1% | 11% |
| Change Research/CNBC | June 12–14, 2020 | 378 (LV)[lower-alpha 42] | – | 45% | 47% | 1% | 1% | – | – |
| Public Policy Polling | June 2–3, 2020 | 913 (V) | ± 3.2% | 45% | 49% | – | – | – | 6% |
January 1, 2020 – May 31, 2020
| Poll source | Date(s) administered |
Sample size[lower-alpha 3] |
Margin of error |
Donald Trump (R) |
Joe Biden (D) |
Other | Undecided |
|---|---|---|---|---|---|---|---|
| Change Research/CNBC | May 29–31, 2020 | 806 (LV) | – | 45% | 46% | 4% | 4% |
| Harper Polling/Civitas | May 26–28, 2020 | 500 (LV) | ± 4.38% | 47% | 44% | – | 9% |
| Neighbourhood Research & Media | May 12–21, 2020 | 391 (LV) | – | 42% | 42% | – | – |
| Redfield & Wilton Strategies | May 10–14, 2020 | 859 (LV) | ± 3.3% | 43% | 45% | 3%[lower-alpha 43] | 8% |
| Meeting Street Insights (R) | May 9-13, 2020 | 500 (RV) | – | 47% | 47% | – | 6% |
| East Carolina University | May 7–9, 2020 | 1,111 (RV) | ± 3.4% | 46% | 43% | 7%[lower-alpha 44] | 4% |
| Civiqs/Daily Kos | May 2–4, 2020 | 1,362 (RV) | ± 3% | 46% | 49% | 4%[lower-alpha 45] | 2% |
| Meredith College | Apr 27–28, 2020 | 604 (RV) | ± 4.0% | 40% | 47% | 5%[lower-alpha 46] | 7% |
| SurveyUSA | Apr 23–26, 2020 | 580 (LV) | ± 5.5% | 45% | 50% | – | 5% |
| Public Policy Polling[upper-alpha 1] | Apr 20–21, 2020 | 1,275 (RV) | – | 46% | 49% | – | 5% |
| Garin-Hart-Yang/Put NC First (D) | Apr 13–18, 2020 | 800 (LV) | – | 45% | 48% | – | – |
| GBAO Strategies/PLUS Paid Family Leave | Apr 13–16, 2020 | 500 (LV) | – | 46% | 48% | 1% | 4% |
| Public Policy Polling | Apr 14–15, 2020 | 1,318 (V) | – | 47% | 48% | – | 5% |
| Harper Polling | Apr 5–7, 2020 | 500 (LV) | ± 4.4% | 49% | 42% | – | 9% |
| East Carolina University | Feb 27–28, 2020 | 1,288 (RV) | ± 3.2% | 46% | 48% | – | – |
| NBC News/Marist College | Feb 23–27, 2020 | 2,120 (RV) | ± 2.4% | 45% | 49% | 1% | 5% |
| SurveyUSA | Feb 13–16, 2020 | 2,366 (RV) | ± 2.5% | 45% | 49% | – | 6% |
| Climate Nexus | Feb 11–15, 2020 | 675 (RV) | ± 3.9% | 44% | 46% | – | 11% |
January 1, 2018 – December 31, 2019
| Poll source | Date(s) administered |
Sample size[lower-alpha 3] |
Margin of error |
Donald Trump (R) |
Joe Biden (D) |
Other | Undecided |
|---|---|---|---|---|---|---|---|
| Fox News | Nov 10–13, 2019 | 1,504 (RV) | ± 2.5% | 43% | 45% | 5% | 5% |
| NYT Upshot/Siena College | Oct 13–26, 2019 | 651 (LV) | ± 4.4% | 48% | 46% | – | – |
| East Carolina University | Oct 2–9, 2019 | 1,076 (RV) | ± 3.0% | 46% | 50% | 4% | –[lower-alpha 47] |
| Meredith College | Sep 29 – Oct 7, 2019 | 996 (RV) | ± 3.0% | 38% | 35% | 20%[lower-alpha 48] | 7% |
| Public Policy Polling | Oct 4–6, 2019 | 963 | ± 3.2% | 46% | 51% | – | 4% |
| SurveyUSA | Aug 1–5, 2019 | 2,113 | ± 2.7% | 41% | 49% | – | 10% |
| Harper Polling | Aug 1–4, 2019 | 500 | ± 4.4% | 45% | 44% | – | 11% |
| Fabrizio Ward/AARP | Jul 29–31, 2019 | 600 | ± 4.0% | 45% | 49% | – | 5% |
| Public Policy Polling | Jun 17–18, 2019 | 610 | ± 4.0% | 46% | 49% | – | 5% |
| Emerson College | May 31 – Jun 3, 2019 | 932 | ± 3.1% | 44% | 56% | – | – |
| Spry Strategies (R)[upper-alpha 2] | May 25 – Jun 1, 2019 | 730 | – | 52% | 41% | – | 7% |
| Harper Polling | Feb 11–13, 2019 | 500 | ± 4.4% | 43% | 39% | 7% | 11% |
| Public Policy Polling | Jan 4–7, 2019 | 750 | ± 3.6% | 44% | 49% | – | 7% |
| Meredith College | Jan 21–25, 2018 | 621 | ± 4.0% | 45% | 46% | 8% | 1% |
Former candidates | ||||||||||||||||||||||||||||||||||||||||||||||||||||||||||||||||||||||||||||||||||||||||||||||||||||||||||||||||||||||||||||||||||||||||||||||||||||||||||||||||||||||||||||||||||||||||||||||||||||||||||||||||||||||||||||||||||||||||||||||||||||||||||||||||||||||||||||||||||||||||||||||||||||||||||||||||||||||||||||||||||||||||||||||||||||||||||||||||||||||||||||||||||||||||||||||||||||||||||||||||||||||||||||||||||||||||||||||||||||||||||||||||||||||||||||||||||||||||||||||||||||||||||||||||||||||||||||||||
|---|---|---|---|---|---|---|---|---|---|---|---|---|---|---|---|---|---|---|---|---|---|---|---|---|---|---|---|---|---|---|---|---|---|---|---|---|---|---|---|---|---|---|---|---|---|---|---|---|---|---|---|---|---|---|---|---|---|---|---|---|---|---|---|---|---|---|---|---|---|---|---|---|---|---|---|---|---|---|---|---|---|---|---|---|---|---|---|---|---|---|---|---|---|---|---|---|---|---|---|---|---|---|---|---|---|---|---|---|---|---|---|---|---|---|---|---|---|---|---|---|---|---|---|---|---|---|---|---|---|---|---|---|---|---|---|---|---|---|---|---|---|---|---|---|---|---|---|---|---|---|---|---|---|---|---|---|---|---|---|---|---|---|---|---|---|---|---|---|---|---|---|---|---|---|---|---|---|---|---|---|---|---|---|---|---|---|---|---|---|---|---|---|---|---|---|---|---|---|---|---|---|---|---|---|---|---|---|---|---|---|---|---|---|---|---|---|---|---|---|---|---|---|---|---|---|---|---|---|---|---|---|---|---|---|---|---|---|---|---|---|---|---|---|---|---|---|---|---|---|---|---|---|---|---|---|---|---|---|---|---|---|---|---|---|---|---|---|---|---|---|---|---|---|---|---|---|---|---|---|---|---|---|---|---|---|---|---|---|---|---|---|---|---|---|---|---|---|---|---|---|---|---|---|---|---|---|---|---|---|---|---|---|---|---|---|---|---|---|---|---|---|---|---|---|---|---|---|---|---|---|---|---|---|---|---|---|---|---|---|---|---|---|---|---|---|---|---|---|---|---|---|---|---|---|---|---|---|---|---|---|---|---|---|---|---|---|---|---|---|---|---|---|---|---|---|---|---|---|---|---|---|---|---|---|---|---|---|---|---|---|---|---|---|---|---|---|---|---|---|---|---|---|---|---|---|---|---|---|---|---|---|---|---|---|---|---|---|---|---|---|---|---|---|---|---|---|---|---|---|---|---|---|---|---|---|---|---|---|---|---|---|---|---|---|---|---|---|---|---|---|---|---|---|---|---|---|---|---|---|---|---|---|---|---|---|---|---|---|---|---|---|---|---|---|---|---|---|---|---|---|---|---|---|---|---|---|---|---|---|---|---|---|---|---|---|---|---|---|---|---|---|---|---|---|---|---|---|---|---|---|---|---|
|
Donald Trump vs. Michael Bloomberg
Donald Trump vs. Cory Booker
Donald Trump vs. Pete Buttigieg
Donald Trump vs. Kirsten Gillibrand
Donald Trump vs. Kamala Harris
Donald Trump vs. Amy Klobuchar
Donald Trump vs. Beto O'Rourke
Donald Trump vs. Bernie Sanders
Donald Trump vs. Elizabeth Warren
|
Hypothetical polling | ||||||||||||||||||||||||||||||||||||||||||||||||||||||||||||||||||||||||||||||||||||||||||||||||||||||||
|---|---|---|---|---|---|---|---|---|---|---|---|---|---|---|---|---|---|---|---|---|---|---|---|---|---|---|---|---|---|---|---|---|---|---|---|---|---|---|---|---|---|---|---|---|---|---|---|---|---|---|---|---|---|---|---|---|---|---|---|---|---|---|---|---|---|---|---|---|---|---|---|---|---|---|---|---|---|---|---|---|---|---|---|---|---|---|---|---|---|---|---|---|---|---|---|---|---|---|---|---|---|---|---|---|
|
with Donald Trump and Michelle Obama
with Donald Trump and Oprah Winfrey
with Donald Trump and a person whose name was randomly chosen out of a phone book
with Donald Trump and Roy Cooper
with Donald Trump and Generic Democrat
|
See also
Notes
- General footnotes
- Calculated by taking the difference of 100% and all other candidates combined
- FiveThirtyEight aggregates polls with a trendline regression of polls rather than a strict average of recent polls.
- Key:
A – all adults
RV – registered voters
LV – likely voters
V – unclear - Klobuchar with 3%; "Another Candidate" with 3%
- Klobuchar with 4%; Steyer with 1%; Gabbard with 0%; "Other" with 5%
- Klobuchar with 2%; Gabbard with 1%
- Klobuchar with 6%
- Klobuchar with 5%; Steyer with 3%; Gabbard with 1%
- Klobuchar and Steyer with 4%; Booker and Patrick with 2%; Gabbard with 1%; Bennet, Castro, Delaney, Williamson, and Yang with 0%
- Steyer with 4%; Klobuchar with 3%; Booker with 2%; Gabbard and Patrick with 1%; Bennet, Castro, Delaney, Williamson, and Yang with 0%
- Klobuchar with 5%; "Another Candidate" with 5%
- Klobuchar with 5%; Steyer with 2%; Gabbard with 1%; "Other" with <1%
- Klobuchar with 5%; Steyer with 2%; Gabbard with 1%; "Other" with 1%
- Klobuchar with 6%; Gabbard and Steyer with 1%
- Klobuchar with 4%; Steyer with 3%; Gabbard with 1%
- Support listed for "someone else/undecided"
- Klobuchar with 4.0%; Gabbard with 0.9%; Yang with 0.7%; Steyer, Bennet, Patrick, and Williamson with 0.5%; Castro and Delaney with 0.0%
- "No preference" with 3.7%; "Don't know" with 11.2%; "No answer/Refused" with 1.6%
- Klobuchar with 6%; "Another Candidate" with 7%
- Klobuchar with 7%; Gabbard and Steyer with 3%
- Klobuchar with 5%; others with 2%
- Steyer with 4%; Klobuchar with 3%; Gabbard with 2%; Castro, Delaney and Patrick with 0%
- Steyer and Klobuchar with 3%; Gabbard and Patrick with 1%; Castro and Delaney with 0%
- Klobuchar with 5% and Steyer with 2%
- Support listed for "someone else/undecided"
- Klobuchar and Steyer with 3%
- Support listed for "someone else/undecided"
- Gabbard and Steyer with 2%; Bennet, Bullock and Klobuchar with 1%; Castro, Delaney, Messam, Sestak and Williamson with 0%; others with 1%; none with 3%
- Democrats only
- Klobuchar with 3%; Steyer with 2%; Gabbard with 1%; refused with 6%
- All adults
- Gabbard with 4%; Klobuchar with 2%; Steyer with 1%; refused with 21%
- O'Rourke with 2%; Gabbard with 1%; others with 0%
- Castro, Klobuchar, and O'Rourke with 1%
- Castro, and Gabbard with 1%; O'Rourke with 0%
- O'Rourke with 3%; de Blasio, Gillibrand, Klobuchar, and Ryan with 1%; Bennet, Bullock, Castro, Delaney, Gabbard, Gravel, Hickenlooper, Inslee, Messam, Moulton, Swalwell, and Williamson with 0%; others with 2%
- Calculated by taking the difference of 100% and all other candidates combined.
- Additional data sourced from FiveThirtyEight
- "Some other candidate" with 7%
- "Other" with 3%; would not vote with 2%
- "Another candidate" with 3%; would not vote with 1%
- Additional data sourced from FiveThirtyEight
- "Third party/write-in" with 3%
- "Other candidate" with 7%
- "Someone else" with 4%
- "Someone else" with 5%
- The poll does not have a separate listing for this entry, which is instead added into the 'Other' grouping.
- Refused/no answer with 0.2%
- Refused/no answer with 0.1%
- Refused/no answer with 0.1%
- Refused/no answer with 0.1%
- Refused/no answer with 0.1%
- "Someone else" with 6%
- "Other/it depends" with 6%; "Don't know" with 3%
- Partisan clients
- Poll sponsored by Protect Our Care, a pro-Affordable Care Act organisation
- Poll sponsored by the North Carolina Republican Party
- Poll sponsored by the Civitas Institute, a conservative think tank
- Poll sponsored by End Citizens United, a group that has exclusively endorsed Democrats
- Poll sponsored by End Citizens United, a group that has exclusively endorsed Democrats
References
- Kelly, Ben (August 13, 2018). "US elections key dates: When are the 2018 midterms and the 2020 presidential campaign?". The Independent. Retrieved January 3, 2019.
- "Distribution of Electoral Votes". National Archives and Records Administration. Retrieved January 3, 2019.
- Dovere, Edward-Isaac (July 18, 2017). "Can Roy Cooper Show Democrats How to Win Again?". Politico. Retrieved August 28, 2017.
- Moody, Aaron; Specht, Paul A. (March 29, 2018). "Roy Cooper for president? 'I'm sure I'll get some calls.'". The News & Observer. Retrieved July 5, 2018.
- "NC SBE Contest Results". er.ncsbe.gov. North Carolina State Board of Elections. Retrieved March 11, 2020.
- "North Carolina Election Results 2020". PBS NewsHour. Retrieved March 11, 2020.
- News and Observer
- WRAL.com
- "NC SBE Contest Results". er.ncsbe.gov. Retrieved 2020-03-04.
- "North Carolina Election Results 2020". PBS NewsHour. Retrieved March 26, 2020.
- "LOCAL ELECTIONS". ABC 11. March 3, 2020. Retrieved March 4, 2020.
- "N.C. Board of Elections Approves 2020 Presidential Primary Ballots". Spectrum News. December 20, 2019. Retrieved December 22, 2019.
- "PRESIDENTIAL PREFERENCE - GRE (VOTE FOR 1)". er.ncsbe.gov. Retrieved March 4, 2020.
- "PRESIDENTIAL PREFERENCE - CST (VOTE FOR 1)". er.ncsbe.gov. Retrieved March 4, 2020.
- "2020 POTUS Race ratings" (PDF). The Cook Political Report. Retrieved 2019-05-21.
- "POTUS Ratings | Inside Elections". insideelections.com. Retrieved 2019-05-21.
- "Larry J. Sabato's Crystal Ball » 2020 President". crystalball.centerforpolitics.org. Retrieved 2019-05-21.
- "2020 Election Forecast". Politico. November 19, 2019.
- "Battle for White House". RCP. April 19, 2019.
- 2020 Bitecofer Model Electoral College Predictions, Niskanen Center, March 24, 2020, retrieved: April 19, 2020
- David Chalian; Terence Burlij. "Road to 270: CNN's debut Electoral College map for 2020". CNN. Retrieved 2020-06-16.
- "Forecasting the US elections". The Economist. Retrieved 7 July 2020.
- "2020 Election Battleground Tracker". CBS News. July 12, 2020. Retrieved July 13, 2020.
- "2020 Presidential Election Interactive Map". 270 to Win.
- "ABC News Race Ratings". CBS News. July 24, 2020. Retrieved July 24, 2020.
- "2020 Electoral Map Ratings: Trump Slides, Biden Advantage Expands Over 270 Votes". NPR.org. Retrieved 2020-08-03.
- "Biden dominates the electoral map, but here's how the race could tighten". NBC News. Retrieved 2020-08-06.
- "2020 Election Forecast". FiveThirtyEight. Retrieved 14 August 2020.