2020 United States presidential election in Arizona
The 2020 United States presidential election in Arizona is scheduled to take place on Tuesday, November 3, 2020, as part of the 2020 United States elections in which all 50 states plus the District of Columbia will participate.[1] Arizona voters will choose electors to represent them in the Electoral College via a popular vote. The state of Arizona has 11 electoral votes in the Electoral College.[2]
| |||||||||||||||||
| |||||||||||||||||
| |||||||||||||||||
.jpg)
| Elections in Arizona | ||||||||||
|---|---|---|---|---|---|---|---|---|---|---|
 | ||||||||||
|
||||||||||
|
||||||||||
|
||||||||||
|
|
||||||||||
Primary elections
Canceled Republican primary
On September 9, 2019, the Arizona Republican Party became one of several state GOP parties to officially cancel their respective primaries and caucuses.[3] Donald Trump's re-election campaign and GOP officials have cited the fact that Republicans canceled several state primaries when George H. W. Bush and George W. Bush sought a second term in 1992 and 2004, respectively; and Democrats scrapped some of their primaries when Bill Clinton and Barack Obama were seeking reelection in 1996 and 2012, respectively.[4][5] At the Arizona State Republican Convention in May 2020, the state party will formally bind all 57 of its national pledged delegates to Trump.[6]
Democratic primary
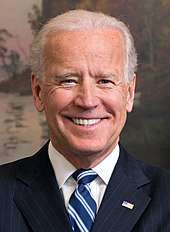
The Arizona Democratic primary took place on March 17, 2020. Former Vice President Joe Biden defeated Vermont Senator Bernie Sanders and Hawaii Representative Tulsi Gabbard.
| Candidate | Votes | % | Delegates[8] |
|---|---|---|---|
| Joe Biden | 268,029 | 43.70 | 38 |
| Bernie Sanders | 200,456 | 32.68 | 29 |
| Elizabeth Warren (withdrawn†) | 35,537 | 5.79 | 0 |
| Pete Buttigieg (withdrawn†) | 24,868 | 4.05 | 0 |
| Tulsi Gabbard | 3,014 | 0.49 | 0 |
| Andrew Yang (withdrawn) | 1,921 | 0.31 | 0 |
| Julian Castro (withdrawn) | 754 | 0.12 | 0 |
| Marianne Williamson (withdrawn) | 668 | 0.11 | 0 |
| Roque De La Fuente III | 628 | 0.10 | 0 |
| Deval Patrick (withdrawn) | 242 | 0.04 | 0 |
| Henry Hewes | 208 | 0.03 | 0 |
| Michael A. Ellinger | 184 | 0.03 | 0 |
| Total | 536,509[lower-alpha 1] | 86.72%[lower-alpha 2] | 67 |
†Candidate withdrew after early voting started.
General election
Predictions
| Source | Ranking | As of |
|---|---|---|
| The Cook Political Report[10] | Tossup | July 23, 2020 |
| Inside Elections[11] | Tilt D (flip) | July 17, 2020 |
| Sabato's Crystal Ball[12] | Tossup | July 14, 2020 |
| Politico[13] | Tossup | July 6, 2020 |
| RCP[14] | Tossup | August 3, 2020 |
| Niskanen[15] | Lean D (flip) | March 24, 2020 |
| CNN[16] | Tossup | August 3, 2020 |
| The Economist[17] | Lean D (flip) | August 7, 2020 |
| CBS News[18] | Tossup | August 9, 2020 |
| 270towin[19] | Tossup | August 2, 2020 |
| ABC News[20] | Tossup | July 31, 2020 |
| NPR[21] | Tossup | August 3, 2020 |
| NBC News[22] | Lean D (flip) | August 6, 2020 |
| 538[23] | Tilt D (flip) | August 14, 2020 |
Polling
Aggregate polls
| Donald Trump vs. Joe Biden | ||||||
|---|---|---|---|---|---|---|
| Source of poll aggregation | Dates administered | Dates updated | Joe Biden | Donald Trump | Other/Undecided[lower-alpha 3] | Margin |
| 270 to Win | July 14–26, 2020 | July 30, 2020 | 48.2% | 43.0% | 8.8% | Biden +5.2 |
| Real Clear Politics | August 3–10, 2020 | August 13, 2020 | 47.0% | 45.0% | 8.0% | Biden +2.0 |
| FiveThirtyEight | July 11–26, 2020 | August 4, 2020 | 48.5% | 45.1% | 6.4% | Biden +3.4 |
| Average | July 11–26, 2020 | August 4, 2020 | 47.9% | 44.4% | 7.7% | Biden +3.5 |
Donald Trump vs. Joe Biden
| Poll source | Date(s) administered |
Sample size[lower-alpha 4] |
Margin of error |
Donald Trump (R) |
Joe Biden (D) |
Other | Undecided |
|---|---|---|---|---|---|---|---|
| Emerson College | Aug 8–10, 2020 | 661 (LV) | ± 3.8% | 45% | 49% | – | 5% |
| Change Research/CNBC | Aug 7–9, 2020 | 428 (LV) | – | 44% | 45% | – | – |
| Trafalgar Group | Aug 5–8, 2020 | 1,013 (LV) | ± 2.9% | 46% | 45% | 5% | 4% |
| OH Predictive Insights | Aug 3–4, 2020 | 603 (V) | ± 4.0% | 45% | 49% | – | – |
| On Message/Heritage Action | Aug 2–4, 2020 | 400 (LV) | ± 4.9% | 51% | 48% | – | 2% |
| Data for Progress | Jul 24 – Aug 2, 2020 | 1,215 (LV) | – | 44% | 47% | – | 8% |
| 43% | 45% | 3%[lower-alpha 5] | 10% | ||||
| Change Research/CNBC | Jul 24–26, 2020 | 365 (LV) | – | 45% | 47% | – | – |
| Morning Consult | Jul 17–26, 2020 | 908 (LV) | ± 3.3% | 42% | 49% | – | – |
| CNN/SSRS | Jul 18–24, 2020 | 873 (RV) | ± 3.8% | 45% | 49% | 4%[lower-alpha 6] | 2% |
| Redfield & Wilton Strategies | Jul 19–23, 2020 | 858 (RV) | – | 38% | 46% | 6%[lower-alpha 7] | 11% |
| NBC News/Marist College | Jul 14–22, 2020 | 826 (RV) | ± 4.1% | 45% | 50% | 1% | 3% |
| Public Policy Polling | Jul 17–18, 2020 | 960 (RV) | – | 45% | 49% | – | 6% |
| Spry Strategies | Jul 11–16, 2020 | 700 (LV) | ± 3.7% | 45% | 49% | – | 6% |
| Change Research/CNBC | Jul 10–12, 2020 | 345 (LV) | – | 45% | 51% | – | – |
| CBS News/YouGov | Jul 7–10, 2020 | 1,087 (LV) | ± 3.8% | 46% | 46% | 4%[lower-alpha 8] | 4% |
| OH Predictive Insights | Jul 6–7, 2020 | 600 (LV) | ± 4.0% | 44% | 49% | 0%[lower-alpha 9] | 7% |
| Data Orbital | Jun 27–29, 2020 | 600 (LV) | ± 4% | 45% | 47% | 3.3%[lower-alpha 10] | 4.2% |
| Change Research/CNBC | Jun 26–28, 2020 | 311 (LV) (LV)[lower-alpha 11] | – | 44% | 51% | – | – |
| Gravis Marketing/OANN | Jun 27, 2020 | 527 (LV) | ± 4.3% | 49% | 45% | – | 7% |
| NYT Upshot/Siena College | Jun 8–16, 2020 | 650 (RV) | ± 4.3% | 41% | 48% | 4%[lower-alpha 12] | 8% |
| Civiqs/Daily Kos | Jun 13–15, 2020 | 1,368 (RV) | ± 2.9% | 45% | 49% | 5%[lower-alpha 13] | 1% |
| Change Research/CNBC | Jun 12–14, 2020 | 201 (LV)[lower-alpha 14] | – | 44% | 45% | 5%[lower-alpha 15] | – |
| Fox News | May 30 – Jun 2, 2020 | 1,002 (RV) | ± 3% | 42% | 46% | 6%[lower-alpha 16] | 5% |
| Change Research/CNBC | May 29–31, 2020 | 329 (LV)[lower-alpha 17] | – | 45% | 44% | 9% | 2% |
| HighGround Inc. | May 18–22, 2020 | 400 (LV) | ± 4.9% | 45% | 47% | 4%[lower-alpha 18] | 4%[lower-alpha 19] |
| Redfield & Wilton Strategies | May 10–14, 2020 | 946 (LV) | ± 3.2% | 41% | 45% | 3%[lower-alpha 20] | 10% |
| OH Predictive Insights | May 9–11, 2020 | 600 (LV) | ± 4% | 43% | 50% | 1%[lower-alpha 21] | 6% |
| GBAO Strategies/PLUS Paid Family Leave | Apr 13–16, 2020 | 500 (LV) | – | 46% | 47% | 2% | 5% |
| OH Predictive Insights | Apr 7–8, 2020 | 600 (LV) | ± 4.0% | 43% | 52% | – | – |
| NBC News/Wall Street Journal/Marist College | Mar 10–15, 2020 | 2,523 (RV) | ± 2.7% | 46% | 47% | 1% | 5% |
| Monmouth University | Mar 11–14, 2020 | 847 (RV) | ± 3.4% | 43% | 46% | 2% | 6% |
| Univision | Mar 6–11, 2020 | 1,036 (RV) | ± 3.0% | 42% | 50% | – | 8% |
| OH Predictive Insights | Mar 3–4, 2020 | 600 (LV) | ± 4.0% | 43% | 49% | – | 8% |
| Public Policy Polling | Mar 2–3, 2020 | 666 (V) | – | 46% | 47% | – | 6% |
| Climate Nexus | Feb 11–15, 2020 | 539 (RV) | ± 4.3% | 46% | 42% | – | 13% |
| Fabrizio, Lee & Associates/Team McSally/Politico[upper-alpha 1] | Jan 22–24, 2020 | 1,000 (LV) | ± 3.1% | 50% | 45% | – | 6% |
| Public Policy Polling | Jan 2–4, 2020 | 760 (V) | – | 46% | 46% | – | 8% |
| OH Predictive Insights | Dec 3–4, 2019 | 628 (LV) | ± 3.91% | 46% | 44% | 0%[lower-alpha 22] | 10% |
| Emerson College | Oct 25–28, 2019 | 901 | ± 3.2% | 50% | 50% | – | – |
| NYT Upshot/Siena College | Oct 13–23, 2019 | 652 (LV) | ± 4.4% | 46% | 49% | – | – |
| Bendixen & Amandi International | Sep 9–12, 2019 | 520 | ± 4.3% | 43% | 42% | 12% | 3% |
| OH Predictive Insights | Aug 13–14, 2019 | 600 | ± 4.0% | 43% | 45% | – | 12% |
| Fabrizio Ward LLC | July 29–31, 2019 | 600 (LV) | ± 4.0% | 50% | 45% | – | 4% |
| OH Predictive Insights | May 1–2, 2019 | 600 | ± 4.0% | 44% | 49% | – | 7% |
| OH Predictive Insights | Feb 12–13, 2019 | 600 | ± 4.0% | 46% | 46% | – | 7% |
Four-way race
| Poll source | Date(s) administered |
Sample size[lower-alpha 4] |
Margin of error |
Donald Trump (R) |
Joe Biden (D) |
Jo Jorgensen (L) |
Howie Hawkins (G) |
Other | Undecided |
|---|---|---|---|---|---|---|---|---|---|
| Redfield & Wilton Strategies | Jun 14–17, 2020 | 865 (LV) | ± 3.33% | 39% | 43% | 2% | 1% | 2% | 13% |
Former candidates | ||||||||||||||||||||||||||||||||||||||||||||||||||||||||||||||||||||||||||||||||||||||||||||||||||||||||||||||||||||||||||||||||||||||||||||||||||||||||||||||||||||||||||||||||||||||||||||||||||||||||||||||||||||||||||||||||||||||||||||||||||||||||||||||||||||||||||||||||||||||||||||||||||||||||||||||||||||||||||||||||||||||||||||||||||||
|---|---|---|---|---|---|---|---|---|---|---|---|---|---|---|---|---|---|---|---|---|---|---|---|---|---|---|---|---|---|---|---|---|---|---|---|---|---|---|---|---|---|---|---|---|---|---|---|---|---|---|---|---|---|---|---|---|---|---|---|---|---|---|---|---|---|---|---|---|---|---|---|---|---|---|---|---|---|---|---|---|---|---|---|---|---|---|---|---|---|---|---|---|---|---|---|---|---|---|---|---|---|---|---|---|---|---|---|---|---|---|---|---|---|---|---|---|---|---|---|---|---|---|---|---|---|---|---|---|---|---|---|---|---|---|---|---|---|---|---|---|---|---|---|---|---|---|---|---|---|---|---|---|---|---|---|---|---|---|---|---|---|---|---|---|---|---|---|---|---|---|---|---|---|---|---|---|---|---|---|---|---|---|---|---|---|---|---|---|---|---|---|---|---|---|---|---|---|---|---|---|---|---|---|---|---|---|---|---|---|---|---|---|---|---|---|---|---|---|---|---|---|---|---|---|---|---|---|---|---|---|---|---|---|---|---|---|---|---|---|---|---|---|---|---|---|---|---|---|---|---|---|---|---|---|---|---|---|---|---|---|---|---|---|---|---|---|---|---|---|---|---|---|---|---|---|---|---|---|---|---|---|---|---|---|---|---|---|---|---|---|---|---|---|---|---|---|---|---|---|---|---|---|---|---|---|---|---|---|---|---|---|---|---|---|---|---|---|---|---|---|---|---|---|---|---|---|---|---|---|---|---|---|---|---|---|---|---|---|---|---|
|
Donald Trump vs. Michael Bloomberg
Donald Trump vs. Pete Buttigieg
Donald Trump vs. Kamala Harris
Donald Trump vs. Amy Klobuchar
Donald Trump vs. Beto O'Rourke
Donald Trump vs. Bernie Sanders
Donald Trump vs. Elizabeth Warren
|
Hypothetical polling | |||||||||||||||||||||
|---|---|---|---|---|---|---|---|---|---|---|---|---|---|---|---|---|---|---|---|---|---|
|
Donald Trump vs. Generic Democrat
|
See also
Notes
- Partisan clients
- Poll sponsored by the McSally campaign
- Poll sponsored by 314 Action
- Voter samples and additional candidates
- Total of candidates officially reported, of 613,355 ballots cast.
- Percentages reported by the Arizona Secretary of State do not add up to 100. This may be due to the fact that candidates who formally withdrew (Bennet, Bloomberg, Booker, Delaney, Klobuchar, and Steyer[9]) do not have their vote totals officially reported.[7]
- Calculated by taking the difference of 100% and all other candidates combined.
- Key:
A – all adults
RV – registered voters
LV – likely voters
V – unclear - "Jo Jorgensen" 2%; "Howie Hawkins" 1%
- "Other" with 1%; "Neither" 3%
- "Jo Jorgensen" with 2%; "Howie Hawkins" 1%; "Kayne West" 2%; "Another Third Party/Write-In" 1%
- "Someone else/third party" with 4%; would not vote with 0%
- "Refused" with 0%
- "Other" with 3.1%; "refused" with 0.2%
- Additional data sourced from FiveThirtyEight
- "Another candidate" and would not vote with 2%
- "Someone else" with 5%
- Additional data sourced from FiveThirtyEight
- "Libertarian Party candidate/Green Party candidate" with 5%
- "Other" with 5%; would not vote with 1%
- Additional data sourced from FiveThirtyEight
- "Some other candidate" with 4.3%
- Includes "refused"
- "Third party/write-in" with 3%
- "Refused" with 1%
- Refused with 0%
- Refused with 0%
- Refused with 0%
- Refused with 1%
- Refused with 1%
References
- Kelly, Ben (August 13, 2018). "US elections key dates: When are the 2018 midterms and the 2020 presidential campaign?". The Independent. Retrieved January 3, 2019.
- "Distribution of Electoral Votes". National Archives and Records Administration. Retrieved January 3, 2019.
- Stone, Kevin (September 9, 2019). "Arizona GOP won't hold 2020 presidential preference election". KTAR. Retrieved September 11, 2019.
- Karni, Annie (September 6, 2019). "GOP plans to drop presidential primaries in 4 states to impede Trump challengers". Boston Globe. MSN. Retrieved September 7, 2019.
- Steakin, Will; Karson, Kendall (September 6, 2019). "GOP considers canceling at least 3 GOP primaries and caucuses, Trump challengers outraged". ABC News. Retrieved September 7, 2019.
- "Arizona Republican Delegation 2020". The Green Papers. Retrieved February 20, 2020.
- "Arizona Election Results". results.arizona.vote. Arizona Secretary of State. Retrieved March 20, 2020.
- "2020 Presidential Primaries, Caucuses, and Conventions: Arizona Democrat". The Green Papers. Retrieved 4 July 2020.
- "Running for Federal Office, Arizona Secretary of State". azsos.gov. Arizona Secretary of State. Retrieved March 20, 2020.
- "2020 POTUS Race ratings" (PDF). The Cook Political Report. Retrieved 2019-05-21.
- "POTUS Ratings | Inside Elections". insideelections.com. Retrieved 2019-05-21.
- "Larry J. Sabato's Crystal Ball » 2020 President". crystalball.centerforpolitics.org. Retrieved 2019-05-21.
- "2020 Election Forecast". Politico. November 19, 2019.
- "Battle for White House". RCP. April 19, 2019.
- 2020 Bitecofer Model Electoral College Predictions, Niskanen Center, March 24, 2020, retrieved: April 19, 2020
- David Chalian; Terence Burlij. "Road to 270: CNN's debut Electoral College map for 2020". CNN. Retrieved 2020-06-16.
- "Forecasting the US elections". The Economist. Retrieved 7 July 2020.
- "2020 Election Battleground Tracker". CBS News. July 12, 2020. Retrieved July 13, 2020.
- "2020 Presidential Election Interactive Map". 270 to Win.
- "ABC News Race Ratings". CBS News. July 24, 2020. Retrieved July 24, 2020.
- "2020 Electoral Map Ratings: Trump Slides, Biden Advantage Expands Over 270 Votes". NPR.org. Retrieved 2020-08-03.
- "Biden dominates the electoral map, but here's how the race could tighten". NBC News. Retrieved 2020-08-06.
- "2020 Election Forecast". FiveThirtyEight. Retrieved 14 August 2020.