2012 United States presidential election in North Carolina
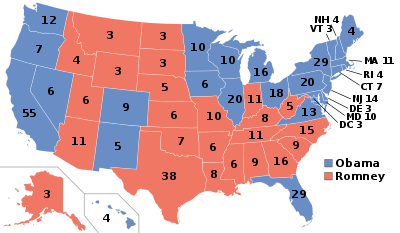
The 2012 United States presidential election in North Carolina took place on November 6, 2012, as part of the 2012 General Election in which all 50 states plus the District of Columbia participated. North Carolina voters chose 15 electors to represent them in the Electoral College via a popular vote pitting incumbent Democratic President Barack Obama and his running mate, Vice President Joe Biden, against Republican challenger and former Massachusetts Governor Mitt Romney and his running mate, Congressman Paul Ryan.
| ||||||||||||||||||||||||||
| ||||||||||||||||||||||||||
 County Results
| ||||||||||||||||||||||||||
| ||||||||||||||||||||||||||
Mitt Romney narrowly carried the state of North Carolina, winning 50.39% of the vote to Barack Obama's 48.35%, a margin of 2.04%. North Carolina was one of just two states (along with Indiana) which flipped from voting for Obama in 2008 to voting Republican in 2012. Like Indiana, North Carolina had been a reliably Republican state prior to Obama's 2008 win, having not previously gone Democratic since 1976. Unlike Indiana, however, North Carolina was still considered a competitive swing state in 2012, and both campaigns targeted it heavily, with the Democrats holding their convention in Charlotte. Romney was the first presidential candidate since Zachary Taylor in 1848 to carry North Carolina while losing both Wake County and Mecklenburg County, which are the two most populous counties. Interestingly, while Obama lost North Carolina to Romney, he [Obama] received more votes than he had received in 2008, garnering 35,740 more votes in 2012. This would also be only the third presidential election since 1956 when North Carolina backed the losing candidate in a presidential election. The same of which previously happened when it did the same for fellow losing Republican candidates George H.W. Bush in 1992, along with Bob Dole four years later in 1996 as well.
Primary elections
| |||||||||||||||||||
| |||||||||||||||||||
 North Carolina results by county
Barack Obama | |||||||||||||||||||
Democratic primary
The 2012 North Carolina Democratic primary was held May 8, 2012. North Carolina awarded 157 delegates proportionally.[1]
No candidate ran against incumbent President Barack Obama in North Carolina's Democratic presidential preference primary. Obama received 766,079 votes, or 79.23% of the vote, with the remainder (200,810 votes, or 20.77%) going to elect delegates with "No Preference".[1]
At the North Carolina Democratic state convention, 152 delegates were awarded to Obama, with 5 delegates remaining unannounced.[1]
| Democratic Primary Election in NC[2] | |||||
|---|---|---|---|---|---|
| Candidate | Votes | Percentage | Awarded delegates | ||
| Barack Obama | 766,077 | 79.23% | 104 | ||
| No Preference | 200,810 | 20.77% | 0 | ||
| Totals | 966,889 | 100.00% | 104 | ||
Republican primary
| |||||||||||||||||||||||||||||||||||||||||||||||
| |||||||||||||||||||||||||||||||||||||||||||||||
 North Carolina results by county
Mitt Romney
(Note: Italicization indicates a withdrawn candidacy) | |||||||||||||||||||||||||||||||||||||||||||||||
.jpg)
The 2012 North Carolina Republican primary was held May 8, 2012.[3][4] North Carolina awarded 55 delegates proportionally.[5] Ron Paul and Mitt Romney were the only active contenders on the ballot. By the time of the primary, Romney had already been declared the party's presumptive nominee.[6]
Romney won the North Carolina GOP presidential primary with 65.62% of the vote. Paul (with 11.12% of the vote) narrowly edged out Santorum (with 10.39% of the vote), and Gingrich came in last with 7.64% of the vote. 5.23% of voters registered "no preference". The awarded delegate count from North Carolina's Republican state convention was Romney with 48 delegates and Paul with 7 delegates.[5]
| Republican Primary Election in NC[5] | |||||
|---|---|---|---|---|---|
| Candidate | Votes | Percentage | Awarded delegates | ||
| Mitt Romney | 638,601 | 65.62% | 48 | ||
| Ron Paul | 108,217 | 11.12% | 7 | ||
| Rick Santorum (withdrawn) | 101,093 | 10.39% | |||
| Newt Gingrich (withdrawn) | 74,367 | 7.64% | |||
| No Preference | 50,928 | 5.23% | |||
| Totals | 973,206 | 100.00% | 55 | ||
General election
Overview
| United States presidential election in North Carolina, 2012[7] | ||||||
|---|---|---|---|---|---|---|
| Party | Candidate | Running mate | Votes | Percentage | Electoral votes | |
| Republican | Mitt Romney | Paul Ryan | 2,270,395 | 50.39% | 15 | |
| Democratic | Barack Obama | Joe Biden | 2,178,391 | 48.35% | 0 | |
| Libertarian | Gary Johnson | Jim Gray | 44,515 | 0.99% | 0 | |
| Others (write-in) | 12,071 | 0.27% | 0 | |||
| Totals | 4,505,372 | 100.00% | 15 | |||
| Voter turnout (registered voters) | 67.74% | |||||

By county
| County | Obama% | Obama# | Romney% | Romney# | Others% | Others# | Total |
|---|---|---|---|---|---|---|---|
| Alamance | 42.60% | 28,875 | 56.32% | 38,170 | 01.08% | 731 | 67,776 |
| Alexander | 26.81% | 4,611 | 71.25% | 12,253 | 01.93% | 332 | 17,196 |
| Alleghany | 31.24% | 1,583 | 66.90% | 3,390 | 01.86% | 94 | 5,067 |
| Anson | 62.36% | 7,019 | 37.01% | 4,166 | 00.63% | 71 | 11,256 |
| Ashe | 32.64% | 4,116 | 65.36% | 8,242 | 02.00% | 252 | 12,610 |
| Avery | 24.26% | 1,882 | 74.31% | 5,766 | 01.43% | 111 | 7,759 |
| Beaufort | 39.94% | 9,435 | 59.17% | 13,977 | 00.88% | 208 | 23,620 |
| Bertie | 66.14% | 6,695 | 33.46% | 3,387 | 00.41% | 41 | 10,123 |
| Bladen | 50.52% | 8,062 | 48.56% | 7,748 | 00.92% | 147 | 15,957 |
| Brunswick | 38.42% | 22,038 | 60.57% | 34,743 | 01.01% | 581 | 57,362 |
| Buncombe | 55.31% | 70,625 | 42.84% | 54,701 | 01.86% | 2,370 | 127,696 |
| Burke | 37.49% | 13,701 | 60.93% | 22,267 | 01.58% | 576 | 36,544 |
| Cabarrus | 39.31% | 32,849 | 59.30% | 49,557 | 01.39% | 1,160 | 83,566 |
| Caldwell | 31.38% | 10,898 | 66.88% | 23,229 | 01.74% | 605 | 34,732 |
| Camden | 32.06% | 1,508 | 66.09% | 3,109 | 01.85% | 87 | 4,704 |
| Carteret | 29.00% | 10,301 | 69.76% | 24,775 | 01.24% | 441 | 35,517 |
| Caswell | 48.45% | 5,348 | 50.67% | 5,594 | 00.88% | 97 | 11,039 |
| Catawba | 34.58% | 24,069 | 63.99% | 44,538 | 01.43% | 994 | 69,601 |
| Chatham | 51.82% | 18,361 | 47.03% | 16,665 | 01.15% | 408 | 35,434 |
| Cherokee | 26.25% | 3,378 | 72.11% | 9,278 | 01.64% | 211 | 12,867 |
| Chowan | 47.38% | 3,556 | 51.85% | 3,891 | 00.77% | 58 | 7,505 |
| Clay | 27.99% | 1,579 | 70.42% | 3,973 | 01.60% | 90 | 5,642 |
| Cleveland | 39.37% | 17,062 | 59.51% | 25,793 | 01.12% | 485 | 43,340 |
| Columbus | 45.58% | 11,050 | 53.38% | 12,941 | 01.04% | 252 | 24,243 |
| Craven | 40.64% | 18,763 | 58.32% | 26,928 | 01.04% | 479 | 46,170 |
| Cumberland | 59.38% | 75,792 | 39.69% | 50,666 | 00.93% | 1,183 | 127,641 |
| Currituck | 31.51% | 3,562 | 66.31% | 7,496 | 02.18% | 246 | 11,304 |
| Dare | 41.13% | 7,393 | 57.02% | 10,248 | 01.85% | 333 | 17,974 |
| Davidson | 29.07% | 20,624 | 69.62% | 49,383 | 01.31% | 928 | 70,935 |
| Davie | 27.75% | 5,735 | 71.05% | 14,687 | 01.20% | 248 | 20,670 |
| Duplin | 43.87% | 9,033 | 55.44% | 11,416 | 00.69% | 143 | 20,592 |
| Durham | 75.80% | 111,224 | 23.01% | 33,769 | 01.19% | 1,742 | 146,735 |
| Edgecombe | 67.89% | 18,310 | 31.68% | 8,546 | 00.43% | 116 | 26,972 |
| Forsyth | 53.04% | 92,323 | 45.83% | 79,768 | 01.14% | 1,978 | 174,069 |
| Franklin | 47.33% | 13,436 | 51.44% | 14,603 | 01.23% | 350 | 28,389 |
| Gaston | 36.66% | 33,171 | 62.04% | 56,138 | 01.30% | 1,174 | 90,483 |
| Gates | 51.63% | 2,786 | 47.52% | 2,564 | 00.85% | 46 | 5,396 |
| Graham | 28.35% | 1,119 | 69.67% | 2,750 | 01.98% | 78 | 3,947 |
| Granville | 51.75% | 13,598 | 47.21% | 12,405 | 01.04% | 272 | 26,275 |
| Greene | 45.87% | 3,778 | 53.56% | 4,411 | 00.57% | 47 | 8,236 |
| Guilford | 57.66% | 146,365 | 41.28% | 104,789 | 01.06% | 2,698 | 253,852 |
| Halifax | 65.86% | 17,176 | 33.60% | 8,763 | 00.54% | 140 | 26,079 |
| Harnett | 39.92% | 17,331 | 58.89% | 25,565 | 01.20% | 519 | 43,415 |
| Haywood | 42.30% | 11,833 | 55.88% | 15,633 | 01.82% | 508 | 27,974 |
| Henderson | 35.58% | 18,642 | 62.98% | 32,994 | 01.44% | 756 | 52,392 |
| Hertford | 71.84% | 7,843 | 27.54% | 3,007 | 00.62% | 68 | 10,918 |
| Hoke | 58.96% | 10,076 | 39.90% | 6,819 | 01.14% | 194 | 17,089 |
| Hyde | 48.80% | 1,163 | 50.06% | 1,193 | 01.13% | 27 | 2,383 |
| Iredell | 34.15% | 26,076 | 64.56% | 49,299 | 01.30% | 990 | 76,365 |
| Jackson | 48.47% | 8,095 | 49.42% | 8,254 | 02.11% | 352 | 16,701 |
| Johnston | 35.58% | 27,290 | 63.15% | 48,427 | 01.27% | 974 | 76,691 |
| Jones | 44.97% | 2,352 | 54.24% | 2,837 | 00.78% | 41 | 5,230 |
| Lee | 44.56% | 10,801 | 54.28% | 13,158 | 01.16% | 280 | 24,239 |
| Lenoir | 49.66% | 13,948 | 49.78% | 13,980 | 00.56% | 158 | 28,086 |
| Lincoln | 29.98% | 11,024 | 68.71% | 25,267 | 01.32% | 484 | 36,775 |
| Macon | 33.88% | 5,712 | 64.26% | 10,835 | 01.86% | 314 | 16,861 |
| Madison | 44.34% | 4,484 | 53.44% | 5,404 | 02.22% | 225 | 10,113 |
| Martin | 52.03% | 6,583 | 47.38% | 5,995 | 00.58% | 74 | 12,652 |
| McDowell | 33.32% | 6,031 | 65.06% | 11,775 | 01.62% | 293 | 18,099 |
| Mecklenburg | 60.65% | 272,262 | 38.24% | 171,668 | 01.11% | 4,970 | 448,900 |
| Mitchell | 23.67% | 1,838 | 74.77% | 5,806 | 01.56% | 121 | 7,765 |
| Montgomery | 41.90% | 4,706 | 57.02% | 6,404 | 01.08% | 121 | 11,231 |
| Moore | 35.56% | 16,505 | 63.55% | 29,495 | 00.89% | 415 | 46,415 |
| Nash | 50.14% | 24,313 | 49.17% | 23,842 | 00.69% | 337 | 48,492 |
| New Hanover | 46.96% | 48,668 | 51.52% | 53,385 | 01.52% | 1,575 | 103,628 |
| Northampton | 67.24% | 7,232 | 32.38% | 3,483 | 00.38% | 41 | 10,756 |
| Onslow | 35.95% | 18,490 | 62.69% | 32,243 | 01.36% | 702 | 51,435 |
| Orange | 70.22% | 53,901 | 28.06% | 21,539 | 01.72% | 1,317 | 76,757 |
| Pamlico | 39.15% | 2,647 | 59.91% | 4,051 | 00.95% | 64 | 6,762 |
| Pasquotank | 56.78% | 10,282 | 42.15% | 7,633 | 01.06% | 192 | 18,107 |
| Pender | 39.27% | 9,632 | 59.60% | 14,617 | 01.13% | 278 | 24,527 |
| Perquimans | 41.48% | 2,759 | 57.46% | 3,822 | 01.07% | 71 | 6,652 |
| Person | 44.06% | 8,418 | 54.94% | 10,496 | 01.00% | 192 | 19,106 |
| Pitt | 53.06% | 41,843 | 45.92% | 36,214 | 01.01% | 799 | 78,856 |
| Polk | 38.63% | 4,013 | 60.03% | 6,236 | 01.35% | 140 | 10,389 |
| Randolph | 24.33% | 14,773 | 74.38% | 45,160 | 01.29% | 782 | 60,715 |
| Richmond | 51.01% | 9,904 | 48.06% | 9,332 | 00.93% | 181 | 19,417 |
| Robeson | 58.18% | 24,988 | 40.77% | 17,510 | 01.04% | 448 | 42,946 |
| Rockingham | 38.91% | 16,351 | 60.04% | 25,227 | 01.05% | 442 | 42,020 |
| Rowan | 36.35% | 22,650 | 62.23% | 38,775 | 01.42% | 887 | 62,312 |
| Rutherford | 32.66% | 9,374 | 66.04% | 18,954 | 01.30% | 374 | 28,702 |
| Sampson | 44.19% | 11,566 | 55.10% | 14,422 | 00.71% | 186 | 26,174 |
| Scotland | 58.03% | 8,215 | 41.19% | 5,831 | 00.78% | 110 | 14,156 |
| Stanly | 29.36% | 8,431 | 69.31% | 19,904 | 01.33% | 382 | 28,717 |
| Stokes | 27.84% | 6,018 | 70.48% | 15,237 | 01.68% | 364 | 21,619 |
| Surry | 30.92% | 9,112 | 67.60% | 19,923 | 01.48% | 435 | 29,470 |
| Swain | 45.71% | 2,618 | 51.96% | 2,976 | 02.34% | 134 | 5,728 |
| Transylvania | 40.72% | 6,826 | 57.47% | 9,634 | 01.81% | 303 | 16,763 |
| Tyrrell | 46.94% | 837 | 52.16% | 930 | 00.90% | 16 | 1,783 |
| Union | 34.28% | 32,473 | 64.51% | 61,107 | 01.21% | 1,148 | 94,728 |
| Vance | 63.89% | 13,323 | 35.62% | 7,429 | 00.49% | 102 | 20,854 |
| Wake | 54.94% | 267,262 | 43.50% | 211,596 | 01.56% | 7,569 | 486,427 |
| Warren | 68.67% | 6,978 | 30.90% | 3,140 | 00.43% | 44 | 10,162 |
| Washington | 58.98% | 3,833 | 40.34% | 2,622 | 00.68% | 44 | 6,499 |
| Watauga | 46.98% | 13,002 | 50.09% | 13,861 | 02.93% | 811 | 27,674 |
| Wayne | 45.40% | 23,314 | 53.83% | 27,641 | 00.77% | 397 | 51,352 |
| Wilkes | 27.96% | 8,148 | 70.39% | 20,515 | 01.65% | 482 | 29,145 |
| Wilson | 53.38% | 20,875 | 45.91% | 17,954 | 00.72% | 280 | 39,109 |
| Yadkin | 23.54% | 3,957 | 74.81% | 12,578 | 01.65% | 278 | 16,813 |
| Yancey | 42.12% | 3,981 | 55.85% | 5,278 | 02.03% | 192 | 9,451 |
By congressional district
Romney won 10 of the states 13 congressional districts.
| District | Romney | Obama | Representative |
|---|---|---|---|
| 1st | 27.88% | 71.60% | G.K. Butterfield |
| 2nd | 57.26% | 41.71% | Renee Ellmers |
| 3rd | 57.99% | 41.01% | Walter B. Jones |
| 4th | 27.41% | 71.43 | David Price |
| 5th | 59.06% | 39.77% | Virginia Foxx |
| 6th | 57.65% | 41.34% | Howard Coble |
| 7th | 59.24% | 39.86% | Mike McIntyre |
| 8th | 58.06% | 41.00% | Larry Kissell |
| Richard Hudson | |||
| 9th | 56.19% | 42.81% | Sue Myrick |
| Robert Pittenger | |||
| 10th | 58.00% | 40.89% | Patrick T. McHenry |
| 11th | 60.90% | 37.79% | Heath Shuler |
| Mark Meadows | |||
| 12th | 20.79% | 78.54% | Mel Watt |
| 13th | 55.45% | 43.53% | Brad Miller |
| George Holding |
| Elections in North Carolina | ||||||||||||||
|---|---|---|---|---|---|---|---|---|---|---|---|---|---|---|
 | ||||||||||||||
|
||||||||||||||
|
State executive
|
||||||||||||||
|
State legislature |
||||||||||||||
|
Mayoral elections
|
||||||||||||||
2012 U.S. presidential election | |
|---|---|
| Democratic Party | |
| Republican Party | |
|
|
| Related races | |
| |
See also
References
- "North Carolina Democrat". The Green Papers. Retrieved November 14, 2012.
- "NC - Election Results". results.enr.clarityelections.com. Retrieved September 18, 2016.
- "Primary and Caucus Printable Calendar". CNN. Retrieved January 12, 2012.
- "Presidential Primary Dates" (PDF). Federal Election Commission. Retrieved January 23, 2012.
- "North Carolina Republican". The Green Papers. Retrieved November 14, 2012.
- Memoli, Michael A. (25 April 2012). "RNC officially names Mitt Romney the party's 'presumptive nominee'". LA Times. Retrieved November 3, 2016.
- "North Carolina State Board of Elections". Archived from the original on 2012-11-25. Retrieved November 14, 2012.
External links
- North Carolina State Board of Elections
- North Carolina Democratic Party
- North Carolina Republican Party
- The Green Papers: for North Carolina
- The Green Papers: Major state elections in chronological order
State and district results of the 2012 United States presidential election | ||
|---|---|---|
|  | |
| ||