2020 United States presidential election in Texas
The 2020 United States presidential election in Texas is scheduled to take place on Tuesday, November 3, 2020, as part of the 2020 United States elections in which all 50 states plus the District of Columbia will participate.[1] Texas voters will choose electors to represent them in the Electoral College via a popular vote. The state of Texas has 38 electoral votes in the Electoral College.[2]
| |||||||||||||||||
| Turnout | % | ||||||||||||||||
|---|---|---|---|---|---|---|---|---|---|---|---|---|---|---|---|---|---|
| |||||||||||||||||
| |||||||||||||||||
.jpg)
| Elections in Texas | ||||||||||||
|---|---|---|---|---|---|---|---|---|---|---|---|---|
 | ||||||||||||
|
||||||||||||
|
||||||||||||
|
|
||||||||||||
|
||||||||||||
|
| ||||||||||||
Primary elections
Republican primary
The Republican primary was held on March 3, 2020. Donald Trump and Bill Weld were declared Republican candidates. Former South Carolina Governor and U.S. Representative Mark Sanford and U.S. Representative Joe Walsh dropped out. Texas Governor Greg Abbott declined to run against Trump, as did 2016 Republican primary candidate and current senator Ted Cruz.[3][4]
Results
| Texas Republican Party presidential primary, 2020[5] | |||
|---|---|---|---|
| Candidate | Popular vote | Delegates | |
| Count | Percentage | ||
| 1,898,664 | 94.13% | 117 | |
| Uncommitted | 71,803 | 3.56% | 0 |
| Bill Weld | 15,739 | 0.78% | 0 |
| Joe Walsh | 15,824 | 0.78% | 0 |
| Rocky De La Fuente | 7,563 | 0.38% | 0 |
| Bob Ely | 3,582 | 0.37% | 0 |
| Matthew Matern | 3,525 | 0.18% | 0 |
| Zoltan Istvan | 1,447 | 0.07% | 0 |
| Total: | 2,017,167 | 100% | 155 |
Results by county
Donald J. Trump won in every county.
| 2020 Texas Republican primary | ||||||||||||||||||
|---|---|---|---|---|---|---|---|---|---|---|---|---|---|---|---|---|---|---|
| County | De La Fuente Guerra | % | Ely | % | Istvan | % | Matern | % | Trump | % | Walsh | % | Weld | % | Uncommitted | % | Total votes cast | Turnout |
| Anderson | 16 | 0.20 | 1 | 0.01 | 1 | 0.01 | 15 | 0.19 | 7,646 | 96.63 | 30 | 0.38 | 24 | 0.30 | 180 | 2.27 | 7,913 | 28.07 |
| Andrews | 28 | 1.15 | 2 | 0.08 | 0 | 0.00 | 6 | 0.25 | 2,281 | 93.41 | 22 | 0.90 | 9 | 0.37 | 94 | 3.85 | 2,442 | 24.53 |
| Angelina | 20 | 0.16 | 23 | 0.18 | 5 | 0.04 | 21 | 0.16 | 12,166 | 94.97 | 79 | 0.62 | 59 | 0.46 | 437 | 3.41 | 12,810 | 24.82 |
| Aransas | 10 | 0.24 | 8 | 0.19 | 8 | 0.19 | 2 | 0.05 | 3,820 | 92.14 | 39 | 0.94 | 25 | 0.60 | 234 | 5.64 | 4,146 | 23.89 |
| Archer | 5 | 0.19 | 13 | 0.50 | 5 | 0.19 | 3 | 0.12 | 2,455 | 94.86 | 18 | 0.70 | 9 | 0.35 | 80 | 3.09 | 2,588 | 40.87 |
| Armstrong | 1 | 0.14 | 1 | 0.14 | 1 | 0.14 | 0 | 0.00 | 676 | 96.99 | 5 | 0.72 | 1 | 0.14 | 12 | 1.72 | 697 | 48.30 |
| Atascosa | 30 | 0.67 | 5 | 0.11 | 2 | 0.04 | 9 | 0.20 | 4,220 | 94.05 | 27 | 0.60 | 14 | 0.31 | 180 | 4.01 | 4,487 | 15.97 |
| Austin | 9 | 0.18 | 5 | 0.10 | 2 | 0.04 | 9 | 0.18 | 4,662 | 95.56 | 22 | 0.45 | 28 | 0.57 | 142 | 2.91 | 4,879 | 24.79 |
| Bailey | 16 | 1.74 | 1 | 0.11 | 1 | 0.11 | 1 | 0.11 | 832 | 90.73 | 9 | 0.98 | 6 | 0.65 | 51 | 5.56 | 917 | 26.21 |
Democratic primary
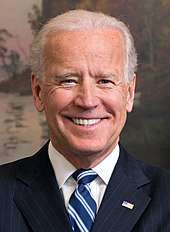
The Democratic primary was held on March 3, 2020. Elizabeth Warren, Bernie Sanders, and Joe Biden were among the major declared candidates.[6][7][8]
Results
| Candidate | Votes | % | Delegates |
|---|---|---|---|
| Joe Biden | 725,562 | 34.64 | 113 |
| Bernie Sanders | 626,339 | 29.91 | 99 |
| Michael Bloomberg | 300,608 | 14.35 | 11 |
| Elizabeth Warren | 239,237 | 11.42 | 5 |
| Pete Buttigieg (withdrawn†) | 82,671 | 3.95 | 0 |
| Amy Klobuchar (withdrawn†) | 43,291 | 2.07 | 0 |
| Julian Castro (withdrawn) | 16,688 | 0.80 | 0 |
| Tom Steyer (withdrawn†) | 13,929 | 0.67 | 0 |
| Michael Bennet (withdrawn) | 10,324 | 0.49 | 0 |
| Tulsi Gabbard | 8,688 | 0.41 | 0 |
| Andrew Yang (withdrawn) | 6,674 | 0.32 | 0 |
| Roque De La Fuente III | 5,469 | 0.26 | 0 |
| Cory Booker (withdrawn) | 4,941 | 0.24 | 0 |
| Marianne Williamson (withdrawn) | 3,918 | 0.19 | 0 |
| John Delaney (withdrawn) | 3,280 | 0.16 | 0 |
| Robby Wells | 1,505 | 0.07 | 0 |
| Deval Patrick (withdrawn) | 1,304 | 0.06 | 0 |
| Total | 2,094,428 | 100% | 228 |
General election
Predictions
| Source | Ranking | As of |
|---|---|---|
| The Cook Political Report[11] | Lean R | July 23, 2020 |
| Inside Elections[12] | Tilt R | July 17, 2020 |
| Sabato's Crystal Ball[13] | Lean R | July 14, 2020 |
| Politico[14] | Lean R | July 6, 2020 |
| RCP[15] | Tossup | August 3, 2020 |
| Niskanen[16] | Tossup | July 26, 2020 |
| CNN[17] | Lean R | August 3, 2020 |
| The Economist[18] | Lean R | August 15, 2020 |
| CBS News[19] | Lean R | August 9, 2020 |
| 270towin[20] | Lean R | August 2, 2020 |
| ABC News[21] | Lean R | July 31, 2020 |
| NPR[22] | Lean R | August 3, 2020 |
| NBC News[23] | Tossup | August 6, 2020 |
| 538[24] | Lean R | August 14, 2020 |
Polling
Aggregate polls
| Donald Trump vs. Joe Biden | ||||||
|---|---|---|---|---|---|---|
| Source of poll aggregation | Dates administered | Dates updated | Joe Biden | Donald Trump | Other/Undecided [lower-alpha 1] | Margin |
| Real Clear Politics | July 7 – August 5, 2020 | August 7, 2020 | 44.3% | 46.3% | 9.4% | Trump +2.0 |
| 270 to Win | June 29 – August 5, 2020 | August 7, 2020 | 45.2% | 45.8% | 9.0% | Trump +0.6 |
| FiveThirtyEight | February 27, 2020 - August 5, 2020 | August 9, 2020 | 45.9% | 46.8% | 7.3% | Trump +0.9 |
| Average | 45.1% | 46.3% | 8.6% | Trump +1.2 | ||
Donald Trump vs. Joe Biden
| Poll source | Date(s) administered |
Sample size[lower-alpha 2] |
Margin of error |
Donald Trump (R) |
Joe Biden (D) |
Other | Undecided |
|---|---|---|---|---|---|---|---|
| Trafalgar Group (R) | Aug 1–5, 2020 | 1,015 (LV) | ± 3.0% | 49% | 43% | 4%[lower-alpha 3] | 3% |
| Morning Consult | Jul 24–Aug 2, 2020 | 2,576 (LV) | ± 2.0% | 46% | 47% | 2% | 5% |
| Morning Consult | Jul 17–26, 2020 | 2,685 (LV) | ± 1.9% | 45% | 47% | – | – |
| Spry Strategies | Jul 16–20, 2020 | 750 (LV) | ± 3.5% | 49% | 45% | – | 6% |
| Quinnipiac University | Jul 16-20, 2020 | 880 (RV) | ± 3.3% | 44% | 45% | 4% | 4% |
| CBS News/YouGov | Jul 7–10, 2020 | 1,185 (LV) | ± 3.6% | 46% | 45% | 4%[lower-alpha 4] | 6% |
| Gravis Marketing/OANN | Jul 7, 2020 | 591 (LV) | ± 4.3% | 46% | 44% | – | – |
| Dallas Morning News/University of Texas at Tyler | Jun 29 – Jul 7, 2020 | 1,677 (LV) | ± 2.4% | 43% | 48% | 4% | 5% |
| YouGov/University of Texas/Texas Politics Project | Jun 19–29, 2020 | 1,200 (RV) | ± 2.89% | 48% | 44% | – | 8% |
| Public Policy Polling | Jun 24–25, 2020 | 729 (RV) | ± 3.6% | 46% | 48% | – | 5% |
| Fox News | Jun 20–23, 2020 | 1,001 (RV) | ± 3% | 44% | 45% | 5%[lower-alpha 5] | 5% |
| Public Policy Polling/Progress Texas[upper-alpha 1] | Jun 18–19, 2020 | 907 (V) | ± 3% | 48% | 46% | – | 6% |
| Public Policy Polling/Texas Democrats[upper-alpha 2] | Jun 2–3, 2020 | 683 (V) | – | 48% | 48% | – | 4% |
| Quinnipiac | May 28 – Jun 1, 2020 | 1,166 (RV) | ± 2.9% | 44% | 43% | 6%[lower-alpha 6] | 7% |
| Emerson College | May 8–10, 2020 | 800 (RV) | ± 3.4% | 47% | 41% | – | 12% |
| Public Policy Polling | Apr 27–28, 2020 | 1,032 (V) | – | 46% | 47% | – | 7% |
| Dallas Morning News/University of Texas at Tyler | Apr 18–27, 2020 | 1,183 (RV) | ± 2.85% | 43% | 43% | 5% | 9% |
| University of Texas/Texas Tribune | Apr 10–19, 2020 | 1,200 (RV) | ± 2.8% | 49% | 44% | – | 7% |
| AtlasIntel | Feb 24 – Mar 2, 2020 | 1,100 (RV) | ± 3.0% | 47% | 43% | 11% | – |
| NBC News/Marist College | Feb 23–27, 2020 | 2,409 (RV) | ± 2.5% | 49% | 45% | 1% | 5% |
| CNN/SSRS | Feb 22–26, 2020 | 1,003 (RV) | ± 3.4% | 47% | 48% | 3%[lower-alpha 7] | 2% |
| Univision | Feb 21–26, 2020 | 1,004 (RV) | ± 3.1% | 43% | 46% | – | 11% |
| Dallas Morning News/University of Texas at Tyler | Feb 17–26, 2020 | 1,221 (RV) | ± 2.8% | 45% | 44% | 11% | – |
| YouGov/University of Texas/Texas Tribune | Jan 31 – Feb 9, 2020 | 1,200 (RV) | ± 2.83% | 47% | 44% | –[lower-alpha 8] | –[lower-alpha 9] |
| University of Texas at Tyler/Dallas News | Jan 21–30, 2020 | 910 (LV) | ± 3.24% | 46% | 44% | 10%[lower-alpha 10] | – |
| Data For Progress[upper-alpha 3] | Jan 16–21, 2020 | 1,486 (LV) | – | 54% | 40% | 3%[lower-alpha 11] | 3% |
| Texas Lyceum | Jan 10–19, 2020 | 520 (LV) | ± 4.3% | 51% | 46% | – | 3% |
| CNN/SSRS | Dec 4–9, 2019 | 1,003 (RV) | – | 48% | 47% | 2%[lower-alpha 12] | 3% |
| Beacon Research (R) | Nov 9–21, 2019 | 1,601 | ± 3.0% | 45% | 44% | – | – |
| University of Texas at Tyler | Nov 5–14, 2019 | 1,093 | ± 3.0% | 45% | 39% | – | 16% |
| University of Texas/ Texas Tribune | Oct 18–27, 2019 | 1,200 | ± 2.8% | 46% | 39% | – | – |
| University of Texas at Tyler | Sep 13–15, 2019 | 1,199 | ± 2.8% | 38% | 40% | 13% | 9% |
| Univision | Aug 31 – Sep 6, 2019 | 1,004 (RV) | – | 43% | 47% | – | 10% |
| Climate Nexus | Aug 20–25, 2019 | 1,660 (RV) | ± 2.4% | 43% | 43% | – | 9% |
| University of Texas at Tyler | Aug 1–4, 2019 | 1,261 (RV) | ± 2.8% | 37% | 41% | 14% | 8% |
| Emerson | Aug 1–3, 2019 | 1,033 | ± 3.0% | 49% | 51% | – | – |
| University of Texas at Tyler | Jul 24–27, 2019 | 1,414 (RV) | ± 2.6% | 37% | 37% | 12% | 14% |
| Quinnipiac University | May 29 – Jun 4, 2019 | 1,159 | ± 3.4% | 44% | 48% | 1% | 4% |
| WPA Intelligence | Apr 27–30, 2019 | 200 | ± 6.9% | 49% | 42% | – | 7% |
| Emerson College | Apr 25–28, 2019 | 799 | ± 3.4% | 49% | 50% | – | – |
| Quinnipiac University | Feb 20–25, 2019 | 1,222 | ± 3.4% | 47% | 46% | 1% | 5% |
| Public Policy Polling (D)[upper-alpha 4] | Feb 13–14, 2019 | 743 | ± 3.6% | 49% | 46% | – | 5% |
Former candidates | ||||||||||||||||||||||||||||||||||||||||||||||||||||||||||||||||||||||||||||||||||||||||||||||||||||||||||||||||||||||||||||||||||||||||||||||||||||||||||||||||||||||||||||||||||||||||||||||||||||||||||||||||||||||||||||||||||||||||||||||||||||||||||||||||||||||||||||||||||||||||||||||||||||||||||||||||||||||||||||||||||||||||||||||||||||||||||||||||||||||||||||||||||||||||||||||||||||||||||||||||||||||||||||||||||||||||||||||||||||||||||||||||||||||||||||||||||||||||||||||||||||||||||||||||||||||||||||||||||||||||||||||||||||||||||||||||||||||||||||||||||||||||||||||||||||||||||||||||||||||||||||||||||||||||||||||||||||||||||||||||||||||||||||||||||||||||||||||||||||||||||||||||||||||||||||||||||||||||||||||||||||||||||||||||||||||||||||||||||||||||||||||||||||||||||||||||
|---|---|---|---|---|---|---|---|---|---|---|---|---|---|---|---|---|---|---|---|---|---|---|---|---|---|---|---|---|---|---|---|---|---|---|---|---|---|---|---|---|---|---|---|---|---|---|---|---|---|---|---|---|---|---|---|---|---|---|---|---|---|---|---|---|---|---|---|---|---|---|---|---|---|---|---|---|---|---|---|---|---|---|---|---|---|---|---|---|---|---|---|---|---|---|---|---|---|---|---|---|---|---|---|---|---|---|---|---|---|---|---|---|---|---|---|---|---|---|---|---|---|---|---|---|---|---|---|---|---|---|---|---|---|---|---|---|---|---|---|---|---|---|---|---|---|---|---|---|---|---|---|---|---|---|---|---|---|---|---|---|---|---|---|---|---|---|---|---|---|---|---|---|---|---|---|---|---|---|---|---|---|---|---|---|---|---|---|---|---|---|---|---|---|---|---|---|---|---|---|---|---|---|---|---|---|---|---|---|---|---|---|---|---|---|---|---|---|---|---|---|---|---|---|---|---|---|---|---|---|---|---|---|---|---|---|---|---|---|---|---|---|---|---|---|---|---|---|---|---|---|---|---|---|---|---|---|---|---|---|---|---|---|---|---|---|---|---|---|---|---|---|---|---|---|---|---|---|---|---|---|---|---|---|---|---|---|---|---|---|---|---|---|---|---|---|---|---|---|---|---|---|---|---|---|---|---|---|---|---|---|---|---|---|---|---|---|---|---|---|---|---|---|---|---|---|---|---|---|---|---|---|---|---|---|---|---|---|---|---|---|---|---|---|---|---|---|---|---|---|---|---|---|---|---|---|---|---|---|---|---|---|---|---|---|---|---|---|---|---|---|---|---|---|---|---|---|---|---|---|---|---|---|---|---|---|---|---|---|---|---|---|---|---|---|---|---|---|---|---|---|---|---|---|---|---|---|---|---|---|---|---|---|---|---|---|---|---|---|---|---|---|---|---|---|---|---|---|---|---|---|---|---|---|---|---|---|---|---|---|---|---|---|---|---|---|---|---|---|---|---|---|---|---|---|---|---|---|---|---|---|---|---|---|---|---|---|---|---|---|---|---|---|---|---|---|---|---|---|---|---|---|---|---|---|---|---|---|---|---|---|---|---|---|---|---|---|---|---|---|---|---|---|---|---|---|---|---|---|---|---|---|---|---|---|---|---|---|---|---|---|---|---|---|---|---|---|---|---|---|---|---|---|---|---|---|---|---|---|---|---|---|---|---|---|---|---|---|---|---|---|---|---|---|---|---|---|---|---|---|---|---|---|---|---|---|---|---|---|---|---|---|---|---|---|---|---|---|---|---|---|---|---|---|---|---|---|---|---|---|---|---|---|---|---|---|---|---|---|---|---|---|---|---|---|---|---|---|---|---|---|---|---|---|---|---|---|---|---|---|---|---|---|---|---|---|---|---|---|---|---|---|---|---|---|---|---|---|---|---|---|---|---|---|---|---|---|---|---|---|---|---|---|---|---|---|---|---|---|---|---|---|---|---|---|---|---|---|---|---|---|---|---|---|---|---|---|---|---|---|---|---|---|---|---|---|---|---|---|---|---|---|---|---|---|---|---|---|---|---|---|---|---|---|---|---|---|---|---|---|---|---|---|---|---|---|---|---|---|---|---|---|---|---|---|---|---|---|---|---|---|---|---|---|---|---|---|---|---|---|---|---|---|---|---|---|---|---|---|---|---|---|---|---|---|---|---|---|---|---|---|---|---|---|---|---|---|---|---|---|---|---|---|---|---|---|---|---|---|---|---|---|---|---|---|
|
Donald Trump vs. Bernie Sanders
Donald Trump vs. Elizabeth Warren
Donald Trump vs. Michael Bloomberg
Donald Trump vs. Amy Klobuchar
Donald Trump vs. Pete Buttigieg
Donald Trump vs. Tom Steyer
Donald Trump vs. Andrew Yang
Donald Trump vs. Cory Booker
with Donald Trump and Julian Castro
with Donald Trump and Kamala Harris
with Donald Trump and Beto O'Rourke
|
Hypothetical polling | ||||||||||||||||||||||||||||||||||||||||||||||||||||||||
|---|---|---|---|---|---|---|---|---|---|---|---|---|---|---|---|---|---|---|---|---|---|---|---|---|---|---|---|---|---|---|---|---|---|---|---|---|---|---|---|---|---|---|---|---|---|---|---|---|---|---|---|---|---|---|---|---|
|
with Donald Trump and Mark Cuban
with Donald Trump and a Generic Democrat
with Donald Trump and a generic Opponent
|
See also
Notes
- Partisan clients
- Poll sponsored by Progress Texas, an organisation promoting progressive policies
- Poll sponsored by the Texas Democratic Party
- By the time of this poll, Data for Progress, which has worked with both the Sanders and Warren campaigns, had endorsed Warren
- Poll sponsored by Democracy Toolbox
- Poll sponsored by Courageous Conservatives PAC
- Samples
- Calculated by taking the difference of 100% and all other candidates combined.
- Key:
A – all adults
RV – registered voters
LV – likely voters
V – unclear - "Another Party Candidate" with 2%; "Jo Jorgensen" with 2%
- "Someone else/third party" with 4%; would not vote with 0%
- "Other" with 4%; would not vote with 1%
- "Someone else" and would not vote with 3%
- Other with 1%; neither with 2%
- Data not yet released
- Data not yet released
- "Neither-other" with 10%
- Would not vote with 3%
- Other with 0%; neither with 2%
- Other with 0%; neither with 3%
- Data not yet released
- Data not yet released
- "Neither-other" with 12%
- Would not vote with 3%
- Other with 1%; neither with 3%
- Other with 0%; neither with 2%
- Data not yet released
- Data not yet released
- "Neither-other" with 12%
- Would not vote with 3%
- Other with 1%; neither with 2%
- Other with 0%; neither with 3%
- Data not yet released
- Data not yet released
- "Neither-other" with 9%
- Other with 0%; neither with 2%
- Data not yet released
- Data not yet released
- "Neither-other" with 16%
- Other with 0%; neither with 2%
- Data not yet released
- Data not yet released
- "Neither-other" with 15%
- Would not vote with 4%
- Other with 0%; neither with 2%
- "Neither-other" with 17%
- Data not yet released
- Data not yet released
- Listed as the combination of these responses: "Definitely or probably would not vote to re-elect Donald Trump"
- Not yet released
- "Would definitely not vote for Trump" with 48%
- "Would consider voting for Trump" with 14%; "Don't know/no answer" with 3%
References
- Kelly, Ben (August 13, 2018). "US elections key dates: When are the 2018 midterms and the 2020 presidential campaign?". The Independent. Retrieved January 3, 2019.
- "Distribution of Electoral Votes". National Archives and Records Administration. Retrieved January 3, 2019.
- "Governor Greg Abbott for President in 2020?". News/Talk 95.1 & 790 KFYO.
- Garrett, Robert T. (March 8, 2018). "Texas Gov. Greg Abbott rules out running for president – in 2020, at least". Dallas News.
- https://results.texas-election.com/races
- Taylor, Kate (9 February 2019). "Elizabeth Warren Formally Announces 2020 Presidential Bid in Lawrence, Mass". The New York Times. Retrieved 10 February 2019.
- Herndon, Astead W.; Burns, Alexander (December 31, 2018). "Elizabeth Warren Announces Iowa Trip as She Starts Running for President in 2020". The New York Times. Retrieved January 3, 2019.
- Arlette Saenz. "Joe Biden announces he is running for president in 2020". CNN. Retrieved 2019-05-18.
- "2020 MARCH 3RD DEMOCRATIC PRIMARY". Texas Secretary of State. Retrieved April 7, 2020.
- "Delegate Tracker". Associated Press. June 7, 2020. Retrieved June 7, 2020.
- "2020 POTUS Race ratings" (PDF). The Cook Political Report. Retrieved 2019-05-21.
- "POTUS Ratings | Inside Elections". insideelections.com. Retrieved 2019-05-21.
- "Larry J. Sabato's Crystal Ball » 2020 President". crystalball.centerforpolitics.org. Retrieved 2019-05-21.
- "2020 Election Forecast". Politico. November 19, 2019.
- "Battle for White House". RCP. April 19, 2019.
- 2020 Bitecofer Model Electoral College Predictions, Niskanen Center, March 24, 2020, retrieved: April 19, 2020
- David Chalian; Terence Burlij. "Road to 270: CNN's debut Electoral College map for 2020". CNN. Retrieved 2020-06-16.
- "Forecasting the US elections". The Economist. Retrieved 7 July 2020.
- "2020 Election Battleground Tracker". CBS News. July 12, 2020. Retrieved July 13, 2020.
- "2020 Presidential Election Interactive Map". 270 to Win.
- "ABC News Race Ratings". CBS News. July 24, 2020. Retrieved July 24, 2020.
- "2020 Electoral Map Ratings: Trump Slides, Biden Advantage Expands Over 270 Votes". NPR.org. Retrieved 2020-08-03.
- "Biden dominates the electoral map, but here's how the race could tighten". NBC News. Retrieved 2020-08-06.
- "2020 Election Forecast". FiveThirtyEight. Retrieved 14 August 2020.