1964 United States presidential election in Arizona
The 1964 United States presidential election in Arizona took place on November 3, 1964, as part of the 1964 United States presidential election, which was held throughout all 50 states and D.C. Voters chose five representatives, or electors to the Electoral College, who voted for president and vice president.
| ||||||||||||||||||||||||||
| ||||||||||||||||||||||||||
 County results
| ||||||||||||||||||||||||||
| ||||||||||||||||||||||||||
| Elections in Arizona | ||||||||||
|---|---|---|---|---|---|---|---|---|---|---|
 | ||||||||||
|
||||||||||
|
||||||||||
|
||||||||||
|
|
||||||||||
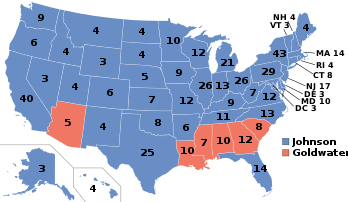
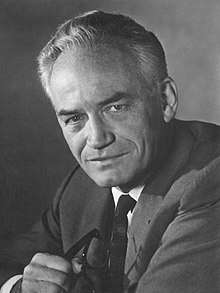
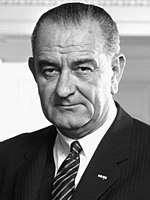
In a national landslide for incumbent President Lyndon B. Johnson, Arizona was one of only six states carried by Arizona native and U.S Senator Barry Goldwater, and the only state that Goldwater won outside of the Deep South. Johnson successfully carried many Republican strongholds such as Alaska, Idaho, Indiana, Kansas, Nebraska, Oklahoma, North and South Dakota, Utah, Vermont and Wyoming; however, he lost Arizona by 1.00% or less than 5,000 votes,[1] the smallest margin of any state in the election. Arizona’s result was 23 points more Republican than the country as a whole.
Key to Goldwater’s victory was Maricopa County, the state’s most populated county, which he won by over twenty-one thousand votes, enabling Goldwater to carry the state despite Johnson winning ten of fourteen counties and two of three congressional districts. This is as of the 2016 election the last occasion when Graham, Mohave and Yuma Counties have supported a Democratic presidential candidate[2] – indeed since 2000 Graham and Mohave counties have along with Yavapai County – which has never given a Democratic majority or plurality since Truman in 1948 – been the most Republican in the entire state.[3]
Since gaining statehood in 1912, Arizona had been considered a bellwether state in elections. Indeed, the previous presidential election was the first where the state did not back the winning candidate. This election, though, marked Arizona’s turn into a firm stronghold of the Republican Party. Starting in 1952 and continuing through 1992, Arizona would vote for the Republican candidate in every presidential election (mostly by relatively large margins, unlike Goldwater’s close victory), and it was the only state during those forty years not to vote for a Democrat at least once. Bill Clinton would carry the state by a small margin in 1996, but his victory has proven to be an exception, as the state has continued supporting Republicans since.
Results
| Presidential candidate | Party | Home state | Popular vote | Electoral vote |
Running mate | |||
|---|---|---|---|---|---|---|---|---|
| Count | Percentage | Vice-presidential candidate | Home state | Electoral vote | ||||
| Barry Goldwater | Republican | Arizona | 242,535 | 50.45% | 5 | William E. Miller | New York | 5 |
| Lyndon B. Johnson | Democratic | Texas | 237,753 | 49.45% | 0 | Hubert Humphrey | Minnesota | 0 |
| Eric Hass | Socialist Labor Party of America | New York | 482 | 0.10% | 0 | Henning A. Blomen | Massachusetts | 0 |
| Total | 480,770 | 100% | 5 | 5 | ||||
| Needed to win | 270 | 270 | ||||||
Results by county
| County | Barry Morrins Goldwater Republican |
Lyndon Baines Johnson Democratic |
Eric Hass Socialist Labor |
Margin | Total votes cast | ||||
|---|---|---|---|---|---|---|---|---|---|
| # | % | # | % | # | % | # | % | ||
| Apache | 1,849 | 47.51% | 2,042 | 52.47% | 1 | 0.03% | -193 | -4.96% | 3,892 |
| Cochise | 7,644 | 45.78% | 9,045 | 54.17% | 8 | 0.05% | -1,401 | -8.39% | 16,697 |
| Coconino | 5,756 | 52.15% | 5,270 | 47.75% | 11 | 0.10% | 486 | 4.40% | 11,037 |
| Gila | 3,713 | 35.24% | 6,821 | 64.73% | 3 | 0.03% | -3,108 | -29.50% | 10,537 |
| Graham | 2,655 | 48.82% | 2,783 | 51.18% | 0 | 0.00% | -128 | -2.35% | 5,438 |
| Greenlee | 1,132 | 26.45% | 3,147 | 73.55% | 0 | 0.00% | -2,015 | -47.09% | 4,279 |
| Maricopa | 143,114 | 53.94% | 122,042 | 46.00% | 170 | 0.06% | 21,072 | 7.94% | 265,326 |
| Mohave | 2,091 | 48.19% | 2,243 | 51.69% | 5 | 0.12% | -152 | -3.50% | 4,339 |
| Navajo | 4,870 | 50.47% | 4,770 | 49.44% | 9 | 0.09% | 100 | 1.04% | 9,649 |
| Pima | 46,955 | 46.36% | 54,120 | 53.44% | 203 | 0.20% | -7,165 | -7.07% | 101,278 |
| Pinal | 6,956 | 41.23% | 9,911 | 58.74% | 5 | 0.03% | -2,955 | -17.51% | 16,872 |
| Santa Cruz | 1,503 | 43.44% | 1,955 | 56.50% | 2 | 0.06% | -452 | -13.06% | 3,460 |
| Yavapai | 7,749 | 57.16% | 5,747 | 42.39% | 60 | 0.44% | 2,002 | 14.77% | 13,556 |
| Yuma | 6,548 | 45.44% | 7,857 | 54.52% | 5 | 0.03% | -1,309 | -9.08% | 14,410 |
| Totals | 242,535 | 50.45% | 237,753 | 49.45% | 482 | 0.10% | 4,782 | 0.99% | 480,770 |
References
- Our Campaigns; AZ US President Race, November 3, 1964
- Sullivan, Robert David; ‘How the Red and Blue Map Evolved Over the Past Century’; America Magazine in The National Catholic Review; June 29, 2016
- David Leip’s Atlass of US Presidential Elections 2000 Presidential General Election Data Graphs - Arizona by County