Politics of Northern Ireland
Since 1998, Northern Ireland has devolved government within the United Kingdom. The government and Parliament of the United Kingdom are responsible for reserved and excepted matters. Reserved matters are a list of policy areas (such as civil aviation, units of measurement, and human genetics), which the Westminster Parliament may devolve to the Northern Ireland Assembly at some time in future. Excepted matters (such as international relations, taxation and elections) are never expected to be considered for devolution. On all other matters, the Northern Ireland Executive together with the 90-member Northern Ireland Assembly may legislate and govern for Northern Ireland. Additionally, devolution in Northern Ireland is dependent upon participation by members of the Northern Ireland Executive in the North/South Ministerial Council, which co-ordinates areas of co-operation (such as agriculture, education and health) between Northern Ireland and the Republic of Ireland.
 |
|---|
| This article is part of a series on the politics and government of Northern Ireland |
a Lowercase "d" per here. |
|
Northern Ireland in the UK
|
|
|
Elections to the Northern Ireland Assembly are by single transferable vote with five representatives (Members of the Legislative Assembly, MLAs) elected from 18 parliamentary constituencies. Eighteen representatives to the lower house of the British parliament (Members of Parliament, MPs) are elected from the same constituencies using the first-past-the-post system. However, not all of these take their seats. The seven Sinn Féin MPs refuse to take the required oath to serve Queen Elizabeth II. In addition, the upper house of the UK's parliament, the House of Lords, currently has some 25 appointed members from Northern Ireland.
The Northern Ireland Office represents the British government in Northern Ireland on reserved matters. The Government of the Republic of Ireland also has the right to "put forward views and proposals" on non-devolved matters in relation to Northern Ireland. The Northern Ireland Office is led by the Secretary of State for Northern Ireland, who sits in the Cabinet of the United Kingdom.
Much of the population of Northern Ireland identifies with one of two different ideologies: unionism (which wants the region to remain part of the United Kingdom) and Irish nationalism (which wants a united Ireland). Unionists are predominantly Ulster Protestant, most of whom belong to the Presbyterian Church in Ireland and the Church of Ireland. Irish nationalists are almost wholly Roman Catholic. There is also a small minority of Ulster nationalists (those who want an independent Northern Irish state), whose religious convictions vary.
Political representation
Northern Ireland currently has the following political representation:
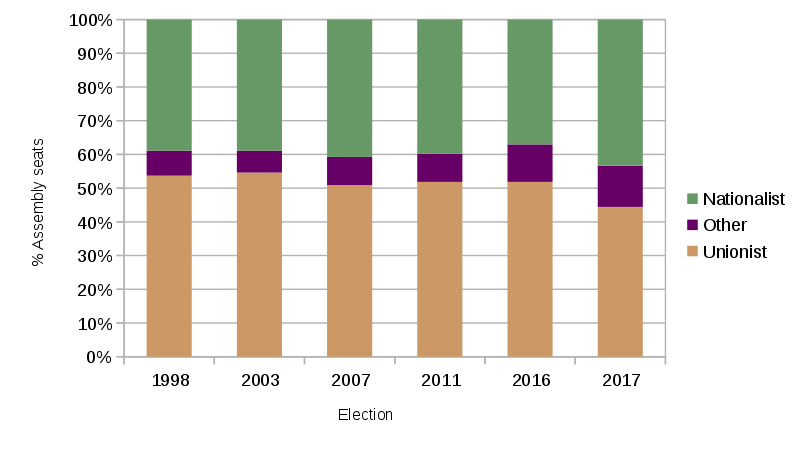
- the Northern Ireland Assembly has 90 Members of the Legislative Assembly (MLAs) (currently 40 unionists, 40 nationalists, 10 others [constitutionally neutral]), which had its powers restored on 8 May 2007.
- 18 seats in the United Kingdom House of Commons (currently 8 unionist MPs, 9 nationalist MPs and 1 neutral MP)[1]
- there are several unionists but no nationalists on the Privy Council of the United Kingdom (see List of Northern Ireland members of the Privy Council).
- at local level there are 11 district councils
Voting patterns
Voting patterns break down as follows:
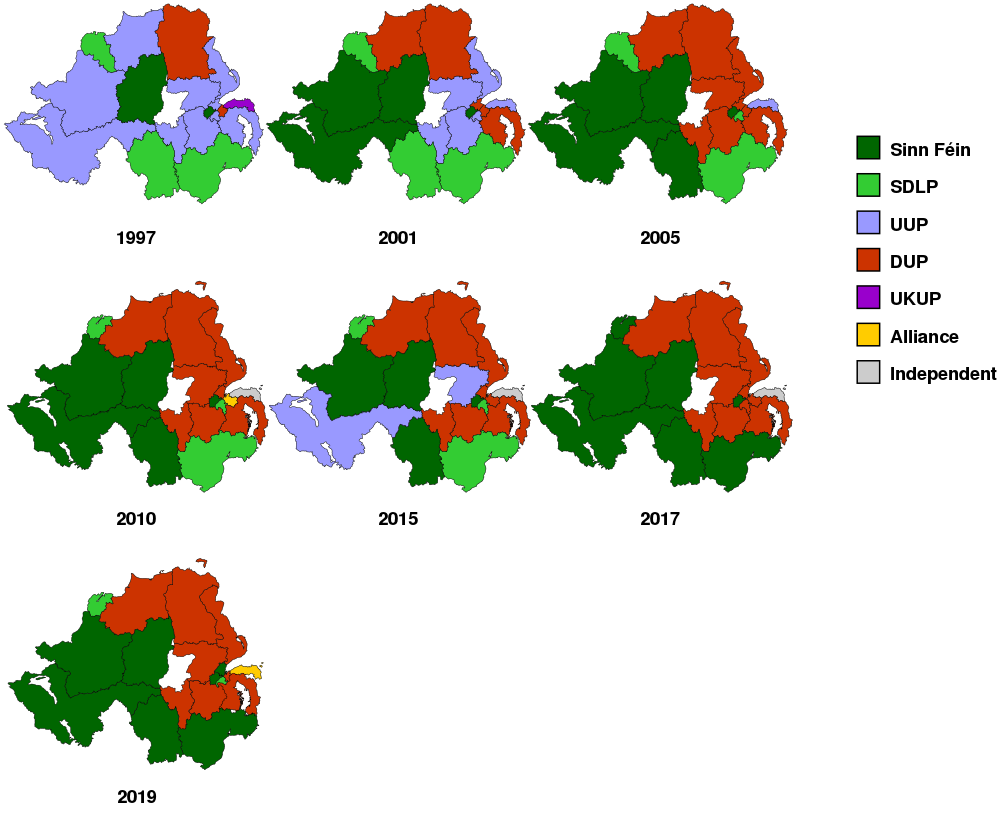
- 2019 Westminster election – unionists 43.2%, nationalists 38.9%, others 17.9%
- 2017 Westminster election – unionists 49.2%, nationalists 41.2%, others 9.6%
- 2015 Westminster election – unionists 50.2%, nationalists 38.5%, others 11.2%
- 2010 Westminster election – unionists 50.5%, nationalists 42.0%, others 7.5%
- 2005 Westminster election – unionists 51.4%, nationalists 41.8%, others 6.8%
- 2001 Westminster election – unionists 52.9%, nationalists 42.7%, others 4.4%
- 1997 Westminster election – unionists 50.5%, nationalists 40.2%, others 9.3%
- 2019 European election – unionists 42.9%, nationalists 35.9%, others 21.2%
- 2014 European election – unionists 51.0%, nationalists 38.6%, others 10.5%
- 2009 European election – unionists 49.0%, nationalists 42.2%, others 8.8%
- 2004 European election – unionists 48.6%, nationalists 42.2%, others 9.2%
- 1999 European election – unionists 52.3%, nationalists 45.4%, others 2.3%
- 2017 Assembly election – unionists 44.8%, nationalists 40.0%, others 15.5%
- 2016 Assembly election – unionists 48.5%, nationalists 36.4%, others 15.1%
- 2011 Assembly election – unionists 48.3%, nationalists 41.5%, others 10.2%
- 2007 Assembly election – unionists 48.6%, nationalists 42.0%, others 9.4%
- 2003 Assembly election – unionists 52.1%, nationalists 40.5%, others 7.4%
- 1998 Assembly election – unionists 50.6%, nationalists 39.7%, others 9.7%
Electoral systems
In all elections in Northern Ireland the single transferable vote system of proportional representation is used except for the House of Commons elections where a "first past the post" or plurality voting system is used.
Proposed representation in the Republic
Sinn Féin, currently the biggest of the nationalist parties in Northern Ireland, has campaigned for a broadening of the franchise of Northern Ireland voters to allow them to vote in elections to choose the President of Ireland. It had also demanded that all Northern Ireland Members of the European Parliament (MEPs) and MPs be allowed speaking rights in the lower house of the parliament of the Republic of Ireland, Dáil Éireann. It was given to understand that the Irish government accepted this and had plans to introduce legislation in the autumn of 2005.[2] The Social Democratic and Labour Party (SDLP) backed the move. However, a spokesman for Taoiseach Bertie Ahern later rowed back, stating that it had never been intended that the MPs have a right to attend plenary sessions of the Dáil, but that they would be invited to participate in Oireachtas committees dealing with Northern Ireland matters, and only if there was all-party agreement behind it. The unionist parties, along with Fine Gael, Labour and the Progressive Democrats have all declared their opposition to the move, as has much of the Irish media, with articles highly critical of the proposal published in The Irish Times and the Sunday Independent.[3][4] Nonetheless on 22 November 2007, representatives from both Sinn Féin and the SDLP, (unionists declined the invitation) attended a meeting of the Oireachtas committee reviewing the workings of the Good Friday Agreement. The 18 Northern Ireland MPs can take part in this committee's debates (as well as other relevant committees by invitation), but will not have a right to vote or to move motions and amendments.[5]
Political parties
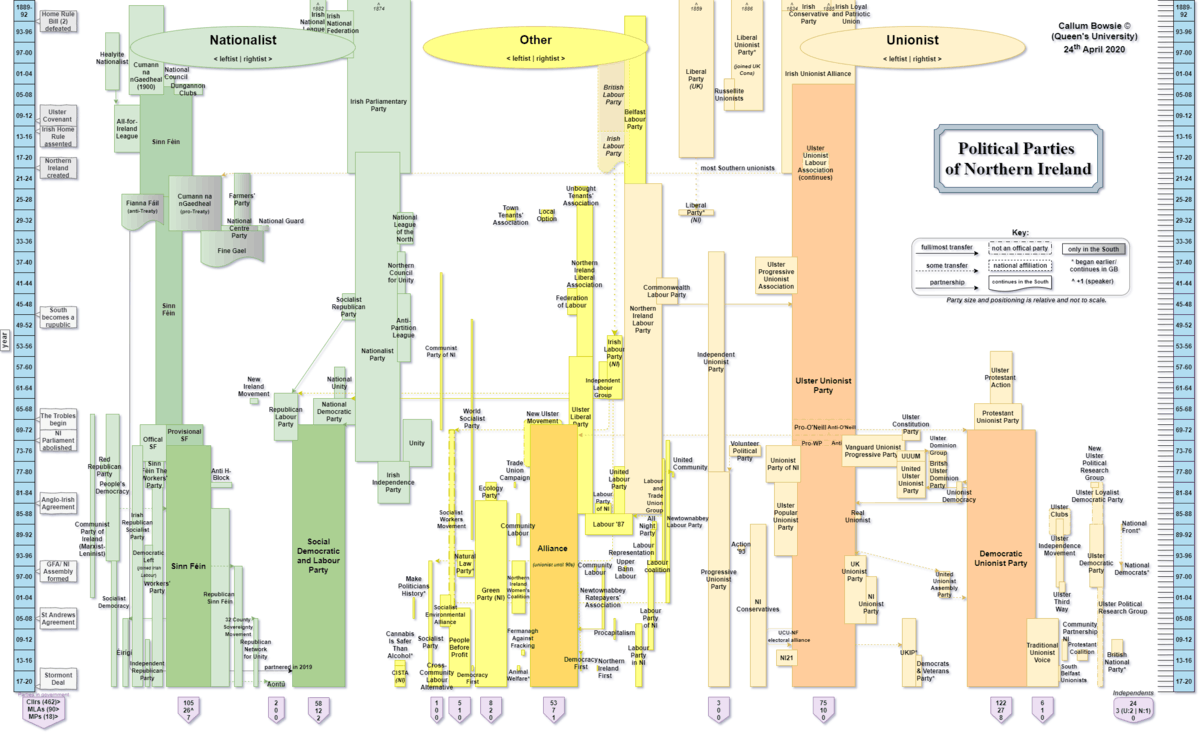
Political parties in Northern Ireland can be divided into three distinct categories:
- unionist parties, such as the Democratic Unionist Party (DUP), the Ulster Unionist Party, (UUP) and other smaller parties such as the Progressive Unionist Party (PUP) and Traditional Unionist Voice (TUV)
- nationalist parties like Sinn Féin and the SDLP
- cross-community parties such as the Alliance Party and the Green Party.
Unionist parties
The Ulster Unionist Party was historically a cross-class Volkspartei who ran the Northern Ireland Government in a dominant-party system from its creation until 1972, although since the rise of the DUP in the 1970s, its support has been concentrated more in the middle class. Until 1972 the UUP's members of the British House of Commons took the Conservative Party whip, but currently sit as a party in their own right. The UUP's member of the European Parliament had belonged to the European Conservatives and Reformists Group.
The DUP are a more complex mixture than the other major parties, combining support from rural evangelicals and urban, secular, working class voters. The party is firmly to the right on issues such as abortion, capital punishment, European integration and equal opportunities, although it seems to be moderating its stance on gay rights since the "Save Ulster from Sodomy" campaign of the 1980s. Conversely, the DUP often support social programmes which benefit their working class or agricultural base, for example, free public transport for the elderly and European Union agricultural subsidies. The DUP have grown in recent years as they were originally the only major party to oppose the Good Friday Agreement, although until September 2015 they were part of a government operating it.
The smaller, left-leaning Progressive Unionist Party and Ulster Political Research Group are linked with the Ulster Volunteer Force and Ulster Defence Association respectively.
Nationalist parties
.jpg)
Similarly, on the nationalist side of the political spectrum, Sinn Féin has overtaken the traditionally dominant SDLP in recent elections. Sinn Féin is a left-wing Irish republican party, committed to espousing an all-Ireland republic. Traditionally the party of the urban Catholic working class and a number of republican rural areas, since the IRA ceasefires of the mid-1990s it has expanded its base considerably and has overtaken the long-dominant SDLP in terms of vote share.
The SDLP are a nominally social democratic party and a full member of the Party of European Socialists and Socialist International. However, as the Northern Ireland party system is not based on socio-economic divisions, it attracts a wide spectrum of opinion and has a middle class support base. The SDLP support Irish reunification, but utterly reject the use of violence as a means to that end. The SDLP has lost considerable support in the past decade, with the retirement of key figures such as former leader John Hume and deputy leader Seamus Mallon and the IRA's cessation of violence. The party has members who wish to follow an agenda focusing primarily on "bread and butter issues" (taxation, employment, education, health, etc.) and those who wish to follow a more nationalist campaign to challenge Sinn Féin.
Unlike in unionism, religion is—according to the study of Evans and Duffy—not a major factor in patterns of nationalist parties' supporters (although Sinn Féin supporters tend to be more secular). Age has a strong impact on party choice: the more radical Sinn Féin has more support among the young than the SDLP has. The most important factor is attachment to nationalist ideology: Sinn Féin has high levels of support among people strongly committed to nationalism[6]
Cross-community and other parties
Among the cross-community parties, the Alliance Party of Northern Ireland draws its support mainly from middle class professionals in the suburbs of Belfast. It professes to be the only significant party which does not base its political stance around the constitutional question. The party has strong links with the Liberal Democrats in Britain and is a member of the European Liberal Democrat and Reform Party and Liberal International.
Other parties who contest elections in Northern Ireland include the Green Party, the Workers' Party and the Northern Ireland branch of the Conservative Party. The feminist Northern Ireland Women's Coalition briefly held seats in the Northern Ireland Assembly, but is now defunct. Ulster Third Way was a small grouping advocating independence for Northern Ireland.
Fianna Fáil, the second-largest party in the Republic, opened a cumann (branch) in Derry, and began recruiting at Queens University Belfast. The leadership as of 2005 had decided not to take part in electoral politics in Northern Ireland, however in the latter part of 2007 the Taoiseach said his party was consulting its grassroots on the possibility of contesting elections in the North, and that in advance of this Fianna Fáil had registered as a political party in Northern Ireland.[7][8] Some, within both Fianna Fáil and the SDLP (including former SDLP European elections candidate Martin Morgan) have advocated an alliance, or even a merger, between both parties. However, many in both parties are hostile to the idea, with some in the SDLP pointing out the left-wing links between the party and the Irish Labour Party.
Future of political parties in Northern Ireland
Some commentators believe there are indications that the religious and ethnic basis of the party system may start to disintegrate. For example, in the 1998–2003 Assembly, there was a Catholic Member of the Legislative Assembly sitting for the Ulster Unionist Party. The SDLP have had a number of Protestant representatives in the past and a Protestant SDLP councillor defected to Sinn Féin in 2004. Up to now, these have been one-off events, which have occurred periodically throughout Northern Ireland's history without setting a trend—cf Sir Denis Henry in the early part of the 20th century. In any event, social class is an important part of competition within the main ethnic political blocs, and class-based party structures in other established democracies have weakened since the end of the Cold War.
There are indications that party stances on issues like same-sex marriage are causing people who feel strongly about these issues to vote accordingly, rather than on the constitutional issue.
Political demography
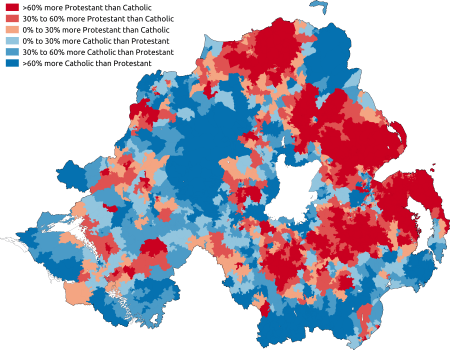
Once established under the Government of Ireland Act 1920, Northern Ireland, since it was an approximation of that area where those favouring remaining part of the UK were in the majority, was structured geographically in a way which guaranteed a unionist majority in the Parliament of Northern Ireland.
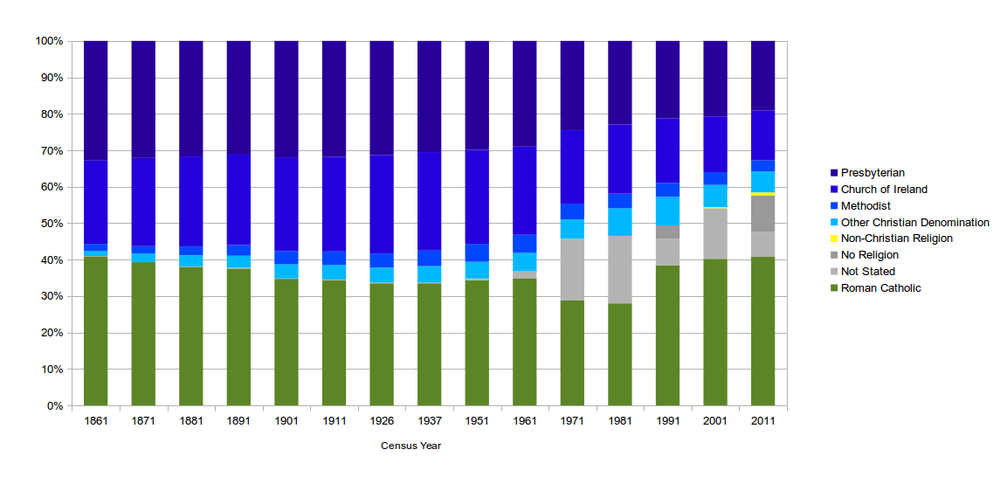
The proportion of people claiming to be Roman Catholic in the Northern Ireland Census has increased since the 1920s,[9] although the rate of this increase has slowed in recent years. In contrast, the proportion of people claiming to be Presbyterian and Church of Ireland in the census has decreased. A Catholic plurality over Protestants is predicted by the time of the 2021 census,[10] with Catholics dominant to the west and south of Northern Ireland, while Protestants are expected to retain a majority primarily to the east and north. The anticipated Catholic plurality is based on the assumption that the current trends of demographic change will continue, but at a slower rate than previously. The last 20 years have seen a 10.5% reduction in the proportion of the population who state they are Protestant or brought up Protestant (from 58.5% to 48%), and a 3.5% increase in those of who state they are Catholic or brought up Catholic (from 41.5% to 45%).[11]
Between the 2001 and 2011 censuses there was an unprecedented wave of migration into Northern Ireland following the accession of eight countries into the EU. Since 2004, Northern Ireland has welcomed a disproportionate number of A8 citizens (particularly Polish citizens) compared with the rest of the UK.[12] Most of these new migrants from the A8 countries were Catholic. Of the entire Catholic population in the 2011 census, 3.1% were born in an A8 country.[13] In the 2011 census 1.24%[13] of the population of Northern Ireland were Catholics born in an A8 country. In comparison, between the 2001 and 2011 censuses the proportion of the total population claiming to be Catholic only increased by +0.50% (from 40.26%[14] to 40.76%[13]). The period of this migration, from 2004 onwards, did not correspond with any rise in the share of the vote for nationalist political parties.
The religious affiliations, based on census returns, have changed as follows between 1961 and 2002:
| Religions | 1961 | 1991 | 2001 | 2011 |
|---|---|---|---|---|
| Roman Catholic | 34.9% | 38.4% | 40.3% | 40.8% |
| Presbyterian (Protestant) | 29.0% | 21.4% | 20.7% | 19.1% |
| Church of Ireland (Protestant) | 24.2% | 17.7% | 15.3% | 13.7% |
| Other religions (including other Protestant) | 9.3% | 11.5% | 9.9% | 9.6% |
| Not stated | 2.0% | 7.3% | 9.0% | 6.7% |
| None | 0.0% | 3.8% | 5.0% | 10.1% |
The religious affiliations in the different districts of Northern Ireland were as follows. The "Protestant and other Christian" category includes groups such as Quakers that are not associated with either Unionism or Republicanism in Northern Ireland.
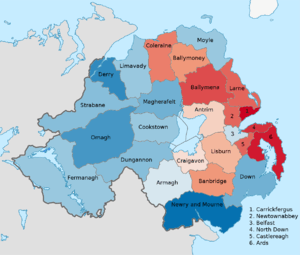
| District | 2001[16] | 2011[17] | ||||
|---|---|---|---|---|---|---|
| Catholic | Protestant and other Christian | Other | Catholic | Protestant and other Christian | Other | |
| Antrim | 35.2% | 47.2% | 17.6% | 37.5% | 43.2% | 19.2% |
| Ards | 10.4% | 68.7% | 20.9% | 10.9% | 65.4% | 23.6% |
| Armagh | 45.4% | 45.5% | 9.1% | 44.8% | 43.0% | 12.2% |
| Ballymena | 19.0% | 67.8% | 13.3% | 20.4% | 63.3% | 16.3% |
| Ballymoney | 29.5% | 59.1% | 11.3% | 29.6% | 56.7% | 13.6% |
| Banbridge | 28.6% | 58.7% | 12.7% | 29.4% | 55.3% | 15.3% |
| Belfast | 42.1% | 40.3% | 17.5% | 41.9% | 34.1% | 24.0% |
| Carrickfergus | 6.5% | 70.4% | 23.1% | 7.6% | 67.2% | 25.2% |
| Castlereagh | 15.8% | 64.9% | 19.3% | 19.5% | 57.3% | 23.2% |
| Coleraine | 24.1% | 60.5% | 15.4% | 25.0% | 56.8% | 18.2% |
| Cookstown | 55.2% | 38.0% | 6.8% | 55.1% | 34.0% | 11.0% |
| Craigavon | 41.7% | 46.7% | 11.6% | 42.1% | 42.1% | 15.8% |
| Derry | 70.9% | 20.8% | 8.4% | 67.4% | 19.4% | 13.1% |
| Down | 57.1% | 29.2% | 13.7% | 57.5% | 27.1% | 15.4% |
| Dungannon | 57.3% | 34.9% | 7.7% | 58.7% | 29.8% | 11.5% |
| Fermanagh | 55.5% | 36.1% | 8.4% | 54.9% | 34.3% | 10.8% |
| Larne | 22.2% | 61.9% | 15.9% | 21.8% | 59.7% | 18.5% |
| Limavady | 53.1% | 36.1% | 10.7% | 56.0% | 34.3% | 9.7% |
| Lisburn | 30.1% | 53.6% | 16.4% | 32.8% | 47.9% | 19.3% |
| Magherafelt | 61.5% | 32.0% | 6.5% | 62.4% | 28.3% | 9.3% |
| Moyle | 56.6% | 33.8% | 9.6% | 54.4% | 32.3% | 13.3% |
| Newry and Mourne | 75.9% | 16.4% | 7.7% | 72.1% | 15.2% | 12.7% |
| Newtownabbey | 17.1% | 64.5% | 18.4% | 19.9% | 57.8% | 22.3% |
| North Down | 10.0% | 64.5% | 25.5% | 11.2% | 60.3% | 28.5% |
| Omagh | 65.1% | 26.3% | 8.6% | 65.4% | 24.8% | 9.8% |
| Strabane | 63.1% | 30.9% | 6.0% | 60.1% | 30.7% | 9.2% |
| Religions | 2001 | 2011 |
|---|---|---|
| Roman Catholic | 43.8% | 45.1% |
| All other Christian | 53.1% | 48.4% |
| Other Religions | 0.4% | 0.9% |
| None | 2.7% | 5.6% |
Views on the Union
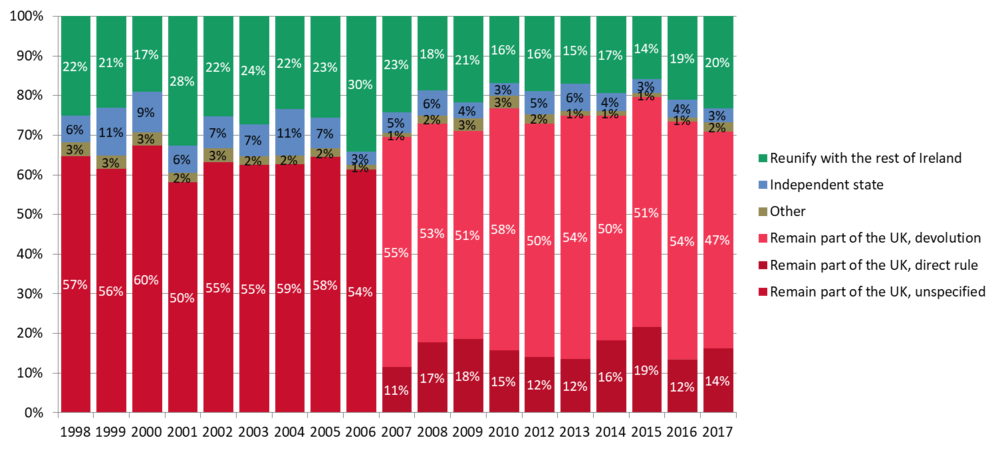
According to a 2018 Northern Ireland Life and Times Survey carried out by Queens University Belfast and Ulster University, 62% supported remaining part of the United Kingdom via devolved government or direct rule, with support for leaving the UK and forming a united Ireland at 19%. In terms of religion, 39% of Northern Ireland Catholics supported remaining part of the United Kingdom via devolved government or direct rule, usually while also supporting nationalist political parties.[19] The proportion of Catholics supporting a united Ireland was 39% according to the same poll. The proportion of Protestants in the study who wished to join the Republic was 5%, with 83% preferring to remain in the United Kingdom in some form.[19] There are also considerable numbers of people who give ambiguous answers to questions about the future constitutional status of Northern Ireland. Some nationalists have historically sought a favourable arrangement for Ireland within the United Kingdom. Some Protestants (such as paramilitaries and their supporters) usually term themselves as loyalists as well as unionists. As a result, the term "loyalist" has become less popular among unionists in recent decades, especially with unionist politicians. 4% of Catholics and 1% of Protestants supported independence for Northern Ireland as part of the same survey.[19] Support for this, while fluctuating, is regarded as insignificant.
Elections in Northern Ireland are often characterised as mini-referendums on the constitutional question. Voters may also perceive voting to be about strengthening the hand of their section of the community within Northern Ireland, or about gaining advantage for their social class.
In 2016 an Ipsos Mori poll asked "If there was a referendum on the border tomorrow would you:" and the answers for different regions of Northern Ireland were as follows,[21]
| Belfast City | Greater Belfast | Down | Armagh | Tyrone/Fermanagh | Londonderry | Antrim | |
|---|---|---|---|---|---|---|---|
| Vote to stay in the United Kingdom | 65% | 77% | 57% | 50% | 51% | 53% | 72% |
| Vote for Northern Ireland to join the Republic of Ireland outside the United Kingdom | 17% | 10% | 27% | 41% | 28% | 28% | 17% |
| Don't know | 17% | 10% | 13% | 7% | 19% | 16% | 6% |
| Would not vote | 0% | 3% | 3% | 2% | 2% | 2% | 6% |
The same poll recorded answers from people in different age groups as follows,[22]
| Age band | 18-24 | 25-34 | 35-44 | 45-54 | 55-64 | 65+ |
|---|---|---|---|---|---|---|
| Vote to stay in the United Kingdom | 67% | 63% | 51% | 57% | 60% | 77% |
| Vote for Northern Ireland to join the Republic of Ireland outside the United Kingdom | 19% | 19% | 30% | 28% | 22% | 14% |
| Don't know | 12% | 15% | 18% | 13% | 13% | 7% |
| Would not vote | 2% | 3% | 1% | 2% | 6% | 2% |
Answers from people of different religious backgrounds were as follows,[21]
| Community background | Protestant | Catholic | Neither |
|---|---|---|---|
| Vote to stay in the United Kingdom | 88% | 37% | 51% |
| Vote for Northern Ireland to join the Republic of Ireland outside the United Kingdom | 5% | 43% | 15% |
| Don't know | 5% | 17% | 30% |
| Would not vote | 2% | 2% | 4% |
National identity
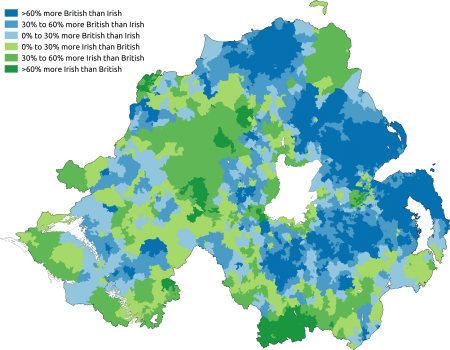
In Northern Ireland, national identity is complex and diverse. Many in Northern Ireland have a British national identity seeing the English, Scots and Welsh as fellow members of their common nation while seeing those from the Republic of Ireland as foreigners. Many others in Northern Ireland see those from the Republic of Ireland as being members of their common nation encompassing the island of Ireland and see the English, Scots and Welsh as foreigners. Co-existing with this dichotomy is a Northern Irish identity which can be held alone or, as is also the case with Englishness, Scottishness and Welshness, alongside a British identity, or alongside an Irish identity. A small number of people see themselves as being both British and Irish.
While there is a strong correlation in Northern Ireland between religious background and the perception of which geographical area forms the nation to which that person feels they belong, it is not a strict relationship and national identity is not simply distributed proportionally in accordance with the percentages of different religions in a particular area. For example, Catholics overall are almost five times more likely to view themselves as being British only, than Protestants are to view themselves as being Irish only. In the 2011 census there were four of the twenty-six districts in Northern Ireland, all on the eastern seaboard, where Catholics were more likely to view themselves as being British than Irish: Carrickfergus, Larne, North Down, and Ards; whereas even in those districts where Protestants were most likely to view themselves as Irish, such as Derry, Fermanagh and Newry and Mourne, Protestants were still more than ten times more likely to view themselves as British than Irish.
While in the 2011 census Protestants outnumbered Catholics in only half of the districts in Northern Ireland, those who considered themselves British outnumbered those who considered themselves Irish in twenty of the twenty-six districts. This is partly because Catholics were more likely to see themselves as British than Protestants were to see themselves as Irish, but is also partly because those of no religion were substantially more likely to see themselves as British as see themselves as Irish.
In the 2011 census respondents gave their national identity as follows.
| National identity | Respondents |
|---|---|
| British | 876,577 |
| Northern Irish | 533,085 |
| Irish | 513,390 |
| English, Scottish or Welsh | 29,187 |
| Other | 61,884 |
National identity by religion[24]
| National Identity | All | Catholic | Protestant and other Christian | Other religions | No religion |
|---|---|---|---|---|---|
| British | 48.4% | 12.9% | 81.6% | 50.1% | 55.9% |
| Irish | 28.4% | 57.2% | 3.9% | 12.4% | 14.0% |
| Northern Irish | 29.4% | 30.7% | 26.9% | 18.0% | 35.2% |
| English, Scottish or Welsh | 1.6% | 0.8% | 1.5% | 2.9% | 5.2% |
| All other | 3.4% | 4.4% | 1.0% | 29.1% | 7.1% |
Detail by religion[25]
| National identity | All | Catholic | Protestant and other Christian | Other religions | No religion |
|---|---|---|---|---|---|
| British only | 39.9% | 10.3% | 68.3% | 42.4% | 42.9% |
| Irish only | 25.3% | 53.2% | 2.1% | 8.1% | 9.4% |
| Northern Irish only | 20.9% | 26.9% | 14.5% | 12.0% | 23.7% |
| British and Northern Irish only | 6.2% | 0.9% | 11.1% | 3.3% | 7.9% |
| Irish and Northern Irish only | 1.1% | 2.0% | 0.2% | 0.5% | 0.8% |
| British, Irish and Northern Irish only | 1.0% | 0.8% | 1.0% | 1.0% | 2.1% |
| British and Irish only | 0.7% | 0.8% | 0.5% | 0.7% | 1.0% |
| English, Scottish or Welsh only | 1.0% | 0.6% | 0.8% | 2.1% | 3.5% |
| Other | 4.0% | 4.7% | 1.6% | 29.9% | 8.7% |
| Total | 100.0% | 100.0% | 100.0% | 100.0% | 100.0% |
National identity by district[26]
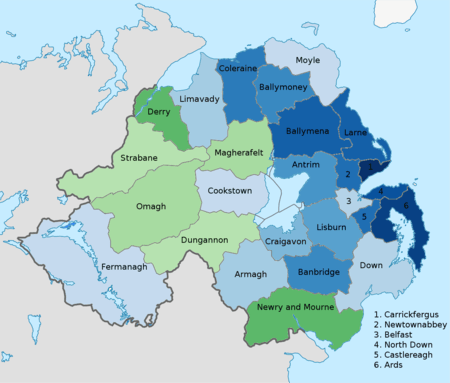
| District | British | Irish | Northern Irish | English, Scottish or Welsh | All Other |
|---|---|---|---|---|---|
| Antrim | 55.2% | 20.1% | 30.4% | 2.3% | 3.9% |
| Ards | 73.6% | 7.5% | 31.9% | 1.9% | 1.5% |
| Armagh | 44.4% | 32.4% | 27.1% | 1.1% | 3.9% |
| Ballymena | 69.0% | 11.1% | 27.9% | 1.4% | 3.8% |
| Ballymoney | 60.6% | 16.4% | 30.9% | 1.7% | 1.7% |
| Banbridge | 61.1% | 16.2% | 31.8% | 1.5% | 1.8% |
| Belfast | 43.2% | 34.8% | 26.8% | 1.5% | 5.1% |
| Carrickfergus | 76.5% | 5.3% | 30.3% | 2.1% | 1.8% |
| Castlereagh | 66.2% | 14.7% | 31.3% | 1.5% | 2.6% |
| Coleraine | 62.4% | 14.5% | 31.6% | 2.0% | 3.2% |
| Cookstown | 37.3% | 33.5% | 32.1% | 1.2% | 3.7% |
| Craigavon | 48.3% | 25.6% | 28.7% | 1.4% | 6.4% |
| Derry | 23.7% | 55.0% | 24.6% | 1.4% | 2.0% |
| Down | 40.2% | 32.2% | 34.1% | 1.9% | 2.0% |
| Dungannon | 30.9% | 38.8% | 27.1% | 0.9% | 9.6% |
| Fermanagh | 37.2% | 36.1% | 29.5% | 1.7% | 3.1% |
| Larne | 69.8% | 10.1% | 31.4% | 2.1% | 1.2% |
| Limavady | 42.2% | 32.0% | 30.7% | 1.5% | 1.4% |
| Lisburn | 55.6% | 24.7% | 28.7% | 2.0% | 2.4% |
| Magherafelt | 31.4% | 42.7% | 29.8% | 1.0% | 2.8% |
| Moyle | 38.6% | 34.1% | 32.1% | 2.2% | 1.4% |
| Newry and Mourne | 20.2% | 53.0% | 27.6% | 1.2% | 4.3% |
| Newtownabbey | 66.5% | 13.4% | 31.2% | 1.3% | 2.4% |
| North Down | 71.1% | 9.1% | 33.0% | 3.0% | 2.4% |
| Omagh | 28.6% | 40.9% | 32.7% | 1.1% | 3.4% |
| Strabane | 33.0% | 39.2% | 31.8% | 1.4% | 1.3% |
National identity by religion or religion brought up in for each district[26]
| District | Catholic | Protestant and other Christian | Other Religion or None | |||||||||
|---|---|---|---|---|---|---|---|---|---|---|---|---|
| British | Irish | Northern Irish | All Other | British | Irish | Northern Irish | All Other | British | Irish | Northern Irish | All Other | |
| Antrim | 23.1% | 43.7% | 34.2% | 7.1% | 80.6% | 3.1% | 27.8% | 3.3% | 60.4% | 6.5% | 26.8% | 19.0% |
| Ards | 34.1% | 31.7% | 38.2% | 6.4% | 80.9% | 3.7% | 30.4% | 2.2% | 67.7% | 6.0% | 35.1% | 9.1% |
| Armagh | 7.1% | 62.5% | 28.7% | 6.2% | 81.6% | 3.6% | 25.7% | 2.3% | 49.3% | 10.5% | 25.1% | 25.3% |
| Ballymena | 24.6% | 38.9% | 34.7% | 11.0% | 83.6% | 2.7% | 25.7% | 2.5% | 62.3% | 6.5% | 28.4% | 14.4% |
| Ballymoney | 19.0% | 44.5% | 38.8% | 4.1% | 81.1% | 2.9% | 27.2% | 2.2% | 65.1% | 8.4% | 28.0% | 13.3% |
| Banbridge | 22.6% | 41.7% | 39.4% | 4.5% | 81.2% | 3.8% | 27.7% | 2.0% | 59.1% | 8.3% | 33.8% | 11.5% |
| Belfast | 11.7% | 64.3% | 25.0% | 5.6% | 78.3% | 5.5% | 28.7% | 3.6% | 47.7% | 13.3% | 27.5% | 26.3% |
| Carrickfergus | 41.1% | 24.6% | 35.6% | 10.7% | 82.0% | 3.0% | 29.2% | 2.4% | 68.3% | 5.3% | 33.7% | 8.5% |
| Castlereagh | 22.1% | 50.0% | 34.5% | 6.3% | 81.3% | 3.9% | 29.9% | 2.3% | 61.9% | 8.9% | 33.7% | 11.8% |
| Coleraine | 25.0% | 39.2% | 36.5% | 8.4% | 79.1% | 4.3% | 29.3% | 2.6% | 56.5% | 10.3% | 33.4% | 16.8% |
| Cookstown | 8.1% | 53.8% | 37.7% | 5.2% | 82.5% | 3.6% | 24.0% | 2.1% | 44.2% | 9.1% | 24.4% | 31.5% |
| Craigavon | 12.2% | 51.2% | 31.5% | 10.6% | 82.5% | 3.2% | 26.3% | 2.7% | 49.9% | 9.1% | 26.7% | 26.4% |
| Derry | 7.3% | 70.5% | 24.3% | 2.5% | 76.7% | 7.2% | 25.9% | 3.5% | 39.4% | 24.7% | 21.9% | 26.2% |
| Down | 20.1% | 47.4% | 37.1% | 2.9% | 77.4% | 5.6% | 28.7% | 3.6% | 52.1% | 14.4% | 32.1% | 16.7% |
| Dungannon | 5.7% | 57.6% | 28.6% | 13.0% | 79.6% | 4.5% | 24.5% | 3.0% | 33.3% | 12.0% | 22.8% | 42.1% |
| Fermanagh | 11.4% | 56.2% | 32.4% | 4.8% | 77.1% | 6.2% | 25.5% | 3.0% | 43.4% | 16.8% | 24.0% | 28.1% |
| Larne | 38.8% | 30.6% | 37.7% | 3.0% | 81.7% | 3.0% | 28.6% | 2.5% | 64.1% | 6.5% | 35.4% | 12.1% |
| Limavady | 18.1% | 50.5% | 34.4% | 2.5% | 79.8% | 4.1% | 24.9% | 2.5% | 51.4% | 10.9% | 28.8% | 18.7% |
| Lisburn | 16.5% | 58.6% | 27.8% | 4.3% | 80.2% | 4.7% | 29.0% | 3.2% | 62.2% | 8.8% | 30.3% | 13.9% |
| Magherafelt | 6.5% | 62.1% | 33.0% | 3.8% | 82.4% | 4.2% | 23.1% | 2.3% | 46.9% | 13.4% | 30.2% | 22.1% |
| Moyle | 14.6% | 53.1% | 35.3% | 2.8% | 76.3% | 5.0% | 27.8% | 3.3% | 49.4% | 17.8% | 23.8% | 19.8% |
| Newry and Mourne | 7.1% | 64.7% | 28.0% | 5.0% | 76.3% | 5.8% | 26.8% | 3.8% | 34.6% | 22.8% | 22.1% | 28.9% |
| Newtownabbey | 24.7% | 46.1% | 34.1% | 5.7% | 80.9% | 3.4% | 30.1% | 1.7% | 63.1% | 7.3% | 32.1% | 12.3% |
| North Down | 37.1% | 31.5% | 36.1% | 9.7% | 78.8% | 5.2% | 31.9% | 3.4% | 63.7% | 7.9% | 35.7% | 11.6% |
| Omagh | 8.7% | 55.7% | 36.0% | 4.4% | 78.5% | 4.9% | 25.0% | 2.5% | 40.6% | 15.9% | 23.7% | 28.9% |
| Strabane | 8.9% | 57.4% | 35.4% | 2.6% | 79.2% | 4.7% | 25.2% | 1.9% | 40.9% | 21.1% | 25.5% | 26.4% |
National identity by age[23]
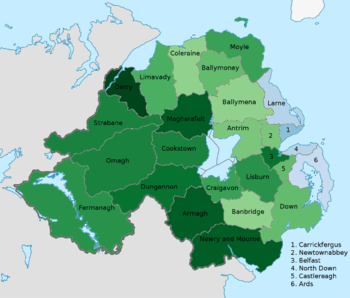
| Ages attained (years) | British | Irish | Northern Irish | English, Scottish or Welsh | All other |
|---|---|---|---|---|---|
| 0 to 15 | 45.1% | 31.4% | 30.5% | 0.9% | 3.6% |
| 16 to 24 | 44.2% | 32.3% | 29.6% | 1.5% | 3.3% |
| 25 to 34 | 40.5% | 31.0% | 30.0% | 1.7% | 8.6% |
| 35 to 44 | 47.3% | 28.7% | 29.3% | 2.1% | 4.5% |
| 45 to 54 | 50.8% | 28.3% | 28.0% | 1.9% | 2.2% |
| 55 to 64 | 54.5% | 24.9% | 28.8% | 1.9% | 1.1% |
| 65 to 74 | 57.5% | 21.3% | 29.8% | 1.7% | 0.4% |
| 75 to 84 | 58.6% | 19.6% | 29.1% | 1.6% | 0.3% |
| 85 and over | 61.7% | 18.0% | 26.5% | 2.0% | 0.2% |
National identity and constitutional preference
Like the relationship between religion and national identity, the relationship between national identity and constitutional preference—whether Northern Ireland should stay part of the United Kingdom or become part of a united Ireland state—presents a strong correlation, but not an absolute one. In 2016 an Ipsos Mori poll asked "If there was a referendum on the border would you:" and responses sorted by national identity were as follows:[27]
| National Identity | British only | Irish only | Northern Irish only | Other |
|---|---|---|---|---|
| Vote to stay in the United Kingdom | 86% | 31% | 62% | 61% |
| Northern Ireland to be joined with the Republic of Ireland outside of the United Kingdom | 4% | 56% | 18% | 13% |
| Don't know | 7% | 12% | 18% | 21% |
| Would not vote | 3% | 1% | 2% | 5% |
A 1997 publication by Democratic Dialogue financed by the Central Community Relations Unit of the Northern Ireland Office stated, "It is clear that many in Northern Ireland are willing to tolerate the Other's cultural identity only within the confines of their own core ideology... most nationalists have extreme difficulty in accepting unionists' Britishness or, even if they do, the idea that unionists do not constitute an Irish ethnic minority which can ultimately be accommodated within the Irish nation." Discussion may be hindered by the lack of definitions which command cross-community support. For example, with regard to "Irishness," the 1997 publication stated that "Irishness is a highly contested identity, subject to fundamentally different nationalist and unionist perceptions which profoundly affect notions of allegiance and group membership."[28]
Four polls taken between 1989 and 1994 revealed that when asked to state their national identity, over 79% of Northern Ireland Protestants replied "British" or "Ulster" with 3% or less replying "Irish", while over 60% of Northern Irish Catholics replied "Irish" with 13% or less replying "British" or "Ulster."[29]
Many people in Northern Ireland consider themselves both British and Irish, or hold some other combination of identities, as can be seen in the annual results of the Northern Ireland Life and Times Survey. In 1999, for example, the survey found that 91% of Roman Catholics and 48% of Protestants thought of themselves as strongly or weakly Irish.[30] At the same time, 55% of people who declared themselves to be neither Protestant nor Catholic (and this would have included people of Protestant or Roman Catholic backgrounds as well as people of other faiths, none and immigrants) thought of themselves as strongly or weakly Irish.
| Catholic | Protestant | No religion | ALL | |
|---|---|---|---|---|
| Strongly or weakly | 36% | 96% | 83% | 70% |
| Not at all | 62% | 4% | 15% | 28% |
| Don't know | 2% | 1% | 2% | 2% |
| Catholic | Protestant | No religion | ALL | |
|---|---|---|---|---|
| Strongly or weakly | 91% | 48% | 55% | 65% |
| Not at all | 9% | 51% | 43% | 33% |
| Don't know | 1% | 2% | 2% | 2% |
| Catholic | Protestant | No religion | ALL | |
|---|---|---|---|---|
| Strongly or weakly | 38% | 83% | 61% | 63% |
| Not at all | 61% | 16% | 35% | 36% |
| Don't know | 1% | 1% | 4% | 2% |
| Catholic | Protestant | No religion | ALL | |
|---|---|---|---|---|
| Strongly or weakly | 72% | 85% | 78% | 78% |
| Not at all | 28% | 15% | 20% | 21% |
| Don't know | 1% | 1% | 2% | 1% |
Note: percentages may not total 100 due to rounding.
See also
- Demography of Northern Ireland
- Demography of the United Kingdom
- List of Acts of the Parliament of Northern Ireland
- List of political parties in Northern Ireland
- List of Statutory Rules and Orders of Northern Ireland
- Royal Commission on the Constitution (United Kingdom)
- Segregation in Northern Ireland
- A Shared Future
References
- Due to the abstentionist nature of Sinn Féin MPs, the fact that the Church of Ireland was disestablished in 1871, meaning the church no longer sends representatives to the House of Lords (unlike the Church of England, which continues to send two archbishops and 24 bishops, known as Lords Spiritual), as well as the fact that bishops of the Roman Catholic Church are not represented, this has resulted in most Northern Ireland members of House of Lords (such as Eileen Paisley and David Trimble — see List of Northern Ireland Members of the House of Lords) coming from Unionist backgrounds by default. In July 2009 Nuala O'Loan, who is married to the SDLP MLA Declan O'Loan, was appointed by Gordon Brown to this legislative body. The late Gerry Fitt, the first leader of the nationalist SDLP, sat from 1983 until 2005.
- 01/08/2005 – 14:17:53. "Sinn Féin hails Dáil speaking rights plan | BreakingNews.ie". Breaking.tcm.ie. Retrieved 16 March 2010.CS1 maint: numeric names: authors list (link)
- The haunting. "Adams, stay out of our House — National News, Frontpage — Independent.ie". Unison.ie. Retrieved 28 October 2008.
- The haunting. "How Adams got it wrong on speaking in the Dáil — Analysis — Independent.ie". Unison.ie. Retrieved 28 October 2008.
- "BBC NEWS | UK | Northern Ireland | MPs attend Dáil joint committee". News.bbc.co.uk. Retrieved 28 October 2008.
- Beyond the Sectarian Divide: the Social Bases and Political Consequences of Nationalist and Unionist Party Competition in Northern Ireland by Geoffrey Evans and Mary Duffy. In British Journal of Political Science, Vol. 27, No. 1. (Jan. 1997), esp. p.72–76
- "BBC NEWS | UK | Northern Ireland | Fianna Fáil accepted as NI party". News.bbc.co.uk. Retrieved 28 October 2008.
- "BBC NEWS | UK | Northern Ireland | Fianna Fáil 'will organise in NI'". News.bbc.co.uk. Retrieved 28 October 2008.
- "CAIN Web Service". Retrieved 23 July 2014.
- "Future Catholic Majority". Retrieved 26 December 2012.
- "CAIN: Religion in Northern Ireland". Cain.ulst.ac.uk. Retrieved 26 December 2012.
- "Northern Ireland Assembly, Migration in Northern Ireland : an update" (PDF). Retrieved 23 July 2014.
- "Northern Ireland Neighbourhood Information Service". Retrieved 23 July 2014.
- "Northern Ireland Neighbourhood Information Service". Retrieved 23 July 2014.
- "NISRA: Northern Ireland Statistics and Research Agency Census 2011" (PDF). Retrieved 24 January 2013.
- "Northern Ireland Neighbourhood Information Service". Retrieved 22 July 2014.
- "Northern Ireland Neighbourhood Information Service". Retrieved 22 July 2014.
- "Key Statistics to Output Area Level". NISRA: Northern Ireland Statistics and Research Agency Census 2001. Retrieved 24 January 2013.
- "2018 Survey opinion question on long-term policy for Northern Ireland". Northern Ireland Life & Times. 2018. Retrieved 22 June 2019.
- "Northern Ireland Life and Times". Retrieved 23 July 2014.
- "PROJECT BORDER, page 8" (PDF). Ipsos Mori. 9 September 2016. Retrieved 29 June 2017.
- "PROJECT BORDER, page 6" (PDF). Ipsos Mori. 9 September 2016. Retrieved 29 June 2017.
- "Northern Ireland Neighbourhood Information Service". Retrieved 23 July 2014.
- "Northern Ireland Neighbourhood Information Service". Retrieved 22 July 2014.
- "Northern Ireland Neighbourhood Information Service". Retrieved 22 July 2014.
- "Northern Ireland Neighbourhood Information Service". Retrieved 23 July 2014.
- "PROJECT BORDER, page 9" (PDF). Ipsos Mori. 9 September 2016. Retrieved 29 June 2017.
- Report by Democratic Dialogue Archived 11 October 2006 at the Wayback Machine
- Breen, R., Devine, P. and Dowds, L. (editors), 1996. "Social Attitudes in Northern Ireland: The Fifth Report" ISBN 0-86281-593-2. Chapter 2 retrieved from http://cain.ulst.ac.uk/othelem/research/nisas/rep5c2.htm on 24 August 2006.
- How strongly to you feel yourself to be Irish? Northern Ireland Life & Times Survey, 1999

