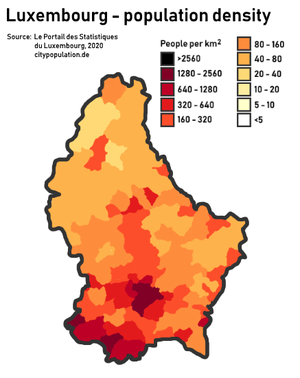
Demographics of Luxembourg
This article is about the demographic features of the population of Luxembourg, including population density, education level, health of the populace, economic status, religious affiliations and other aspects of the population.
| Year | Pop. | ±% |
|---|---|---|
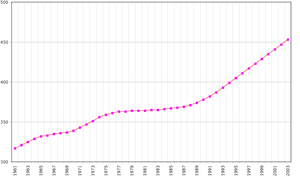
| 1821 | 134,082 | — |
| 1839 | 175,223 | +30.7% |
| 1851 | 194,719 | +11.1% |
| 1861 | 197,731 | +1.5% |
| 1871 | 204,028 | +3.2% |
| 1880 | 210,507 | +3.2% |
| 1890 | 211,481 | +0.5% |
| 1900 | 234,674 | +11.0% |
| 1910 | 259,027 | +10.4% |
| 1922 | 261,643 | +1.0% |
| 1930 | 299,782 | +14.6% |
| 1947 | 290,992 | −2.9% |
| 1960 | 314,889 | +8.2% |
| 1970 | 339,841 | +7.9% |
| 1981 | 364,302 | +7.2% |
| 1991 | 384,634 | +5.6% |
| 2001 | 439,539 | +14.3% |
| 2011 | 512,353 | +16.6% |
| 2020 | 626,108 | +22.2% |
| Source:[1] 2020 data[2] | ||
The following is an overview of the demographics of Luxembourg. Demographic topics include basic statistics, most populous cities, and religious affiliation.
The population of Luxembourg as of 1 January 2020 was 626,108 (52.5% Luxembourgers and 47.4% of foreign nationality).[3]
The people of Luxembourg are called Luxembourgers.[4]
Vital statistics since 1900
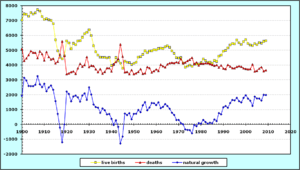
The following table chronicles factors such as population, birth rates, and death rates in Luxembourg since 1900.[5]
| Average population | Live births | Deaths | Natural change | Crude birth rate (per 1000) | Crude death rate (per 1000) | Natural change (per 1000) | Fertility rates | |
|---|---|---|---|---|---|---|---|---|
| 1900 | 234,000 | 7,037 | 5,109 | 1,928 | 30.1 | 21.9 | 8.2 | |
| 1901 | 236,000 | 7,444 | 4,300 | 3,144 | 31.5 | 18.2 | 13.3 | |
| 1902 | 238,000 | 7,416 | 4,460 | 2,956 | 31.1 | 18.7 | 12.4 | |
| 1903 | 241,000 | 7,279 | 4,686 | 2,593 | 30.3 | 19.5 | 10.8 | |
| 1904 | 243,000 | 7,535 | 4,952 | 2,583 | 31.0 | 20.4 | 10.6 | |
| 1905 | 245,000 | 7,431 | 4,851 | 2,580 | 30.3 | 19.8 | 10.5 | |
| 1906 | 248,000 | 7,516 | 4,844 | 2,672 | 30.3 | 19.6 | 10.8 | |
| 1907 | 250,000 | 7,738 | 4,482 | 3,256 | 30.9 | 17.9 | 13.0 | |
| 1908 | 253,000 | 7,639 | 4,933 | 2,706 | 30.2 | 19.5 | 10.7 | |
| 1909 | 256,000 | 7,264 | 4,752 | 2,512 | 28.4 | 18.6 | 9.8 | |
| 1910 | 258,000 | 7,065 | 4,321 | 2,744 | 27.4 | 16.7 | 10.6 | |
| 1911 | 260,000 | 7,126 | 4,892 | 2,234 | 27.4 | 18.8 | 8.6 | |
| 1912 | 262,000 | 7,051 | 4,556 | 2,495 | 26.9 | 17.4 | 9.5 | |
| 1913 | 264,000 | 7,009 | 4,383 | 2,626 | 26.5 | 16.6 | 9.9 | |
| 1914 | 266,000 | 6,781 | 4,446 | 2,335 | 25.5 | 16.7 | 8.8 | |
| 1915 | 265,000 | 5,701 | 4,126 | 1,575 | 21.5 | 15.6 | 5.9 | |
| 1916 | 264,000 | 4,958 | 4,246 | 712 | 18.8 | 16.1 | 2.7 | |
| 1917 | 263,000 | 4,516 | 4,730 | -214 | 17.1 | 18.0 | -0.8 | |
| 1918 | 263,000 | 4,413 | 5,611 | -1,198 | 16.8 | 21.4 | -4.6 | |
| 1919 | 262,000 | 4,638 | 4,627 | 11 | 17.7 | 17.7 | 0.0 | |
| 1920 | 261,000 | 5,621 | 3,404 | 2,217 | 21.6 | 13.1 | 8.5 | |
| 1921 | 261,000 | 5,494 | 3,444 | 2,050 | 21.1 | 13.2 | 7.9 | |
| 1922 | 262,000 | 5,094 | 3,538 | 1,556 | 19.5 | 13.5 | 5.9 | |
| 1923 | 263,000 | 5,468 | 3,581 | 1,887 | 20.8 | 13.6 | 7.2 | |
| 1924 | 266,000 | 5,369 | 3,421 | 1,948 | 20.2 | 12.9 | 7.3 | |
| 1925 | 268,000 | 5,619 | 3,791 | 1,828 | 21.0 | 14.1 | 6.8 | |
| 1926 | 270,000 | 5,639 | 4,100 | 1,539 | 20.9 | 15.2 | 5.7 | |
| 1927 | 278,000 | 5,864 | 3,909 | 1,955 | 21.1 | 14.1 | 7.0 | |
| 1928 | 287,000 | 6,114 | 4,017 | 2,097 | 21.3 | 14.0 | 7.3 | |
| 1929 | 292,000 | 6,210 | 4,553 | 1,657 | 21.3 | 15.6 | 5.7 | |
| 1930 | 297,000 | 6,377 | 3,876 | 2,501 | 21.4 | 13.0 | 8.4 | |
| 1931 | 300,000 | 5,988 | 3,971 | 2,017 | 20.0 | 13.3 | 6.7 | |
| 1932 | 299,000 | 5,295 | 3,949 | 1,346 | 17.7 | 13.2 | 4.5 | |
| 1933 | 298,000 | 4,895 | 3,725 | 1,170 | 16.4 | 12.5 | 3.9 | |
| 1934 | 298,000 | 4,665 | 3,535 | 1,130 | 15.7 | 11.9 | 3.8 | |
| 1935 | 297,000 | 4,523 | 3,740 | 783 | 15.2 | 12.6 | 2.6 | |
| 1936 | 298,000 | 4,514 | 3,433 | 1,081 | 15.2 | 11.5 | 3.6 | |
| 1937 | 299,000 | 4,514 | 3,555 | 959 | 15.1 | 11.9 | 3.2 | |
| 1938 | 301,000 | 4,486 | 3,811 | 675 | 14.9 | 12.7 | 2.2 | |
| 1939 | 300,000 | 4,511 | 3,804 | 707 | 15.0 | 12.7 | 2.4 | |
| 1940 | 296,000 | 3,959 | 3,580 | 379 | 13.4 | 12.1 | 1.3 | |
| 1941 | 292,000 | 4,029 | 4,065 | -36 | 13.8 | 13.9 | -0.1 | |
| 1942 | 290,000 | 4,506 | 4,220 | 286 | 15.6 | 14.6 | 1.0 | |
| 1943 | 289,000 | 4,277 | 4,437 | -160 | 14.8 | 15.4 | -0.6 | |
| 1944 | 285,000 | 4,128 | 5,406 | -1,278 | 14.5 | 18.9 | -4.5 | |
| 1945 | 284,000 | 3,775 | 4,585 | -810 | 13.3 | 16.2 | -2.9 | |
| 1946 | 286,000 | 4,263 | 3,525 | 738 | 14.9 | 12.3 | 2.6 | |
| 1947 | 289,000 | 4,178 | 3,548 | 630 | 14.5 | 12.3 | 2.2 | |
| 1948 | 292,000 | 4,162 | 3,400 | 762 | 14.3 | 11.6 | 2.6 | |
| 1949 | 294,000 | 4,026 | 3,676 | 350 | 13.7 | 12.5 | 1.2 | |
| 1950 | 296,000 | 4,116 | 3,401 | 715 | 13.9 | 11.5 | 2.4 | |
| 1951 | 297,000 | 4,176 | 3,456 | 720 | 14.0 | 11.6 | 2.4 | |
| 1952 | 299,000 | 4,535 | 3,557 | 978 | 15.2 | 11.9 | 3.3 | |
| 1953 | 301,000 | 4,565 | 3,737 | 828 | 15.2 | 12.4 | 2.7 | |
| 1954 | 303,000 | 4,713 | 3,421 | 1,292 | 15.6 | 11.3 | 4.3 | |
| 1955 | 305,000 | 4,962 | 3,453 | 1,509 | 16.3 | 11.3 | 5.0 | |
| 1956 | 307,000 | 4,833 | 3,878 | 955 | 15.8 | 12.6 | 3.1 | 2.08 |
| 1957 | 309,000 | 4,954 | 3,811 | 1,143 | 16.1 | 12.4 | 3.7 | 2.13 |
| 1958 | 310,000 | 4,959 | 3,512 | 1,447 | 16.0 | 11.3 | 4.7 | 2.13 |
| 1959 | 312,000 | 5,037 | 3,607 | 1,430 | 16.1 | 11.6 | 4.6 | 2.16 |
| 1960 | 314,000 | 5,019 | 3,716 | 1,303 | 16.0 | 11.8 | 4.1 | 2.37 |
| 1961 | 317,000 | 5,112 | 3,616 | 1,496 | 16.1 | 11.4 | 4.7 | 2.42 |
| 1962 | 321,000 | 5,137 | 4,037 | 1,100 | 16.0 | 12.6 | 3.4 | 2.41 |
| 1963 | 324,000 | 5,112 | 3,929 | 1,183 | 15.8 | 12.1 | 3.7 | 2.37 |
| 1964 | 328,000 | 5,229 | 3,857 | 1,372 | 16.0 | 11.8 | 4.2 | 2.40 |
| 1965 | 332,000 | 5,297 | 4,057 | 1,240 | 16.0 | 12.2 | 3.7 | 2.39 |
| 1966 | 334,000 | 5,194 | 4,133 | 1,061 | 15.6 | 12.4 | 3.2 | 2.36 |
| 1967 | 335,000 | 4,957 | 4,166 | 791 | 14.8 | 12.4 | 2.4 | 2.25 |
| 1968 | 336,000 | 4,780 | 4,138 | 642 | 14.2 | 12.3 | 1.9 | 2.14 |
| 1969 | 338,000 | 4,503 | 4,202 | 301 | 13.3 | 12.5 | 0.9 | 2.03 |
| 1970 | 339,000 | 4,476 | 4,168 | 308 | 13.2 | 12.3 | 0.9 | 1.97 |
| 1971 | 342,000 | 4,512 | 4,416 | 96 | 13.2 | 12.9 | 0.3 | 1.96 |
| 1972 | 347,000 | 4,138 | 4,120 | 18 | 11.9 | 11.9 | 0.1 | 1.75 |
| 1973 | 351,000 | 3,847 | 4,184 | -337 | 11.0 | 11.9 | -1.0 | 1.58 |
| 1974 | 355,000 | 3,925 | 4,291 | -366 | 11.1 | 12.1 | -1.0 | 1.57 |
| 1975 | 359,000 | 3,997 | 4,376 | -379 | 11.1 | 12.2 | -1.1 | 1.55 |
| 1976 | 361,000 | 3,915 | 4,507 | -592 | 10.8 | 12.5 | -1.6 | 1.48 |
| 1977 | 362,000 | 4,053 | 4,083 | -30 | 11.2 | 11.3 | -0.1 | 1.49 |
| 1978 | 362,000 | 4,072 | 4,187 | -115 | 11.2 | 11.6 | -0.3 | 1.47 |
| 1979 | 363,000 | 4,078 | 3,985 | 93 | 11.2 | 11.0 | 0.3 | 1.47 |
| 1980 | 364,000 | 4,169 | 4,113 | 56 | 11.4 | 11.3 | 0.2 | 1.50 |
| 1981 | 365,000 | 4,414 | 4,105 | 309 | 12.1 | 11.2 | 0.8 | 1.55 |
| 1982 | 366,000 | 4,300 | 4,133 | 167 | 11.8 | 11.3 | 0.5 | 1.49 |
| 1983 | 366,000 | 4,185 | 4,129 | 56 | 11.4 | 11.3 | 0.2 | 1.44 |
| 1984 | 366,000 | 4,192 | 4,072 | 120 | 11.5 | 11.1 | 0.3 | 1.42 |
| 1985 | 367,000 | 4,104 | 4,027 | 77 | 11.2 | 11.0 | 0.2 | 1.38 |
| 1986 | 368,000 | 4,309 | 3,970 | 339 | 11.7 | 10.8 | 0.9 | 1.44 |
| 1987 | 371,000 | 4,238 | 4,012 | 226 | 11.4 | 10.8 | 0.6 | 1.39 |
| 1988 | 374,000 | 4,603 | 3,840 | 763 | 12.3 | 10.3 | 2.0 | 1.51 |
| 1989 | 378,000 | 4,665 | 3,984 | 681 | 12.4 | 10.6 | 1.8 | 1.52 |
| 1990 | 382,000 | 4,936 | 3,773 | 1,163 | 12.9 | 9.9 | 3.0 | 1.62 |
| 1991 | 387,000 | 4,986 | 3,744 | 1,242 | 12.9 | 9.7 | 3.2 | 1.60 |
| 1992 | 392,000 | 5,149 | 4,022 | 1,127 | 13.1 | 10.3 | 2.9 | 1.67 |
| 1993 | 397,000 | 5,353 | 3,915 | 1,438 | 13.5 | 9.8 | 3.6 | 1.69 |
| 1994 | 403,000 | 5,451 | 3,800 | 1,651 | 13.5 | 9.4 | 4.1 | 1.72 |
| 1995 | 409,000 | 5,421 | 3,797 | 1,624 | 13.3 | 9.3 | 4.0 | 1.67 |
| 1996 | 414,000 | 5,689 | 3,895 | 1,794 | 13.7 | 9.4 | 4.3 | 1.76 |
| 1997 | 419,000 | 5,503 | 3,937 | 1,566 | 13.1 | 9.4 | 3.7 | 1.71 |
| 1998 | 425,000 | 5,386 | 3,901 | 1,485 | 12.7 | 9.2 | 3.5 | 1.67 |
| 1999 | 430,000 | 5,582 | 3,793 | 1,789 | 13.0 | 8.8 | 4.2 | 1.71 |
| 2000 | 436,000 | 5,723 | 3,754 | 1,969 | 13.1 | 8.6 | 4.5 | 1.78 |
| 2001 | 442,000 | 5,459 | 3,719 | 1,740 | 12.4 | 8.4 | 3.9 | 1.66 |
| 2002 | 446,000 | 5,345 | 3,744 | 1,601 | 12.0 | 8.4 | 3.6 | 1.63 |
| 2003 | 452,000 | 5,303 | 4,053 | 1,250 | 11.7 | 9.0 | 2.8 | 1.62 |
| 2004 | 458,000 | 5,452 | 3,578 | 1,874 | 11.9 | 7.8 | 4.1 | 1.66 |
| 2005 | 465,000 | 5,371 | 3,621 | 1,750 | 11.5 | 7.8 | 3.8 | 1.62 |
| 2006 | 473,000 | 5,514 | 3,766 | 1,748 | 11.7 | 8.0 | 3.7 | 1.64 |
| 2007 | 480,000 | 5,477 | 3,866 | 1,611 | 11.4 | 8.1 | 3.4 | 1.61 |
| 2008 | 489,000 | 5,596 | 3,595 | 2,001 | 11.5 | 7.4 | 4.1 | 1.60 |
| 2009 | 498,000 | 5,638 | 3,657 | 1,982 | 11.3 | 7.3 | 4.0 | 1.59 |
| 2010 | 507,000 | 5,874 | 3,760 | 2,114 | 11.6 | 7.4 | 4.2 | 1.63 |
| 2011 | 518,000 | 5,639 | 3,819 | 1,820 | 10.9 | 7.4 | 3.5 | 1.51 |
| 2012 | 531,000 | 6,026 | 3,876 | 2,150 | 11.4 | 7.3 | 4.1 | 1.57 |
| 2013 | 543,000 | 6,115 | 3,822 | 2,293 | 11.2 | 7.0 | 4.2 | 1.55 |
| 2014 | 556,000 | 6,070 | 3,841 | 2,229 | 10.9 | 6.9 | 4.0 | 1.50 |
| 2015 | 576,000 | 6,115 | 3,983 | 2,132 | 10.9 | 7.0 | 3.9 | 1.47 |
| 2016 | 590,000 | 6,050 | 3,967 | 2,083 | 10.4 | 6.8 | 3.6 | 1.40 |
| 2017 | 602,000 | 6,174 | 4,263 | 1,911 | 10.4 | 7.1 | 3.3 | 1.39 |
| 2018 | 608,000 | 6,274 | 4,318 | 1,956 | 10.3 | 7.1 | 3.2 | 1.38 |
| 2019 | 620,000 | 6,230 | 4,283 | 1,947 | 10.0 | 6.9 | 3.1 | 1.34 |
Life expectancy
| Period | Life expectancy in
Years |
Period | Life expectancy in
Years |
|---|---|---|---|
| 1950–1955 | 66.0 | 1985–1990 | 74.5 |
| 1955–1960 | 67.6 | 1990–1995 | 75.8 |
| 1960–1965 | 69.1 | 1995–2000 | 77.0 |
| 1965–1970 | 69.8 | 2000–2005 | 78.3 |
| 1970–1975 | 70.2 | 2005–2010 | 79.5 |
| 1975–1980 | 71.5 | 2010–2015 | 81.2 |
| 1980–1985 | 72.9 |
Source: UN World Population Prospects[6]
Population in Luxembourg
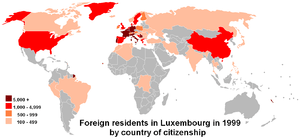
The foreign population resident in Luxembourg currently numbers over 296,465, corresponding to 47.4% of the total population (compared to 13.2% in 1961).[3] That means there are currently almost as many immigrants as there are native citizens. These immigrants are overwhelmingly[7] nationals of EU countries (accounting for over 80%), by far the greater part of whom originally come from Portugal, Italy and the two neighbouring countries, France and Belgium. For some years, there has also been a large increase in the number of immigrants and asylum seekers from the countries of Eastern Europe, and especially the new republics to have emerged from the former Yugoslavia (Bosnia and Herzegovina, Serbia and Montenegro). These immigrants include a considerable proportion of young people. Immigrants (especially asylum seekers) have a strong impact on the birth rate, accounting for nearly 50% of births in Luxembourg.
A more detailed breakdown by nationality[7] shows that the Portuguese community is still the largest group, accounting for almost a third of the foreign population. The Italian population has been stable for the past ten years at approximately 20,000. Some 80,000 foreigners come from bordering countries (France, Belgium and Germany).
As of 2020 the population of Russian nationals in Luxembourg is 1,857.[7] Luxembourg Russian Saturday school, Kalinka, serves students ages 3–12 and includes Russian language and cultural classes. In 2014, there were 160 students and 22 teachers in the school.[8]
The Japanese Supplementary School in Luxembourg (ルクセンブルグ補習授業校 Rukusenburugu Hoshū Jugyō Kō) is a Japanese supplementary school operated in the country,[9] serving students ages 6–15. It is held at the International School Luxembourg and as of 2014 has about 60 students. Its operations at the ISL began in 1991.[8]
| Nationality [7] | ||
|---|---|---|
| 1 | 329,643 | |
| 2 | 95,057 | |
| 3 | 47,805 | |
| 4 | 22,996 | |
| 5 | 19,823 | |
| 6 | 12,849 | |
| 7 | 7,202 | |
| 8 | 5,724 | |
| 9 | 5,317 | |
| 10 | 4,844 | |
| 11 | 4,168 | |
| 12 | 3,925 | |
| 13 | 3,673 | |
| 14 | 3,163 | |
| 15 | 2,804 | |
| 16 | 2,572 | |
| 17 | 2,449 | |
| 18 | 2,334 | |
| 19 | 2,266 | |
| 20 | 2,027 | |
| - | Other | 42,840 |
Religious affiliation
The predominant religion of the Luxembourg population is Roman Catholic, with Protestant, Anglican, Jewish, Muslim and Hindu minorities. According to a 1979 law, the government forbids collection of data on religious practices, but over 90% is estimated to be baptized Catholic (the Virgin Mary is the Patroness of the city of Luxembourg).
The Lutherans are the largest Protestant denomination in the country. Muslims are estimated to number approximately 6000 persons, notably including 1,500 refugees from Montenegro; Orthodox (Albanian, Greek, Serbian, Russian, and Romanian) adherents are estimated to number approximately 5,000 persons, along with approximately 1,000 Jews. Freedom of religion is provided by the Luxembourg Constitution.[10]
CIA World Factbook demographic statistics
The following demographic statistics are from the CIA World Factbook, unless otherwise indicated.
Age structure
(2002 est.)
- 0–14 years: 18.9% (male 43,634; female 41,164)
- 15–64 years: 67% (male 151,364; female 149,156)
- 65 years and over: 14.1% (male 25,486; female 37,765)
Immigration|Net migration rate
24.64 migrant(s)/1,000 population (2007 est.)
Sex ratio
(2002 est.)
- at birth: 1.07 male(s)/female
- under 15 years: 1.06 male(s)/female
- 15–64 years: 1.01 male(s)/female
- 65 years and over: 0.67 male(s)/female
- total population: 0.97 male(s)/female
Infant mortality rate
4.68 deaths/1,000 live births (2007 est.)
Life expectancy at birth
(2007 est.)
- total population: 79.03 years
- male: 75.76 years
- female: 82.52 years
Total fertility rate
1.7 children born/woman (2002 est.)
HIV/AIDS
- HIV/AIDS adult prevalence rate: 0.16% (1999 est.)
- HIV/AIDS deaths: fewer than 100 (1999 est.)
Languages
A plethora of languages are spoken in Luxembourg, but the three primary languages are Luxembourgish (national and administrative language), German (administrative language), and French (administrative language).
The following table lists the percentage of citizens of Luxembourg who are able to speak a native language, or two or more languages.[11]
| Luxembourgish | French | German | English | other | |
|---|---|---|---|---|---|
| Native language | 77% | 6% | 4% | 1% | 12% |
| Second language | 13% | 90% | 88% | 60% | N/A |
| Combined | 90% | 96% | 92% | 61% | N/A |
Additionally, people born in foreign countries and temporary guest workers make up more than a third (40%) of the population of Luxembourg. Although most of these foreign born people primarily speak German and French, a significant minority also are native Portuguese, Italian, and English.[12]
References
- "Population totale 1821 - 2016". Le portail des statistiques. Grand-Duché de Luxembourg. Retrieved 18 June 2017.
- "Population" (PDF). Updated 19-04-2018
- "Evolution of total, luxembourgish and foreign population 1961 - 2020". Le portail des statistiques. Retrieved 2020-04-09.
- "Luxembourg Presidency - Being a Luxembourger". www.eu2005.lu.
- "Statistiques // Luxembourg".
- "World Population Prospects – Population Division – United Nations". Retrieved 2017-07-15.
- "Population by nationalities in detail 2011 - 2020". statistiques.public.lu. Statistics portal of the Grand-Duchy of Luxembourg. April 1, 2020. Retrieved 2020-04-08.
- "How expatriate children stay in touch with their cultural roots - supplementary schools in Luxembourg" (Archive). Luxemburger Wort. Monday 10 March 2014. Retrieved on 14 February 2015.
- "欧州の補習授業校一覧(平成25年4月15日現在)" (Archive). Ministry of Education, Culture, Sports, Science and Technology (MEXT). Retrieved on May 10, 2014.
- "WIPOLex". wipolex.wipo.int. Retrieved 2019-02-05.
- "Europeans and their languages". http://ec.europa.eu/public_opinion/archives/ebs/ebs_243_en.pdf Eurobarometer. Retrieved May 10th, 2014. Published February 2006.
- "Info" (PDF). statistiques.public.lu.
