Demographics of Taiwan
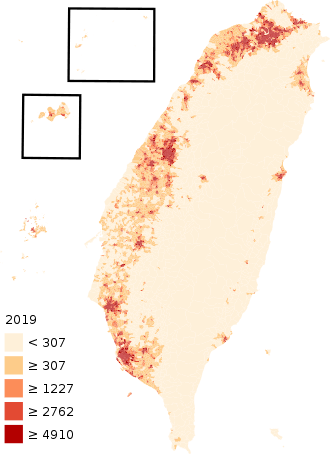
The population of Taiwan, officially known as the Republic of China, is approximately 23.57 million,[1] spread across a total land area of about 36,000 km2; it is the seventeenth most densely populated country in the world, with a population density of about 651 inhabitants per square kilometer.
The original population of the island of Taiwan and its associated islands, i.e. not including Kinmen and the Matsu Islands, consists of a variety of Taiwanese indigenous peoples, who speak several Formosan languages. They have been found to share languages with the Austronesian family and mitochondrial DNA contribution with island peoples of Southeast Asia and the Pacific.[2]
Immigration of Han Chinese to the Penghu islands started as early as the 13th century, while settlement of the main island occurred from the 16th century. It was stimulated by Dutch traders importing workers from Fujian in the 17th century. According to governmental statistics, in the early 21st century, more than 95% of the Republic of China's population are Han Chinese of East Asian ethnicity, while 2.3% are Taiwanese aborigines of Austronesian ethnicity.[3][4] 85% of Taiwanese have some level of aboriginal ancestry.[5] Half the population are followers of one or a mixture of 25 recognized religions. Around 93% of the religious population are followers of a mixture of Buddhism, Taoism, and Confucianism, while a minority 4.5% are followers of Christianity (including both Catholics and Protestants).
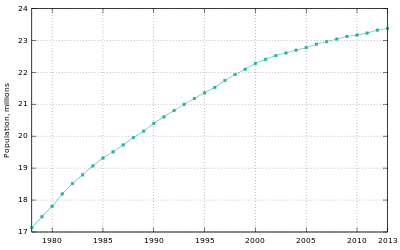
During the 20th century, the population of Taiwan rose more than sevenfold, from about 3 million in 1905 to more than 22 million by 2001. This high growth was caused by a combination of factors, such as very high fertility rates up to the 1960s, and low mortality rates. In addition, there was a surge in population as the Chinese Civil War ended and the Kuomintang (KMT) forces retreated, bringing an influx of 1.2 to 2 million soldiers and civilians to Taiwan in 1948–1949.[6][4] Consequently, the natural growth rate after that was very rapid, especially in the late 1940s and 1950s, with an effective annual growth rate as high as 3.68% during 1951–1956. Including the Kuomintang forces, which accounted in 1950 for about 25% of all persons in Taiwan, immigration of mainland Chinese (who now constitute approximately 10% of the present population[7]) at the end of the 1940s was a major factor in the high population growth of Taiwan.[8]
Fertility rates decreased gradually thereafter; in 1984 the rate reached the replacement level (2.1 children per woman, which is needed to replace the existing population). Fertility rates have continued to decline. In 2010 Taiwan had a population growth of less than 0.2% and a fertility rate of only 0.9, the lowest rate ever recorded in that country. The population of Taiwan is projected to peak at about 23.7 million in 2024 and decrease thereafter.[9]
The official national language is Standard Chinese. Around 70% of the people also speak Taiwanese Hokkien and 10% speak Hakka. Japanese speakers are becoming rare as the elderly generation who lived under Japanese rule are dying out, but many young Taiwanese use English or Japanese as a second language. The Formosan languages are gradually becoming extinct as the indigenous peoples have become acculturated. The government has a program to preserve the languages and has recognized sixteen distinct groups as indigenous peoples.
Population
According to May 2006 statistics from the Ministry of the Interior, the population of Taiwan was 22,805,547, 99.6% of whom live on the island of Taiwan. The remaining 0.4% (82,618) live on offshore islands (Penghu, Lanyu, Green, Kinmen, and Matsu).
Taiwan is ranked the 50th most populous nation in the world.
Historical
The number of Chinese people living on the island in 1624, prior to Dutch colonial rule, was about 25,000.[10] During Dutch Formosa rule, between 1624 and 1662, the Dutch began to encourage large-scale Han immigration to the island for labour, mainly from the south of Fujian.
It is estimated that prior to the Kingdom of Tungning (1661), the population of Taiwan was no greater than 100,000 people, and the initial Zheng army with families and retainers that settled in Taiwan is estimated to be 30,000 at minimum.[11] By 1682, there were only 7,000 Chinese left in Taiwan as they had intermarried with aboriginal women and had property in Taiwan. During Qing rule (1683–1895), the population of Han Chinese in Taiwan grew rapidly from 100,000 to ≈2.5 million, while the aboriginal population was estimated to be at least 200,000 by 1895.[12] (The plains aboriginal population is estimated to have decreased by 90% over the hundred years from 1800 to 1900.[13]
The Japanese Colonial Government performed detailed censuses every five years starting in 1905. Statistics showed a population growth rate of about 1% to 3% per year throughout Japanese rule. In 1905, the population of Taiwan was roughly 3 million; by 1940, the population had grown to 5.87 million, and by the end of World War II in 1946 it numbered 6.09 million.
Population census
| Year | Males (thousands) | Females (thousands) | Total population (thousands) | Average annual growth rate (%) |
|---|---|---|---|---|
| 1905 | 1,611 | 1,429 | 3,040 | |
| 1915 | 1,813 | 1,669 | 3,480 | 1.4 |
| 1920 | 1,894 | 1,762 | 3,655 | 1.0 |
| 1925 | 2,053 | 1,941 | 3,993 | 1.8 |
| 1930 | 2,459 | 2,239 | 4,593 | 2.8 |
| 1935 | 2,660 | 2,553 | 5,212 | 2.6 |
| 1940 | 2,971 | 2,901 | 5,872 | 2.4 |
| 1956 | 4,772 | 4,596 | 9,368 | 3.0 |
| 1966 | 7,153 | 6,352 | 13,505 | 3.7 |
| 1970 (sampling) | 7,723 | 7,047 | 14,770 | 2.3 |
| 1975 (sampling) | 8,439 | 7,840 | 16,279 | 2.0 |
| 1980 | 9,405 | 8,624 | 18,030 | 2.1 |
| 1990 | 10,618 | 9,775 | 20,394 | 1.2 |
| 2000 | 11,386 | 10,915 | 22,301 | 0.9 |
| 2010 | 23,052 | 0.4 |
| Year | 1981 | 1982 | 1983 | 1984 | 1985 | 1986 | 1987 | 1988 | 1989 | 1990 |
|---|---|---|---|---|---|---|---|---|---|---|
| Population | 18,193,955 | 18,515,754 | 18,790,538 | 19,069,194 | 19,313,825 | 19,509,082 | 19,725,010 | 19,954,397 | 20,156,587 | 20,401,305 |
| ±% | — | + 1.768% | + 1.484% | + 1.483% | + 1.283% | + 1.011% | + 1.107% | + 1.163% | + 1.013% | + 1.214% |
| Year | 1991 | 1992 | 1993 | 1994 | 1995 | 1996 | 1997 | 1998 | 1999 | 2000 |
| Population | 20,605,831 | 20,802,622 | 20,995,416 | 21,177,874 | 21,357,431 | 21,525,433 | 21,742,815 | 21,928,591 | 22,092,387 | 22,276,672 |
| ±% | + 1.003% | + 0.955% | + 0.927% | + 0.869% | + 0.848% | + 0.787% | + 1.010% | + 0.854% | + 0.747% | + 0.834% |
| Year | 2001 | 2002 | 2003 | 2004 | 2005 | 2006 | 2007 | 2008 | 2009 | 2010 |
| Population | 22,405,568 | 22,520,776 | 22,604,550 | 22,689,122 | 22,770,383 | 22,876,527 | 22,958,360 | 23,037,031 | 23,119,772 | 23,162,123 |
| ±% | + 0.579% | + 0.514% | + 0.372% | + 0.374% | + 0.358% | + 0.466% | + 0.358% | + 0.343% | + 0.359% | + 0.183% |
| Year | 2011 | 2012 | 2013 | 2014 | 2015 | 2016 | 2017 | 2018 | 2019 | 2020 |
| Population | 23,224,912 | 23,315,822 | 23,373,517 | 23,433,753 | 23,492,074 | 23,539,816 | 23,571,227 | 23,588,932 | 23,603,121 | |
| ±% | + 0.271% | + 0.391% | + 0.247% | + 0.258% | + 0.249% | + 0.203% | + 0.133% | + 0.075% | + 0.060% |
Statistics since 1997
| Population | Live births | Deaths | Natural change | Social change | Crude birth rate(‰) | Crude death rate(‰) | Natural change(‰) | Social change(‰) | Total growth rate(‰) | Total fertility rate | |
|---|---|---|---|---|---|---|---|---|---|---|---|
| 1997 | 21,742,815 | 326,002 | 121,000 | 205,002 | 12,380 | 15.07 | 5.59 | 9.48 | 0.57 | 10.05 | 1.77 |
| 1998 | 21,928,591 | 271,450 | 123,180 | 148,270 | 37,506 | 12.43 | 5.64 | 6.79 | 1.72 | 8.51 | 1.47 |
| 1999 | 22,092,387 | 283,661 | 126,113 | 157,548 | 6,248 | 12.89 | 5.73 | 7.16 | 0.28 | 7.44 | 1.56 |
| 2000 | 22,276,672 | 305,312 | 125,958 | 179,354 | 4,931 | 13.76 | 5.68 | 8.08 | 0.22 | 8.31 | 1.68 |
| 2001 | 22,405,568 | 260,354 | 127,647 | 132,707 | -3,811 | 11.65 | 5.71 | 5.94 | -0.17 | 5.77 | 1.40 |
| 2002 | 22,520,776 | 247,530 | 128,636 | 118,894 | -3,686 | 11.02 | 5.73 | 5.29 | -0.16 | 5.13 | 1.34 |
| 2003 | 22,604,550 | 227,070 | 130,801 | 96,269 | -12,495 | 10.06 | 5.8 | 4.27 | -0.55 | 3.71 | 1.24 |
| 2004 | 22,689,122 | 216,419 | 135,092 | 81,327 | 3,245 | 9.56 | 5.97 | 3.59 | 0.14 | 3.73 | 1.18 |
| 2005 | 22,770,383 | 205,854 | 139,398 | 66,456 | 14,805 | 9.06 | 6.13 | 2.92 | 0.65 | 3.58 | 1.12 |
| 2006 | 22,876,527 | 204,459 | 135,839 | 68,620 | 37,524 | 8.96 | 5.95 | 3.01 | 1.64 | 4.65 | 1.12 |
| 2007 | 22,958,360 | 204,414 | 141,111 | 63,303 | 18,530 | 8.92 | 6.16 | 2.76 | 0.81 | 3.57 | 1.10 |
| 2008 | 23,037,031 | 198,733 | 143,624 | 55,109 | 23,562 | 8.64 | 6.25 | 2.4 | 1.02 | 3.42 | 1.05 |
| 2009 | 23,119,772 | 191,310 | 143,582 | 47,728 | 35,013 | 8.29 | 6.22 | 2.07 | 1.52 | 3.59 | 1.03 |
| 2010 | 23,162,123 | 166,886 | 145,772 | 21,114 | 21,237 | 7.21 | 6.3 | 0.91 | 0.92 | 1.83 | 0.895 |
| 2011 | 23,224,912 | 196,627 | 152,915 | 43,712 | 19,077 | 8.48 | 6.59 | 1.88 | 0.82 | 2.71 | 1.07 |
| 2012 | 23,315,822 | 229,481 | 154,251 | 75,230 | 15,680 | 9.86 | 6.63 | 3.23 | 0.67 | 3.91 | 1.27 |
| 2013 | 23,373,517 | 199,113 | 155,908 | 43,205 | 14,490 | 8.53 | 6.68 | 1.85 | 0.62 | 2.47 | 1.07 |
| 2014 | 23,433,753 | 210,383 | 163,929 | 46,454 | 13,782 | 8.99 | 7 | 1.98 | 0.59 | 2.57 | 1.17 |
| 2015 | 23,492,074 | 213,598 | 163,858 | 49,740 | 8,581 | 9.1 | 6.98 | 2.12 | 0.37 | 2.49 | 1.18 |
| 2016 | 23,539,816 | 208,440 | 172,405 | 36,035 | 11,707 | 8.86 | 7.33 | 1.53 | 0.5 | 2.03 | 1.17 |
| 2017 | 23,571,227 | 193,844 | 171,242 | 22,602 | 8,809 | 8.23 | 7.27 | 0.96 | 0.37 | 1.33 | 1.13 |
| 2018 | 23,588,932 | 181,601 | 172,784 | 8,817 | 8,888 | 7.7 | 7.33 | 0.37 | 0.38 | 0.75 | 1.06 |
| 2019 | 23,603,121 | 177,767 | 176,296 | 1,471 | 12,718 | 7.53 | 7.47 | 0.06 | 0.54 | 0.6 | 1.05 |
Details
- Date:2019/07-08
| County City | Area (km²) | Population | Margin | Density (people/km²) | Sort |
|---|---|---|---|---|---|
| New Taipei | 2052.5667 | 4,010,657 | +2843 | 1,954 | 1(8) |
| Taichung | 2214.8968 | 2,811,729 | +581 | 1,270 | 2(8) |
| Kaohsiung | 2951.8524 | 2,773,786 | +195 | 939 | 3(8) |
| Taipei | 271.7997 | 2,650,154 | -3854 | 9,765 | 4(8) |
| Taoyuan | 1220.9540 | 2,240,328 | +2385 | 1,833 | 5(8) |
| Tainan | 2191.6531 | 1,881,730 | -66 | 859 | 6(8) |
| Changhua County | 1074.3960 | 1,273,613 | -661 | 1,186 | 7(8) |
| Pingtung | 2775.6003 | 820,798 | -398 | 296 | 8(8) |
| Yunlin | 1290.8326 | 682,577 | -335 | 529 | 9(8) |
| Hsinchu County | 1427.5369 | 561,766 | +1047 | 393 | 10(8) |
| Miaoli | 1820.3149 | 546,461 | -37 | 300 | 11 |
| Chiayi | 1903.6367 | 504,750 | -347 | 265 | 12(8) |
| Nantou | 4106.4360 | 495,084 | -22 | 121 | 13 |
| Yilan | 2143.6251 | 454,636 | -57 | 212 | 14 |
| Hsinchu City | 104.1526 | 447,781 | +297 | 4296 | 15(8) |
| Keelung | 132.7589 | 369,305 | -55 | 2782 | 16 |
| Hualien | 4628.5714 | 326,780 | -33 | 69 | 17(8) |
| Chiayi City | 60.0256 | 268,068 | -163 | 4469 | 18 |
| Taitung County | 3515.2526 | 217,540 | -296 | 62 | 19 |
| Kinmen County | 151.6560 | 139,319 | -46 | 918 | 20 |
| Penghu County | 126.8641 | 104,711 | +3 | 825 | 21 |
| Lianjiang County | 28.8000 | 13,073 | +11 | 455 | 22(8) |
| Taiwan with its outlying islands | 36,197.0669 | 23,593,794 | +1196 | 651 | -(8) |
Net migration rate
During 2004 - 2010, Taiwan's migration rate was positive. On average, the annual net migration amounted to 22,000 people during that period, which is equivalent to a rate of 1.0 per 1,000 inhabitants per year.
Age structure
| Age range | 1980 | census 1990 | census 2000 | 2010 | 2015 |
|---|---|---|---|---|---|
| 0–14 years | 32.1% | 26.9% | 21.2% | 15.65% | 13.6% |
| 15–64 years | 63.6% | 67.0% | 70.2% | 73.61% | 73.9% |
| 65 years and over | 4.3% | 6.1% | 8.6% | 10.74% | 12.5% |
Sex ratio
- under 15 years: 1.06 male(s)/female
- 15-24 years: 1.05 male(s)/female
- 25-54 years: 1.00 male(s)/female
- 55-64 years: 0.96 male(s)/female
- 65 years and over: 0.84 male(s)/female
- total population: 0.98 male(s)/female (2018 est)
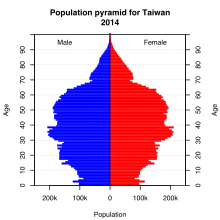
Population growth and age structure
Demographic transition models (DTM) show how population pyramids change and go through specific stages. By looking at Taiwan’s population pyramid, the country is in stage 4 of the DTM and its shape contracts but it will soon enter stage 5.[16] In stage 5 of the DTM, death rate gradually exceeds fertility rate and a country starts to experience overall population loss.[17] Access to good medical care increases the lifespan of a population. Knowledge of and access to contraception, along with an increase in women's participation in the workforce, cause a sharp decline in the fertility rate.[17]
National statistics of Taiwan in 2018 indicate that there are approximately 140,000 more females than males. The birth rate (8.3 births/1,000 population) is slightly higher than the death rate (7.4 deaths/1,000 population).[18] The total dependency ratio in Taiwan is 35.2%, which is relatively low.[19] The low dependency ratio indicates that the dependent part of the population is less than half of the working part. Expert estimate the dependency ratio will rise to 92.9% by 2060.[20] A rising dependency ratio and longer life expectancy will most likely require the government to support part of the elderly population as the working-age population is shrinking and thus less able to support the elderly directly.
Demographic transition and population aging
The process of population aging is primarily determined by fertility and mortality rate.[21] The proportions of elderly people are different across countries. For example, developing countries with limited access to healthcare and contraceptives, where populations have a high fertility rate, tend to have a lower proportion of older people.[22] Medical advancements, industrial developments, and better knowledge of sanitation, which started in the 18th century in many developed countries, have caused a decline in mortality rates and an increase in fertility rates, factors which raise the number of older people worldwide.[23] According to the United Nations, many developed countries are in more advanced stages (4 or 5) of the demographic transition model and their number of elderly will remain high compared to less developed countries.[24] This phenomenon is known as population aging.
According to the World Health Organization (WHO), since 1993, Taiwan has reached the threshold of an aging society. It was estimated the percentage of people over 65 was 8%.[25] The Council for Economic Planning and Development (CEPD) has estimated that Taiwan will become an aged society as early as 2017.[26] The CEPD estimated that the percentage of people 65 years or older will be over 20% in 2025, which means Taiwan will soon become a "super aged society".[26] The critical factors that accelerate the speed of aging in Taiwan are high life expectancy and low fertility rate. The average life expectancy in 2014 was 80 years. The total fertility rate in 2014 was 1.1 (per 1,000 women) and dropped to 0.9 in 2017.[27]
Ethnicity
The ROC government reports that 95 to 97 percent of Taiwan's population is of the Han Chinese ethnicity, which includes Hoklo, Hakka, and other ethnic groups originating from mainland China.[28][29] Over 2% of the population consists of indigenous Taiwanese.[4] 21,000 Westerners live in Taiwan, accounting for 0,1% of its total population.[30] Most Taiwanese have a mix of Han and indigenous ancestry with 85% of Taiwanese having some indigenous ancestry.[5]
Indigenous Taiwanese
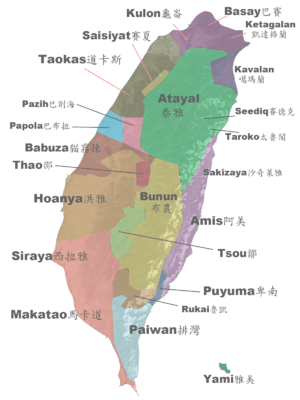
The total population of recognized indigenous people in Taiwan is approximately 533,600, or approximately 2.28% of Taiwan's population.[31] These groups primarily inhabit the eastern half of Taiwan, which consists mostly of mountainous terrain. Their population growth rate (1.2%) and population pyramid are considerably more youthful than the overall population.[32] Including migrant workers, the Austronesian population of Taiwan is approaching 1 million.[33]
| Place | Male | Female | Total | Percentage |
|---|---|---|---|---|
| Living in the Eastern plains | 111,372 | 109,141 | 220,513 | 47.1% |
| Living in the mountains | 122,016 | 126,073 | 248,089 | 52.9% |
| Total | 233,388 | 235,214 | 468,602 | 100% |
- Note: Source data obtained from the Ministry of the Interior website (Spreadsheet data: m1-04.xls)
The Taiwanese government officially recognizes sixteen (16) ethnic groups of Taiwanese indigenous peoples (Chinese: 原住民; pinyin: yuánzhùmín; Pe̍h-ōe-jī: Gôan-chū-bîn).[34] In the early 1910s, research in the Japanese era recognized nine (9) ethnic groups: Amis, Atayal, Bunun, Paiwan, Puyuma, Rukai, Saisiyat, Tsou, and Yami. After the 2000s, indigenous cultural revitalization movements forced the government to change its attitude towards the indigenous people of Taiwan. The Yami people were renamed to Tao. New ethnic groups were also recognized by the government, including Thao in 2001, Kavalan in 2002, Truku (Taroko) in 2004, Sakizaya in 2007, Seediq in 2008, Kanakanavu in 2014, and Saaroa in 2014. There are at least another dozen groups that are not officially recognized by the government.
| Name | Formosan native name | Chinese | Population at census 2000[35] | Population (02/2016)[36] | Notes |
|---|---|---|---|---|---|
| Amis | Pangcah, 'Amis | 阿美族 | 148,992 | 203,740 | Recognized since Japanese era. Amis name means "north" |
| Atayal | Tayal, Tayan | 泰雅族 | 91,883 | 87,156 | Recognized since Japanese era. Atayal name means "brave person" |
| Bunun | Bunun | 布農族 | 41,038 | 56,844 | Recognized since Japanese era. |
| Kanakanavu | Kanakanavu | 卡那卡那富族 | — | 267 | Classified as Tsou, recognized since 2014 |
| Kavalan | Kebalan, Kbaran | 噶瑪蘭族 | — | 1,416 | Some Kavalan were classified as Amis, recognized since 2002 |
| Paiwan | Payuan | 排灣族 | 70,331 | 97,788 | Recognized since Japanese era. |
| Puyuma | Pinuyumayan | 卑南族 | 9,606 | 13,651 | Recognized since Japanese era. |
| Rukai | Drekay | 魯凱族 | 12,084 | 12,996 | Recognized since Japanese era. |
| Saaroa | Hla'alua | 拉阿魯哇族 | — | 294 | Classified as Tsou, recognized since 2014 |
| Saisiyat | Say-Siyat | 賽夏族 | 5,311 | 6,495 | Recognized since Japanese era. |
| Sakizaya | Sakizaya | 撒奇萊雅族 | — | 863 | Classified as Amis, recognized since 2007 |
| Seediq | Seediq | 賽德克族 | — | 9,451 | Classified as Atayal, recognized since 2008 |
| Taroko | Truku | 太魯閣族 | — | 30,382 | Classified as Atayal, recognized since 2004 |
| Thao | Thao, Ngan | 邵族 | — | 768 | Classified as Tsou, recognized since 2001 |
| Tsou | Cou | 鄒族 | 6,169 | 6,647 | Recognized since Japanese era. |
| Yami | Tao | 達悟族、雅美族 | 3,872 | 4,494 | Recognized since Japanese era. Yami name means "person" |
| Unspecified | 尚未申報 | 8,249 | 14,206 | ||
| Total | 397,535 | 547,465 | |||
Unrecognized indigenous groups may include extinct tribes (mostly Plains indigenous peoples) or communities currently classified with other groups. There are also 25,943 indigenous people who are currently not classified in any group.
| Name | Formosan native name |
Chinese | Notes |
|---|---|---|---|
| Arikun | Arikun | 阿立昆族 | Sometimes classified as Hoanya |
| Babuza | Babuza, Poavasa | 貓霧拺族 | |
| Basay | Basay, Basai | 巴賽族、馬塞族 | Sometimes classified as Ketagalan |
| Hoanya | Hoanya | 洪雅族、和安雅族 | Sometimes split into Lloa and Arikun |
| Kaxabu | Kaxabu, Kahapu | 噶哈巫族 | Sometimes classified as Pazeh. In revitalization. |
| Ketagalan | Ketagalan | 凱達格蘭族 | |
| Kulon | Kulon | 龜崙族 | |
| Lloa | Lloa | 羅亞族 | Sometimes classified Hoanya |
| Luilang | Luilang | 雷朗族 | Sometimes classified as Ketagalan |
| Makatao | Makatao, Tao | 馬卡道族 | Sometimes classified as Siraya. Recognized in Pingtung. In revitalization. |
| Papora | Papora, Vupuran | 拍瀑拉族、巴布拉族 | |
| Pazeh | Pazéh, Pazih | 巴宰族、巴則海族 | In revitalization. |
| Qauqaut | Qauqaut | 猴猴族 | |
| Siraya | Siraya | 西拉雅族、希萊耶族 | Recognized in Tainan and Fuli. In revitalization. |
| Taivoan | Taivoan, Taivuan | 大武壠族 | Sometimes classified as Siraya. Recognized in Fuli. In revitalization. |
| Taokas | Taokas | 道卡斯族 | In revitalization. |
Han Taiwanese
The majority of Han Chinese descend from immigrants who arrived to the island prior to Japanese rule (1895–1945) and can be classified as the Hoklo and Hakka, on the basis of language and customs.[37] As the majority of early immigrants were Hokkien speakers from Fujian[38] who arrived starting in the 17th century, the Hoklos account for about 70% of the total population today. During Qing rule, a large number of Hoklo men took indigenous brides.[6] Some of the plains aboriginals also adopted Chinese customs and language so as to be indistinguishable from the Han.[39] Thus, many who categorize themselves as Han have some degree of indigenous ancestry.
A significant minority of Han Chinese are Hakka, and they constitute about 15% of the total population. The Hakkas emigrated chiefly from eastern Guangdong, speak Hakka Chinese, and originally took up residence in the hills of the indigenous border districts.[40][6]
About 14% of the total population are mainland Chinese,[4] which refers to immigrants who followed the ROC relocation from mainland China to Taiwan in 1949;[6] some were of other ethnicities.
Foreign residents
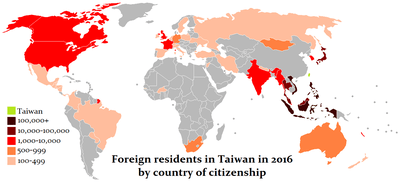
| Nationality / Origin | Total | ||
|---|---|---|---|
| 1 | 255,770 | 33.1% | |
| 2 | 224,108 | 29.0% | |
| 3 | 152,179 | 19.7% | |
| 4 | 64,381 | 8.34% | |
| 5 | 20,549 | 2.66% | |
| 6 | 13,768 | 1.78% | |
| 7 | 9,979 | 1.29% | |
| 8 | 4,481 | 0.58% | |
| 9 | 3,748 | 0.49% | |
| 10 | 2,167 | 0.28% | |
| 11 | 2,097 | 0.27% | |
| 12 | 1,671 | 0.22% | |
| 13 | 1,553 | 0.20% | |
| 14 | 1,456 | 0.19% | |
| 15 | 1,207 | 0.16% | |
| 16 | 1,126 | 0.15% | |
| 17 | 965 | 0.12% | |
| 18 | 838 | 0.11% | |
| 19 | 578 | 0.07% | |
| 20 | 489 | 0.06% | |
| 21 | 390 | 0.05% | |
| 22 | 363 | 0.05% | |
| 23 | 346 | 0.04% | |
| 24 | 313 | 0.04% | |
| 25 | 307 | 0.04% | |
| 26 | 288 | 0.04% | |
| 27 | 279 | 0.04% | |
| 28 | 245 | 0.03% | |
| 29 | 217 | 0.03% | |
| 29 | 217 | 0.03% | |
| 30 | 198 | 0.03% | |
| 31 | 196 | 0.03% | |
| 32 | 186 | 0.02% | |
| 33 | 183 | 0.02% | |
| 34 | 181 | 0.02% | |
| 34 | 181 | 0.02% | |
| 35 | 176 | 0.02% | |
| 36 | 168 | 0.02% | |
| 37 | 165 | 0.02% | |
| 38 | 164 | 0.02% | |
| 39 | 159 | 0.02% | |
| 40 | 148 | 0.02% | |
| 41 | 147 | 0.02% | |
| 42 | 138 | 0.02% | |
| 43 | 125 | 0.02% | |
| 43 | 125 | 0.02% | |
| 44 | 122 | 0.02% | |
| 45 | 118 | 0.02% | |
| 46 | 117 | 0.02% | |
| 47 | 106 | ||
| 48 | 105 | ||
| 49 | 104 | ||
| 50 | 102 | ||
| 51 | 101 | ||
| 52 | 95 | ||
| 53 | 88 | ||
| 53 | 88 | ||
| 54 | 87 | ||
| 55 | 85 | ||
| 55 | 85 | ||
| 56 | 83 | ||
| 57 | 81 | ||
| 58 | 80 | ||
| 59 | 79 | ||
| 60 | 73 | ||
| 61 | 65 | ||
| 61 | 65 | ||
| 62 | 62 | ||
| 63 | 60 | ||
| 64 | 57 | ||
| 65 | 48 | ||
| 65 | 48 | ||
| 66 | 45 | ||
| 67 | 43 | ||
| 67 | 43 | ||
| 68 | 42 | ||
| 69 | 41 | ||
| 69 | 41 | ||
| 70 | 39 | ||
| 71 | 38 | ||
| 72 | 37 | ||
| 73 | 32 | ||
| 74 | 31 | ||
| 75 | 30 | ||
| 75 | 30 | ||
| 76 | 28 | ||
| 76 | 28 | ||
| 77 | 27 | ||
| 78 | 26 | ||
| 79 | 25 | ||
| 80 | 24 | ||
| 81 | 23 | ||
| 81 | 23 | ||
| 81 | 23 | ||
| 82 | 22 | ||
| 83 | 21 | ||
| 83 | 21 | ||
| 83 | 21 | ||
| 83 | 19 | ||
| 84 | 18 | ||
| 85 | 17 | ||
| 85 | 17 | ||
| 85 | 17 | ||
| 85 | 17 | ||
| 86 | 15 | ||
| 86 | 15 | ||
| 87 | 14 | ||
| 88 | 13 | ||
| 88 | 13 | ||
| 89 | 11 | ||
| 89 | 11 | ||
| 89 | 11 | ||
| 90 | 10 | ||
| 91 | 9 | ||
| 91 | 9 | ||
| 91 | 9 | ||
| 91 | 9 | ||
| 91 | 9 | ||
| 92 | 8 | ||
| 92 | 8 | ||
| 93 | 7 | ||
| 93 | 7 | ||
| 93 | 7 | ||
| 94 | 6 | ||
| 94 | 6 | ||
| 94 | 6 | ||
| 94 | 6 | ||
| 94 | 6 | ||
| 94 | 6 | ||
| 94 | 6 | ||
| 94 | 6 | ||
| 95 | 5 | ||
| 95 | 5 | ||
| 95 | 5 | ||
| 96 | 4 | ||
| 96 | 4 | ||
| 96 | 4 | ||
| 96 | 4 | ||
| 96 | 4 | ||
| 96 | 4 | ||
| 96 | 4 | ||
| 96 | 4 | ||
| 97 | 3 | ||
| 97 | 3 | ||
| 97 | 3 | ||
| 97 | 3 | ||
| 97 | 3 | ||
| 97 | 3 | ||
| 97 | 3 | ||
| 98 | 2 | ||
| 98 | 2 | ||
| 98 | 2 | ||
| 98 | 2 | ||
| 98 | 2 | ||
| 98 | 2 | ||
| 98 | 2 | ||
| 98 | 2 | ||
| 98 | 2 | ||
| 99 | 1 | ||
| 99 | 1 | ||
| 99 | 1 | ||
| 99 | 1 | ||
| 99 | 1 | ||
| 99 | 1 | ||
| 99 | 1 | ||
| 99 | 1 | ||
| 99 | 1 | ||
| 99 | 1 | ||
| 99 | 1 | ||
| 99 | 1 | ||
| - | Other (stateless) | 103 | <0.02% |
| Total | 772,281 | 100.0% | |
| |||
Languages
During Japanese rule (between 1895-1945), Japanese was the medium of instruction and could be fluently spoken by many of those educated during that period. Almost everyone in Taiwan born after the early 1950s can speak Standard Chinese, which has been the official language and the medium of instruction in schools for more than four decades. Note that the Chinese spoken in Taiwan (called Taiwanese Mandarin) has minor differences from that spoken in mainland China (called Putonghua). For Chinese spoken in other regions, see Language and overseas Chinese communities.
Hanyu Pinyin, the official romanization system in mainland China, has also been the standard of Taiwan since 2009. A number of romanization systems are still seen in Taiwan, including Tongyong, the official romanization in Taiwan between 2002 and 2008, Wade–Giles, often found on passports, and Postal.
Other varieties of Chinese can also be seen in Taiwan. The majority speak Taiwanese Hokkien, a branch of Southern Min, which had formerly been the most commonly spoken language. On Matsu Islands, the Fuzhou dialect belonging to the Eastern Min is prevalent. Although people on Kinmen (Quemoy) also speak Southern Min, it is not the case in the Wuqiu Islands, for they speak a dialect of the Pu-Xian Min. The ethnic Hakka speak various Taiwanese Hakka dialects including Sixian, Hailu, Dabu, Raoping, and Zhao'an.
The most widely spoken Formosan languages today are Amis, Atayal, Bunun, and Paiwan. The other aboriginal languages that have gained official recognition are Kanakanabu, Kavalan, Puyuma, Rukai, Hla’alua, Saisiyat, Sakizaya, Seediq (closely related to Truku), Thao, Tsou, and Yami (also known as Tao).
Yue Chinese is spoken by recent immigrants from southeastern China, Hong Kong, and Macau, although their numbers remain very small.[42] Furthermore, Taiwan was one of the largest consumers of Hong Kong cinema, cantopop, and pop culture in the late 1900s. As a result, some Taiwanese may choose to learn it as a second or third language.
| Division | Population | Mandarin | Taiwanese | Hakka | Indigenous | Others |
|---|---|---|---|---|---|---|
| Total | 21,407,235 | 83.5 | 81.9 | 6.6 | 1.4 | 2 |
| New Taipei City | 3,779,575 | 92 | 82.9 | 2.4 | 0.9 | 2.4 |
| Taipei | 2,475,422, | 93.2 | 73.5 | 3.5 | 0.5 | 3.2 |
| Keelung | 358,927 | 87.2 | 91.1 | 0.9 | 1.8 | 1.8 |
| Hsinchu | 427,792 | 92 | 70.7 | 11.1 | 0.8 | 1.6 |
| Yilan | 393,109 | 78.2 | 94.9 | 0.6 | 1.8 | 1 |
| Taoyuan | 1,982,734 | 93.4 | 58.2 | 17.1 | 1.3 | 1.3 |
| Hsinchu County | 464,165 | 90.6 | 27.7 | 56 | 2 | 1.1 |
| Taichung | 2,521,926 | 87.1 | 89.9 | 3.5 | 0.6 | 1.4 |
| Miaoli | 482,329 | 79.4 | 45.8 | 52.4 | 1 | 0.5 |
| Changhua | 1,123,439 | 69.5 | 98.1 | 0.3 | 0.2 | 0.9 |
| Nantou | 426,631 | 75.3 | 92 | 3.2 | 4.3 | 1.2 |
| Yunlin | 573,064 | 60 | 98.2 | 1.6 | 0.1 | 1.4 |
| Tainan | 1,719,853 | 71.7 | 95.8 | 0.5 | 0.3 | 2.7 |
| Kaohsiung | 2,596,510 | 78.6 | 90.9 | 3 | 0.7 | 2.4 |
| Chiayi | 250,900 | 76.5 | 94.7 | 0.4 | 0.3 | 1 |
| Chiayi County | 458,244 | 61 | 97.5 | 0.8 | 0.8 | 3.6 |
| Pingtung | 750,122 | 66.2 | 82.3 | 12 | 4.7 | 0.5 |
| Penghu | 80,203 | 75 | 93.6 | 0.5 | 0.3 | 2.4 |
| Taitung | 187,763 | 89.9 | 65.9 | 5.4 | 21.3 | 5.5 |
| Hualien | 287,858 | 90.8 | 60.9 | 10.8 | 16.9 | 1.6 |
| Kinmen | 52,603 | 85.4 | 92.8 | 1.1 | 0.5 | 0.8 |
| Lianjiang | 14,066 | 96.6 | 44.7 | 3.9 | 1.6 | 24.1 |
Religion
Article 13 of the Constitution of the Republic of China guarantees freedom of religion as a right of all its citizens. As of 2013, the Republic of China government recognizes 27 religions which are registered with the Civil Affairs Department of the Ministry of the Interior (MOI).[44]
Statistics on registered religions (2005)
About 81.3% of the population can be considered religious believers, most of whom identify as Buddhists (35%) or Taoists (33%). Chinese folk religion is generally practised under the aegis of Taoism, while more than 10% of the population adheres to popular movements of salvation. Confucianism also is an honored school of thought and ethical codes. Christian churches have been active in Taiwan for centuries; a majority of them are Protestant, with Presbyterians playing a particularly significant role. The Republic of China's government has diplomatic relations with the Holy See, which is the only European nation to formally recognize the Republic of China and is its longest-lasting diplomatic ally, having established relations in 1942. Islam has seen a surge in recent years as a result of foreign Muslims seeking work in Taiwan, most notably from Indonesia. There is also a small group of Shinto followers under the Tenriist sect, which was introduced in the 1970s.
The table below shows official statistics on religion issued by the Department of Civil Affairs, Ministry of the Interior ("MOI"), in 2005. The Taiwanese government recognises 26 religions in Taiwan.[45] The statistics are reported by the various religious organisations to the MOI:[45][46]
| Religion | Members | % of total population | Temples & churches |
|---|---|---|---|
| Buddhism (佛教) (including Tantric Buddhism) | 8,086,000 | 35.1% | 4,006 |
| Taoism (道教) | 7,600,000 | 33.0% | 18,274 |
| Yiguandao (一貫道) | 810,000 | 3.5% | 3,260 |
| Protestantism (基督新教) | 605,000 | 2.6% | 3,609 |
| Roman Catholic Church (羅馬天主教) | 298,000 | 1.3% | 1,151 |
| Lord of Universe Church—Tiandiism (天帝教) | 298,000 | 1.3% | 50 |
| Miledadao (彌勒大道) | 250,000 | 1.1% | 2,200 |
| Holy Church of the Heavenly Virtue—Tiandiism (天德教) | 200,000 | 0.9% | 14 |
| Zailiism/Liism (理教) | 186,000 | 0.8% | 138 |
| Xuanyuanism (軒轅教) | 152,700 | 0.7% | 22 |
| Islam (伊斯蘭教) | 58,000 | 0.3% | 7 |
| Mormonism (耶穌基督後期聖徒教會) | 51,090 | 0.2% | 54 |
| Tenriism (天理教) | 35,000 | 0.2% | 153 |
| Church of Maitreya the King of the Universe (宇宙彌勒皇教) | 35,000 | 0.2% | 12 |
| Haizidao (亥子道) | 30,000 | 0.1% | 55 |
| Church of Scientology (山達基教會) | 20,000 | < 0.1% | 7 |
| Bahá'í Faith (巴哈伊教) | 16,000 | < 0.1% | 13 |
| Jehovah's Witnesses (耶和華見證人) | 9,256 | < 0.1% | 85 |
| True School of the Mysterious Gate (玄門真宗) | 5,000 | < 0.1% | 5 |
| Holy Church of the Middle Flower (中華聖教) | 3,200 | < 0.1% | 7 |
| Mahikari (真光教團) | 1,000 | < 0.1% | 9 |
| Precosmic Salvationism (先天救教) | 1,000 | < 0.1% | 6 |
| Yellow Middle (黃中) | 1,000 | < 0.1% | 1 |
| Dayiism (大易教) | 1,000 | < 0.1% | 1 |
| Total religious population | 18,724,823 | 81.3% | 33,223 |
| Total population | 23,036,087 | 100% | - |
The figures for The Church of Jesus Christ of Latter-day Saints are not from the MOI, rather they are based on self-reported data from LDS Newsroom.[47] The figures for Jehovah's Witnesses are not from the MOI either, they are based on the Witnesses' own 2007 Service Year Report.[48] In the original report, both of them were counted as part of Protestantism.[45]
Vital statistics
Births and deaths
| Average population (x 1000) | Live births | Deaths | Natural change | CBR* | CDR* | NC* | TFR* | |
|---|---|---|---|---|---|---|---|---|
| 1906 | 3,060 | 119,107 | 102,000 | 16,000 | 38.6 | 33.4 | 5.2 | 6.13 |
| 1907 | 3,090 | 121,756 | 100,000 | 21,000 | 39.1 | 32.4 | 6.7 | 6.16 |
| 1908 | 3,120 | 119,800 | 100,000 | 19,000 | 38.2 | 31.9 | 6.3 | 6.14 |
| 1909 | 3,160 | 127,286 | 98,000 | 29,000 | 40.2 | 31.1 | 9.1 | 6.29 |
| 1910 | 3,210 | 132,141 | 88,000 | 45,000 | 41.3 | 27.5 | 13.8 | 6.37 |
| 1911 | 3,270 | 135,658 | 86,000 | 51,000 | 41.8 | 26.2 | 15.6 | 6.42 |
| 1912 | 3,330 | 136,622 | 83,000 | 55,000 | 41.3 | 25.0 | 16.3 | 6.46 |
| 1913 | 3,390 | 136,967 | 85,000 | 53,000 | 40.8 | 25.0 | 15.8 | 6.45 |
| 1914 | 3,440 | 141,450 | 95,000 | 47,000 | 41.4 | 27.6 | 13.8 | 6.62 |
| 1915 | 3,480 | 137,669 | 110,000 | 29,000 | 40.0 | 31.5 | 8.5 | 6.45 |
| 1916 | 3,510 | 128,605 | 100,000 | 31,000 | 37.3 | 28.6 | 8.7 | |
| 1917 | 3 560 | 142,414 | 96,000 | 50,000 | 40.9 | 27.0 | 13.9 | |
| 1918 | 3 590 | 139,465 | 122,000 | 21,000 | 39.7 | 34.1 | 5.6 | |
| 1919 | 3,630 | 136,707 | 97,000 | 43,000 | 38.5 | 26.8 | 11.7 | |
| 1920 | 3,655 | 141,313 | 117,000 | 27,000 | 39.5 | 32.1 | 7.4 | 6.48 |
| 1921 | 3,720 | 155,159 | 90,000 | 69,000 | 42.8 | 24.2 | 18.6 | |
| 1922 | 3,790 | 154,531 | 93,000 | 65,000 | 41.8 | 24.6 | 17.2 | |
| 1923 | 3,860 | 146,984 | 82,000 | 69,000 | 39.1 | 21.3 | 17.8 | |
| 1924 | 3,930 | 158,688 | 96,000 | 67,000 | 41.4 | 24.5 | 16.9 | |
| 1925 | 3,993 | 159,423 | 95,000 | 68,000 | 40.8 | 23.9 | 16.9 | |
| 1926 | 4,100 | 175,802 | 92,000 | 87,000 | 43.7 | 22.4 | 21.3 | |
| 1927 | 4,210 | 177,422 | 93,000 | 89,000 | 43.2 | 22.1 | 21.1 | |
| 1928 | 4,330 | 183,699 | 95,000 | 94,000 | 43.7 | 22.0 | 21.7 | |
| 1929 | 4,460 | 190,031 | 96,000 | 100,000 | 44.0 | 21.6 | 22.4 | |
| 1930 | 4,593 | 198,186 | 89,000 | 117,000 | 44.8 | 19.4 | 25.4 | 7.02 |
| 1931 | 4,710 | 208,137 | 100,000 | 116,000 | 45.8 | 21.3 | 24.5 | |
| 1932 | 4,867 | 204,913 | 99,000 | 115,000 | 44.0 | 20.4 | 23.6 | |
| 1933 | 4,995 | 211,737 | 98,000 | 123,000 | 44.3 | 19.7 | 24.6 | |
| 1934 | 5,128 | 219,189 | 105,166 | 123,510 | 44.6 | 20.5 | 24.1 | |
| 1935 | 5,255 | 225,980 | 106,905 | 129,040 | 44.9 | 20.3 | 24.6 | |
| 1936 | 5,384 | 223,961 | 106,332 | 127,725 | 43.5 | 19.8 | 23.7 | |
| 1937 | 5,530 | 237,090 | 109,096 | 138,570 | 44.8 | 19.7 | 25.1 | |
| 1938 | 5,678 | 235,821 | 111,723 | 133,117 | 43.1 | 19.7 | 23.4 | |
| 1939 | 5,821 | 244,707 | 115,044 | 139,119 | 43.7 | 19.8 | 23.9 | |
| 1940 | 5,987 | 246,691 | 116,239 | 141,232 | 43.0 | 19.4 | 23.6 | 6.11 |
| 1941 | 6,163 | 241,894 | 99,858 | 153,447 | 41.1 | 16.2 | 24.9 | 5.98 |
| 1942 | 6,339 | 242,796 | 112,161 | 143,243 | 40.3 | 17.7 | 22.6 | 5.93 |
| 1943 | 6,507 | 247,427 | 122,001 | 138,662 | 40.0 | 18.8 | 21.2 | |
| 1944 | ||||||||
| 1945 | ||||||||
| 1946 | ||||||||
| 1947 | 6,294 | 241,071 | 114,000 | 127,000 | 38.3 | 18.1 | 20.2 | |
| 1948 | 6,648 | 264,000 | 95,000 | 169,000 | 39.7 | 14.3 | 25.4 | 5.98 |
| 1949 | 7,099 | 300,843 | 93,000 | 208,000 | 42.4 | 13.1 | 29.3 | 6.49 |
| 1950 | 7,468 | 323,643 | 86,000 | 238,000 | 43.4 | 11.5 | 31.9 | 7.14 |
| 1951 | 7,695 | 385,383 | 89,000 | 296,000 | 50.0 | 11.6 | 38.5 | 7.59 |
| 1952 | 8,000 | 372,905 | 79,000 | 294,000 | 46.6 | 9.9 | 36.8 | 7.56 |
| 1953 | 8,297 | 374,536 | 78,000 | 297,000 | 45.2 | 9.4 | 35.8 | 7.54 |
| 1954 | 8,617 | 383,574 | 71,000 | 313,000 | 44.6 | 8.2 | 36.3 | 7.25 |
| 1955 | 8,924 | 403,683 | 77,000 | 327,000 | 45.3 | 8.6 | 36.6 | 7.32 |
| 1956 | 9,242 | 414,036 | 74,000 | 340,000 | 44.8 | 8.0 | 36.8 | 7.27 |
| 1957 | 9,539 | 394,870 | 81,000 | 314,000 | 41.4 | 8.5 | 32.9 | 6.83 |
| 1958 | 9,858 | 410,885 | 75,000 | 336,000 | 41.7 | 7.6 | 34.1 | 6.48 |
| 1959 | 10,227 | 421,458 | 74,000 | 347,000 | 41.2 | 7.2 | 33.9 | 5.98 |
| 1960 | 10,602 | 419,442 | 74,000 | 345,000 | 39.5 | 7.0 | 32.5 | 5.75 |
| 1961 | 10,983 | 420,254 | 74,000 | 346,254 | 38.3 | 6.7 | 31.5 | 5.58 |
| 1962 | 11,312 | 423,469 | 72,000 | 351,469 | 37.4 | 6.4 | 31.1 | 5.46 |
| 1963 | 11,680 | 424,250 | 71,000 | 353,250 | 36.3 | 6.1 | 30.2 | 5.35 |
| 1964 | 12,088 | 416,926 | 69,000 | 347,926 | 34.5 | 5.7 | 28.8 | 5.10 |
| 1965 | 12,442 | 406,604 | 67,887 | 338,717 | 32.7 | 5.5 | 27.2 | 4.82 |
| 1966 | 12,812 | 415,108 | 69,778 | 345,330 | 32.4 | 5.4 | 27.0 | 4.95 |
| 1967 | 13,147 | 374,282 | 71,861 | 302,421 | 28.5 | 5.5 | 23.0 | 4.22 |
| 1968 | 13,474 | 394,260 | 73,650 | 320,610 | 29.3 | 5.5 | 23.8 | 4.36 |
| 1969 | 13,995 | 390,728 | 70,549 | 320,179 | 27.9 | 5.0 | 22.9 | 4.14 |
| 1970 | 14,507 | 394,015 | 71,135 | 322,883 | 27.2 | 4.9 | 22.3 | 4.00 |
| 1971 | 14,837 | 380,424 | 70,954 | 309,470 | 25.6 | 4.8 | 20.9 | 3.70 |
| 1972 | 15,145 | 365,749 | 71,486 | 294,263 | 24.1 | 4.7 | 19.4 | 3.36 |
| 1973 | 15,424 | 366,942 | 73,477 | 293,465 | 23.8 | 4.8 | 19.0 | 3.21 |
| 1974 | 15,699 | 355,933 | 74,760 | 293,063 | 23.4 | 4.8 | 18.7 | 2.94 |
| 1975 | 15,999 | 357,653 | 75,061 | 292,586 | 23.0 | 4.7 | 18.3 | 2.76 |
| 1976 | 16,298 | 424,075 | 77,000 | 347,075 | 26.0 | 4.7 | 21.3 | 3.08 |
| 1977 | 16,601 | 393,633 | 79,000 | 316,796 | 23.7 | 4.8 | 19.1 | 2.64 |
| 1978 | 16,951 | 411,637 | 79,000 | 330,203 | 24.3 | 4.7 | 19.5 | 2.71 |
| 1979 | 17,337 | 421,720 | 82,000 | 340,518 | 24.3 | 4.7 | 19.6 | 2.67 |
| 1980 | 17,608 | 413,881 | 84,333 | 329,548 | 23.5 | 4.8 | 18.7 | 2.51 |
| 1981 | 17,972 | 414,069 | 87,192 | 326,877 | 23.0 | 4.9 | 18.2 | 2.45 |
| 1982 | 18,261 | 405,263 | 87,578 | 317,685 | 22.2 | 4.8 | 17.4 | 2.32 |
| 1983 | 18,538 | 383,439 | 90,951 | 292,488 | 20.7 | 4.9 | 15.8 | 2.17 |
| 1984 | 18,873 | 371,008 | 89,915 | 281,093 | 19.7 | 4.8 | 14.9 | 2.05 |
| 1985 | 19,135 | 346,208 | 92,348 | 253,860 | 18.1 | 4.8 | 13.3 | 1.88 |
| 1986 | 19,356 | 309,230 | 95,057 | 214,173 | 16.0 | 4.9 | 11.1 | 1.68 |
| 1987 | 19,564 | 314,024 | 96,319 | 217,705 | 16.1 | 4.9 | 11.1 | 1.70 |
| 1988 | 19,788 | 342,031 | 102,113 | 239,918 | 17.3 | 5.2 | 12.1 | 1.86 |
| 1989 | 20,004 | 315,299 | 103,288 | 212,011 | 15.8 | 5.2 | 10.6 | 1.68 |
| 1990 | 20,230 | 335,618 | 105,669 | 229,949 | 16.6 | 5.2 | 11.4 | 1.81 |
| 1991 | 20,455 | 321,932 | 106,284 | 215,648 | 15.7 | 5.2 | 10.5 | 1.72 |
| 1992 | 20,655 | 321,632 | 110,516 | 211,116 | 15.6 | 5.4 | 10.2 | 1.73 |
| 1993 | 20,848 | 325,613 | 110,901 | 214,712 | 15.6 | 5.3 | 10.3 | 1.76 |
| 1994 | 21,087 | 322,938 | 113,866 | 209,072 | 15.3 | 5.4 | 9.9 | 1.76 |
| 1995 | 21,268 | 329,581 | 119,112 | 210,469 | 15.5 | 5.6 | 9.9 | 1.78 |
| 1996 | 21,441 | 325,545 | 122,489 | 203,056 | 15.2 | 5.7 | 9.5 | 1.76 |
| 1997 | 21,634 | 326,002 | 121,000 | 205,002 | 15.1 | 5.6 | 9.5 | 1.77 |
| 1998 | 21,836 | 271,450 | 123,180 | 148,270 | 12.4 | 5.6 | 6.8 | 1.47 |
| 1999 | 22,011 | 283,661 | 126,113 | 157,548 | 12.9 | 5.7 | 7.2 | 1.56 |
| 2000 | 22,185 | 305,312 | 125,957 | 179,355 | 13.8 | 5.7 | 8.1 | 1.68 |
| 2001 | 22,342 | 260,354 | 127,647 | 132,707 | 11.7 | 5.7 | 5.9 | 1.40 |
| 2002 | 22,464 | 247,530 | 128,636 | 118,894 | 11.0 | 5.7 | 5.3 | 1.34 |
| 2003 | 22,554 | 227,070 | 130,801 | 96,269 | 10.1 | 5.8 | 4.3 | 1.24 |
| 2004 | 22,647 | 216,419 | 135,092 | 81,327 | 9.6 | 6.0 | 3.6 | 1.18 |
| 2005 | 22,730 | 205,854 | 139,398 | 66,456 | 9.1 | 6.1 | 2.9 | 1.12 |
| 2006 | 22,824 | 204,459 | 135,839 | 68,620 | 9.0 | 6.0 | 3.0 | 1.12 |
| 2007 | 22,918 | 204,414 | 141,111 | 63 303 | 8.9 | 6.2 | 2.8 | 1.10 |
| 2008 | 22,998 | 198,733 | 143,624 | 55,109 | 8.6 | 6.2 | 2.4 | 1.05 |
| 2009 | 23,079 | 191,310 | 143,582 | 47,728 | 8.3 | 6.2 | 2.1 | 1.03 |
| 2010 | 23,141 | 166,886 | 145,772 | 21,114 | 7.2 | 6.3 | 0.9 | 0.90 |
| 2011 | 23,194 | 196,627 | 152,915 | 43,712 | 8.5 | 6.6 | 1.9 | 1.07 |
| 2012 | 23,271 | 229,481 | 154,251 | 75,230 | 9.9 | 6.6 | 3.2 | 1.27 |
| 2013 | 23,345 | 199,113 | 155,908 | 43,205 | 8.5 | 6.7 | 1.8 | 1.07 |
| 2014 | 23,434 | 210,383 | 163,929 | 46,454 | 9.0 | 7.0 | 2.0 | 1.17 |
| 2015 | 23,472 | 213,598 | 163,858 | 49,740 | 9.1 | 7.0 | 2.1 | 1.18 |
| 2016 | 23,540 | 208,440 | 172,405 | 36,035 | 8.8 | 7.3 | 1.5 | 1.17 |
| 2017 | 23,571 | 193,844 | 171,242 | 22,602 | 8.2 | 7.3 | 0.9 | 1.11 |
| 2018 | 23,589 | 181,601 | 172,784 | 8,817 | 7.7 | 7.3 | 0.4 | 1.06 |
| 2019 | 23,603 | 177,767 | 176,296 | 1,471 | 7.5 | 7.5 | 0.0 | 1.05 |
| 1/2020–6/2020[51] | 79,760 | 88,555 | -8,795 | |||||
| * CBR=crude birth rate (per 1000); CDR=crude deathrate (per 1000); NC=natural change (per 1000); TFR=total fertility rate | ||||||||
Fertility rate
The fertility rate[52][53] in Taiwan is one of the lowest ever recorded in the world in historical times. It reached its lowest level in 2010: 0.90 children per female. In 1980, the rate was still well above replacement level (2.515), but it dropped to 1.88 in 1985, 1.81 in 1990, 1.78 in 1995, 1.68 in 2000, 1.12 in 2005.
Infant mortality rate
- total: 6.29 deaths/1,000 live births
- male: 6.97 deaths/1,000 live births
- female: 5.55 deaths/1,000 live births (2006 est.)
Life expectancy at birth
Taiwan is ranked 39th in the world for highest life expectancy at birth.
| Gender | Life expectancy in 2009[54] |
|---|---|
| Male | 75.88 years |
| Female | 82.46 years |
Fertility trend
In developed countries, trends like late marriage, no marriage, and having fewer children are growing. Developed countries tend to have lower fertility rates because access to birth control and contraceptives are easier and having children could become an economic burden caused by housing, education cost, and other costs for childcare.[55] Most women in developed countries are in the workforce and tend to have higher educations and professional careers. As a result, many women tend to have children late in life or no children at all.[56]
According to the BBC, the total fertility rate in Taiwan had decreased to 0.9 children per woman in 2010.[57] This figure is much lower than the replacement level and one of the lowest in the world. This indicates the population is experiencing negative growth and population aging is happening fast.[26] According to a Central News Agency Report, total births in 2017 were below 200,000. Compared to previous decades, the total number of births since 2000 has been between 197,000 and 230,000.[58] If this trend continues, the senior population in Taiwan will be almost 5 times higher than the youth population by 2060.[59]
HIV/AIDS
The first reported case of HIV/AIDS occurred in December 1984 and the first local infection was recorded in February 1986. As of May 2006, there were 11,486 recorded cases of HIV, of which 2,631 were confirmed with AIDS. There were 1,425 deaths, leaving 10,029 people living with HIV/AIDS. This is less than 0.05% of the total population of Taiwan. Statistics by the Center for Disease Control show that the gender distribution of infected persons was 90% male and 10% female.
| Data | Population |
|---|---|
| Adult prevalence | 11,486 |
| People living with HIV/AIDS | 10,029 |
| Deaths | 1,425 |
- Source: Center for Disease Control (CDC), Republic of China - May 2006 est.(PDF file) (in Chinese)
Military manpower
The Republic of China has a compulsory military draft for males aged 19–35 years of age with a service obligation of 12 months (2008).
Available manpower
Defined as 19–49 years of age.
| Gender | Population |
|---|---|
| Male | 5,883,828 |
| Female | 5,680,773 |
| Total | 11,564,601 |
Fit for military service
Of the available manpower, the following are fit for military service. Defined as 19–49 years of age.
| Gender | Population |
|---|---|
| Male | 4,749,537 |
| Female | 4,644,607 |
| Total | 9,394,144 |
Education
Taiwan has a nine-year compulsory education program initiated by the Ministry of Education in 1968. This consists of six years in elementary education and three years in junior high education. About 94.7% of junior high graduates continue their studies in either a senior high or vocational school . Reflecting a strong commitment to education, in FY 2001 16% of the ROC budget was allocated for education . The enrollment rate was 96.77% for the 2004-2005 school year.[60] For the 2005-2006 school year, there were 5,283,855 students in both public and private schools, about a quarter of the entire population. The literacy rate is above 95%.
Since the mid-1990s, the government has introduced several education reforms in a bid to further improve education standards such as the replacement in 2002 of the 48-year-long Joint University Entrance Examination (JUEE; 大學聯考; Dàxué liánkǎo), which had been set up in 1954.
Distribution of students
| Sector | Education | Years of study | Typical Age range | Students | Distribution |
|---|---|---|---|---|---|
| Pre-school | Kindergarten | (2 years) | 4–6 years old | 224,220 | 4.2% |
| Compulsory | Elementary | 6 years | 6–12 years old | 1,831,913 | 34.7% |
| Junior High | 3 years | 12–15 years old | 951,236 | 18% | |
| Senior Secondary | Senior High | 3 years | 15–18 years old | 420,608 | 8% |
| Senior Vocation | 3 years | 15–18 years old | 331,604 | 6.3% | |
| Higher Education | Junior College | 2–5 years | 15–20 years old | 37,068 | 0.7% |
| University & College | 4–7 years (up to 13 years) |
18–25 years old (up to 31 years old) |
1,259,490 | 23.8% | |
| Other | Special School | up to 14 years | 4–18 years old | 6,361 | 0.1% |
| Supplementary School | n/a | n/a | 200,573 | 3.8% | |
| Open University | n/a | n/a | 20,782 | 0.4% | |
| Total | 5,283,855 | 100% |
- Source: Number of students at each level (SY 2005-2006), Ministry of Education, Republic of China.
Literacy
The definition of literacy is those aged 15 and over who can read and write.
| Gender | Population |
|---|---|
| Male | 99.6% |
| Female | 96.8% |
| Total | 98.2% |
"International Comparison of Education Statistical Indicators - 2012 Edition", Ministry of Education, 2012. pp. 17. Retrieved on 2012-10-05. (Table 1-2-5. Literacy Rate for Age 15 Plus by Gender).
2.02 Population of 15 Years and Over by Educational Attainment, Statistical Yearbook of Interior, Ministry of the Interior, Republic of China (Taiwan). 2012. Retrieved on 10-05-2012.
Notes
- The data of database which is since 1997
- One may use more than one language at home. This table refers to the relative frequency of languages used at home to the total of resident nationals.
References
- 108年社會學year=2018. books.google.com. Retrieved 2019-02-12.
台灣人口計23,598,776人
- Trejaut, Jean; Toomas Kivisild; Jun Hun Loo; Chien Liang Lee; Chun Lin He; Chia Jung Hsu; Zheng Yuan Li; Marie Lin (August 2005). "Traces of Archaic Mitochondrial Lineages Persist in Austronesian-Speaking Formosan Populations". PLoS Biology. 3 (8): e247. doi:10.1371/journal.pbio.0030247. PMC 1166350. PMID 15984912.
- Exec. Yuan (2014), p. 36,48.
- "Taiwan". The World Factbook. Central Intelligence Agency., United States Central Intelligence Agency
- Cheung, Han. "Book Review: Charting Taiwan's future through its past". www.taipeitimes.com. Taipei Times. Retrieved 15 July 2020.
- Exec. Yuan (2014), p. 48.
- Population Association of Taiwan (2004)
- Note: Some official government statistics for the period, including those reported on this page, may not be consistent with the known or recorded size of the KMT influx.
- Exec. Yuan (2014), p. 51.
- Davidson (1903), p. 13.
- Lin, A.; Keating, J. (2008). Island in the Stream : a quick case study of Taiwan's complex history (4th ed.). Taipei: SMC Pub. ISBN 9789576387050.
- Davidson (1903), p. 561.
- Davidson (1903), p. 563.
- "人口數三段齡組". 內政部統計處. Retrieved 2017-07-18.
- 內政部. "內政部統計查詢網-土地與人口概況 、出生、死亡、遷移". 內政部統計查詢網. Retrieved 2020-01-18.
- "Taiwan Age structure - Demographics". www.indexmundi.com.
- "Stage 5 of the Demographic Transition Model - Population Education". populationeducation.org. 18 October 2014.
- "National Statistics, Republic of China (Taiwan)". eng.stat.gov.tw.
- "Age dependency ratio (% of working-age population) - Data". data.worldbank.org.
- "Taiwan's demographic crunch and its military implications - AEI". aei.org.
- Wan Ahmad, Wan Ibrahim; Astina, I Komang; Budijanto, Budijanto (1 May 2015). "Demographic Transition and Population Ageing". Mediterranean Journal of Social Sciences. 6 (3): 213–218. doi:10.5901/mjss.2015.v6n3s2p213.

- http://www.un.org/esa/population/publications/worldageing19502050/pdf/8chapteri.pdf
- http://www.un.org/esa/population/publications/bulletin42_43/weinbergermirkin.pdf
- United Nations. 2001a. World populationprospect: The 2000 revision, Volume 1: Comprehensive Tables. New York: United Nations Publications, Sales No. E. 01. XIII.8.
- "WHO - World Health Organization". www.who.int.
- https://www.gtap.agecon.purdue.edu/resources/download/6470.pdf
- Lin, Yi-Yin; Huang, Chin-Shan (19 November 2015). "Aging in Taiwan: Building a Society for Active Aging and Aging in Place". The Gerontologist. 56 (2): 176–183. doi:10.1093/geront/gnv107.
- Exec. Yuan (2014), p. 36.
- "Archived copy" 中華民國國情簡介 [ROC Vital Information]. Executive Yuan. 2016. Archived from the original on 2017-02-18. Retrieved 2019-04-19.
臺灣住民以漢人為最大族群,約占總人口97%
CS1 maint: archived copy as title (link) - https://www.immigration.gov.tw/
- Exec. Yuan (2014), p. 49.
- https://www.taiwannews.com.tw/en/news/3032962
- https://www.taiwannews.com.tw/en/news/3400148
- http://www.chinapost.com.tw/taiwan/national/national-news/2014/06/27/411066/Govt-officially.htm
- Directorate General of Budget, Accounting and Statistics, Executive Yuan, R.O.C. (DGBAS). National Statistics, Republic of China (Taiwan). Preliminary statistical analysis report of 2000 Population and Housing Census Archived March 12, 2007, at the Wayback Machine. Excerpted from Table 28:Indigenous population distribution in Taiwan-Fukien Area. Accessed PM 8/30/06
- Council of Indigenous Peoples (首頁>本會資訊>主動公開資訊>統計資料>原住民人口數統計資料)(Accessed 07 Mar 2016)
- Davidson (1903), p. 590.
- categorized as originating from Xiamen, Quanzhou, Zhangzhou, and Zhangpu. Davidson (1903), p. 591
- Davidson (1903), p. 581.
- Davidson (1903), pp. 590-1.
- "Foreign Residents-by Nationality". National Immigration Agency, Ministry of the Interior. 2018-11-28. Retrieved 2018-12-18.
- "Why are so many Hongkongers moving to Taiwan?". South China Morning Post. Retrieved 2018-09-06.
- 行政院主計處. "6歲以上本國籍常住人口之父母相互溝通使用語言情形" (PDF). 行政院主計處. 99年普查統計結果表. Retrieved 2020-04-19.
- Exec. Yuan (2014), p. 272.
- "Taiwan Yearbook 2006". Taiwan Government Information Office, Department of Civil Affairs, Ministry of the Interior. 2006. Archived from the original on 8 July 2007.
- "2006 Report on International Religious Freedom". U.S. Department of State. 2006. Retrieved 1 September 2007.
- "The Church of Jesus Christ of Latter-day Saints: Taiwan Country Profile".
- "Jehovah's Witnesses: Interactive Map of the Worldwide Work".
- B.R. Mitchell. International historical statistics: Africa, Asia & Oceania 1750-2000.
- "National Statistics, Republic of China (Taiwan) - Yearly Statistics". eng.stat.gov.tw.
- "National Statistics, Republic of China (Taiwan) - Monthly Statistics(off)". eng.stat.gov.tw.
- Nargund, G. (30 May 2018). "Declining birth rate in Developed Countries: A radical policy re-think is required". Facts, Views & Vision in ObGyn. 1 (3): 191–193. PMC 4255510. PMID 25489464.
- https://trends.collegeboard.org/sites/default/files/education-pays-2004-full-report.pdf
- Sui, Cindy (15 August 2011). "Taiwan's birth rate drops further" – via www.bbc.com.
- "Taiwan's birth rate is declining — again". nownews.com. 14 July 2017.
- https://chinapost.nownews.com/20141121-65577
- "Taiwan Yearbook 2005 - Education". Government Information Office, Republic of China. Archived from the original on 2006-12-12.
Bibliography
- Brown, Melissa J (2004). Is Taiwan Chinese? : The Impact of Culture, Power and Migration on Changing Identities. Berkeley: University of California Press. ISBN 0-520-23182-1.CS1 maint: ref=harv (link)
- Davidson, James W. (1903). The Island of Formosa, Past and Present : history, people, resources, and commercial prospects : tea, camphor, sugar, gold, coal, sulphur, economical plants, and other productions. London and New York: Macmillan. OCLC 1887893. OL 6931635M.CS1 maint: ref=harv (link)
- The Republic of China Yearbook 2014 (PDF). Executive Yuan, R.O.C. 2014. ISBN 9789860423020. Retrieved 2016-06-11.
| |||||||||||||
| |||||||||||||
| |||||||||||||
| |||||||||||||
| Sovereign states |
|
|---|---|
| States with limited recognition | |
| Dependencies and other territories |
|
| |