Global warming
The rising average temperature of Earth's climate system, called global warming, is driving changes in rainfall patterns, extreme weather, arrival of seasons, and more. Collectively, global warming and its effects are known as climate change. While there have been prehistoric periods of global warming, observed changes since the mid-20th century have been unprecedented in rate and scale.[1]
The Intergovernmental Panel on Climate Change (IPCC) concluded that "human influence on climate has been the dominant cause of observed warming since the mid-20th century". These findings have been recognized by the national science academies of major nations and are not disputed by any scientific body of national or international standing.[4] The largest human influence has been the emission of greenhouse gases, with over 90% of the impact from carbon dioxide and methane.[5] Fossil fuel burning is the principal source of these gases, with agricultural emissions and deforestation also playing significant roles. Temperature rise is enhanced by self-reinforcing climate feedbacks, such as loss of snow cover, increased water vapour, and melting permafrost.
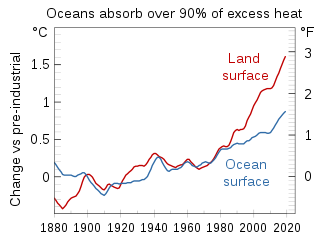
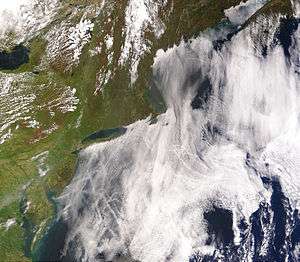
Land surfaces are heating faster than the ocean surface, leading to heat waves, wildfires, and the expansion of deserts.[6] Increasing atmospheric energy and rates of evaporation are causing more intense storms and weather extremes, damaging infrastructure and agriculture.[7] Surface temperature increases are greatest in the Arctic and have contributed to the retreat of glaciers, permafrost, and sea ice. Environmental impacts include the extinction or relocation of many species as their ecosystems change, most immediately in coral reefs, mountains, and the Arctic. Surface temperatures would stabilize and decline a little if emissions were cut off, but other impacts will continue for centuries, including rising sea levels from melting ice sheets, rising ocean temperatures, and ocean acidification from elevated levels of carbon dioxide.[8]
| Some effects of climate change |
|
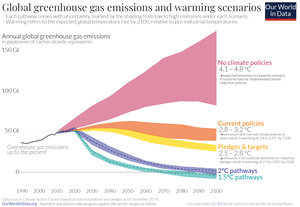
Countries work together on climate change under the umbrella of the United Nations Framework Convention on Climate Change (UNFCCC), which has near-universal membership. The goal of the convention is to "prevent dangerous anthropogenic interference with the climate system". The IPCC has told policy makers that there is much greater risk to human and natural systems if warming goes above 1.5 °C (2.7 °F) compared to pre-industrial levels.[10] Under the Paris Agreement, nations are making climate pledges to reduce greenhouse gas (GHG) emissions, but those promises - assuming nations follow through - would still allow global warming to reach about 2.8 °C (5.0 °F) by 2100.[11] To limit warming to 1.5 °C (2.7 °F), methane emissions would need to decrease to near-zero levels and carbon dioxide emissions would need to reach net-zero by the year 2050.[12]
Mitigation efforts to address global warming include the development and deployment of low carbon energy technologies, policies to reduce fossil fuel emissions, reforestation, forest preservation, as well as the development of potential climate engineering technologies. Societies and governments are also working to adapt to current and future global warming impacts, including improved coastline protection, better disaster management, and the development of more resistant crops.
Observed temperature rise
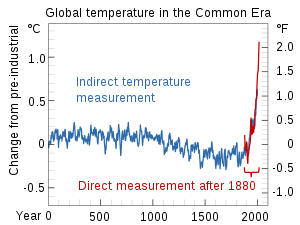
Multiple independently produced instrumental datasets show that the climate system is warming,[14] with the 2009–2018 decade being 0.93 ± 0.07 °C (1.67 ± 0.13 °F) warmer than the pre-industrial baseline (1850–1900).[15] Currently, surface temperatures are rising by about 0.2 °C (0.36 °F) per decade.[16] Since 1950, the number of cold days and nights has decreased, and the number of warm days and nights has increased.[17] Historical patterns of warming and cooling, like the Medieval Climate Anomaly and the Little Ice Age, were not as synchronous as current warming, but may have reached temperatures as high as those of the late-20th century in a limited set of regions.[18] There have been prehistorical episodes of global warming, such as the Paleocene–Eocene Thermal Maximum.[19] However, the observed rise in temperature and CO
2 concentrations has been so rapid that even abrupt geophysical events that took place in Earth's history do not approach current rates.[20]
Climate proxy records show that natural variations offset the early effects of the Industrial Revolution, so there was little net warming between the 18th century and the mid-19th century,[21] when thermometer records began to provide global coverage.[22] The Intergovernmental Panel on Climate Change (IPCC) has adopted the baseline reference period 1850–1900 as an approximation of pre-industrial global mean surface temperature.[21]
The warming evident in the instrumental temperature record is consistent with a wide range of observations, documented by many independent scientific groups.[23] Although the most common measure of global warming is the increase in the near-surface atmospheric temperature, over 90% of the additional energy in the climate system over the last 50 years has been stored in the ocean, warming it.[24] The remainder of the additional energy has melted ice and warmed the continents and the atmosphere.[25] The ocean heat uptake drives thermal expansion which has contributed to observed sea level rise.[26] Further indicators of climate change include an increase in the frequency and intensity of heavy precipitation, melting of snow and land ice and increased atmospheric humidity.[27] Flora and fauna also portray behaviour consistent with warming, such as the earlier flowering of plants in spring.[28]
Although record-breaking years attract considerable media attention, individual years are less significant than the overall global surface temperature, which is subject to short-term fluctuations that overlie long-term trends.[29] An example of such an episode is the slower rate of surface temperature increase from 1998 to 2012, which was described as the global warming hiatus.[30] Throughout this period, ocean heat storage continued to progress steadily upwards, and in subsequent years, surface temperatures have spiked upwards. The slower pace of warming can be attributed to a combination of natural fluctuations, reduced solar activity, and increased reflection sunlight of by particles from volcanic eruptions.[31]
Regional variation
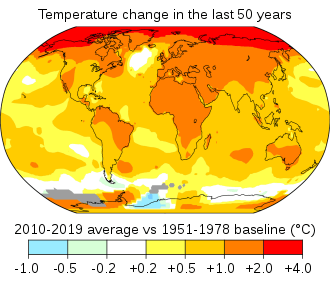
Global warming refers to global averages, with the amount of warming varying by region. Since the pre-industrial period, global average land temperatures have increased almost twice as fast as global average temperatures.[32] This is due to the larger heat capacity of oceans and because oceans lose more heat by evaporation.[33] Patterns of warming are independent of the locations of greenhouse gas emissions because the gases persist long enough to diffuse across the planet; however, localized black carbon deposits on snow and ice do contribute to Arctic warming.[34]
The Northern Hemisphere and North Pole have warmed much faster than the South Pole and Southern Hemisphere. The Northern Hemisphere not only has much more land, but also more snow area and sea ice, because of how the land masses are arranged around the Arctic Ocean. As these surfaces flip from being reflective to dark after the ice has melted, they start absorbing more heat. The Southern Hemisphere already had little sea ice in summer before it started warming.[35] Arctic temperatures have increased and are predicted to continue to increase during this century at over twice the rate of the rest of the world.[36] Melting of glaciers and ice sheets in the Arctic disrupts ocean circulation, including a weakened Gulf Stream, causing increased warming in some areas.[37]
Physical drivers of recent climate change
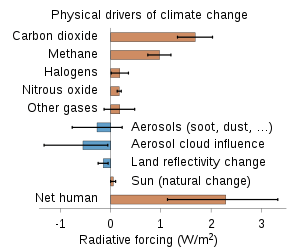
By itself, the climate system experiences various cycles which can last for years (such as the El Niño–Southern Oscillation) to decades or centuries.[38] Other changes are caused by an imbalance of energy at the top of the atmosphere: external forcings. These forcings are "external" to the climate system, but not always external to the Earth.[39] Examples of external forcings include changes in the composition of the atmosphere (e.g. increased concentrations of greenhouse gases), solar luminosity, volcanic eruptions, and variations in the Earth's orbit around the Sun.[40]
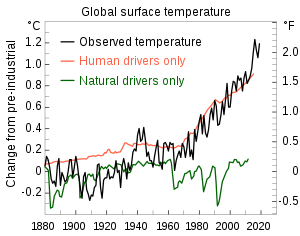
Attribution of climate change is the effort to scientifically show which mechanisms are responsible for observed changes in Earth's climate. First, known internal climate variability and natural external forcings need to be ruled out. Therefore, a key approach is to use computer modelling of the climate system to determine unique "fingerprints" for all potential causes. By comparing these fingerprints with observed patterns and evolution of climate change, and the observed history of the forcings, the causes of the observed changes can be determined.[41] For example, solar forcing can be ruled out as major cause because its fingerprint is warming in the entire atmosphere, and only the lower atmosphere has warmed as expected for greenhouse gases.[42] The causes of current climate change are primarily greenhouse gases, and secondarily land use changes, and aerosols and soot.[43]
Greenhouse gases
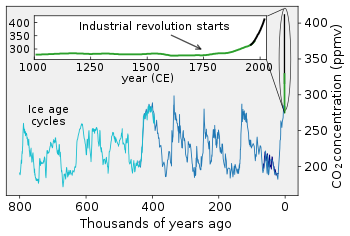
2 concentrations over the last 800,000 years as measured from ice cores (blue/green) and directly (black)
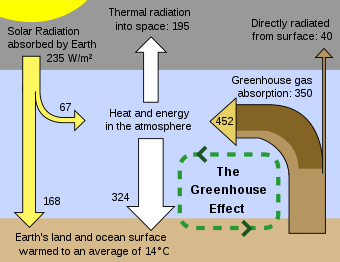
Greenhouse gases trap heat radiating from the Earth to space.[44] This heat, in the form of infrared radiation, gets absorbed and emitted by these gases in the atmosphere, thus warming the lower atmosphere and the surface. Before the Industrial Revolution, naturally occurring amounts of greenhouse gases caused the air near the surface to be warmer by about 33 °C (59 °F) than it would be in their absence.[45] Without the Earth's atmosphere, the Earth's average temperature would be well below the freezing temperature of water.[46] While water vapour (~50%) and clouds (~25%) are the biggest contributors to the greenhouse effect, they increase as a function of temperature and are therefore considered feedbacks. Increased concentrations of gases such as CO
2 (~20%), ozone and N
2O are external forcing on the other hand.[47] Ozone acts as a greenhouse gas in the lowest layer of the atmosphere, the troposphere. Furthermore, it is highly reactive and interacts with other greenhouse gases and aerosols.[48]
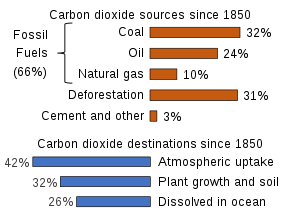
Human activity since the Industrial Revolution, mainly extracting and burning fossil fuels,[49] has increased the amount of greenhouse gases in the atmosphere. This CO2, methane, tropospheric ozone, CFCs, and nitrous oxide has increased radiative forcing. In 2018, the concentrations of CO2 and methane had increased by about 45% and 160%, respectively, since pre-industrial times.[50] In 2013, CO2 readings taken at the world's primary benchmark site in Mauna Loa surpassing 400 ppm for the first time.[51] These levels are much higher than at any time during the last 800,000 years, the period for which reliable data have been collected from ice cores.[52] Less direct geological evidence indicates that CO2 values have not been this high for millions of years.[53]
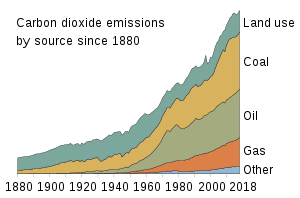
2 since 1880 have been caused by different sources ramping up one after another.
Global anthropogenic greenhouse gas emissions in 2018 excluding land use change were equivalent to 52 billion tonnes of carbon dioxide. Of these emissions, 72% was carbon dioxide from fossil fuel burning and industry, 19% was methane, largely from livestock,[54] 6% was nitrous oxide, largely from the decomposition of inorganic and organic fertilizer,[55] and 3% was fluorinated gases.[56] A further 4 billion tonnes of CO
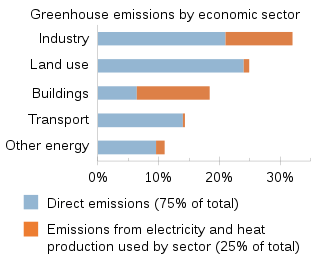
2 was released as a consequence of land use change, primarily deforestation, in which stored carbon is released from the disturbance of soil and the rotting or burning of felled trees.[57][58] From a production standpoint, the primary sources of global GHG emissions are estimated as: electricity and heat (25%), agriculture and forestry (24%), industry (21%), and transportation (14%).[59] Consumption based estimates of GHG emissions offer another useful way to understand sources of global warming, and may better capture the effects of trade.[60] From a consumption standpoint, the dominant sources of global 2010 emissions were found to be: food (30%), washing, heating, and lighting (26%); personal transport and freight (20%); and building construction (15%).[61]
Despite the contribution of deforestation to GHG emissions, the Earth's land surface, particularly its forests, remain a significant carbon sink for CO
2. Natural processes, such as carbon fixation in the soil and photosynthesis, more than offset the GHG contributions from deforestation. The land surface sink is estimated to remove about 11 billion tonnes of CO
2 annually from the atmosphere, or about 29% of global CO
2 emissions.[62] The ocean also serves as a significant carbon sink via a two-step process. First, CO
2 dissolves in the surface water. Afterwards, the ocean's overturning circulation distributes it deep into the ocean's interior, where it accumulates over time as part of the carbon cycle. Over the last two decades, the world's oceans have removed between 20 and 30% of emitted CO
2.[63] The strength of both the land and ocean sinks increase as CO
2 levels in the atmosphere rise. In this respect they act as negative feedbacks in global warming.[64]
Land surface change
Humans change the Earth's surface mainly to create more agricultural land. Today, agriculture takes up 34% of Earth's land area, while 26% is forests, and 30% is uninhabitable (glaciers, deserts, etc.).[65] The amount of forested land continues to decrease, largely due to conversion to cropland in the tropics.[66] This deforestation is the most significant aspect of land surface change affecting global warming. The main causes are: deforestation from permanent land use change for agricultural products such as beef and palm oil (27%), forestry/forest products (26%), short term shifting cultivation (24%), and wildfires (23%).[67]
In addition to impacting greenhouse gas concentrations, land use changes affect global warming through a variety of other chemical and physical dynamics. Changing the type of vegetation in a region impacts the local temperature by changing how much sunlight gets reflected back into space, called albedo, and how much heat is lost by evaporation. For instance, the change from a dark forest to grassland makes the surface lighter, causing it to reflect more sunlight. Deforestation can also contribute to changing temperatures by affecting the release of aerosols and other chemical compounds that affect clouds; and by changing wind patterns when the land surface has different obstacles.[68] Globally, these effects are estimated to have led to a slight cooling, dominated by an increase in surface albedo.[69] But there is significant geographic variation in how this works. In the tropics the net effect is to produce a significant warming, while at latitudes closer to the poles a loss of albedo leads to an overall cooling effect.[68]
Aerosols and clouds
Air pollution, in the form of aerosols, not only puts a large burden on human health, but also affects the climate on a large scale.[70] From 1961 to 1990, a gradual reduction in the amount of sunlight reaching the Earth's surface was observed, a phenomenon popularly known as global dimming,[71] typically attributed to aerosols from biofuel and fossil fuel burning.[72] Aerosol removal by precipitation gives tropospheric aerosols an atmospheric lifetime of only about a week, while stratospheric aerosols can remain in the atmosphere for a few years.[73] Globally, aerosols have been declining since 1990, removing some of the masking of global warming that they had been providing.[74]
In addition to their direct effect by scattering and absorbing solar radiation, aerosols have indirect effects on the Earth's radiation budget. Sulfate aerosols act as cloud condensation nuclei and thus lead to clouds that have more and smaller cloud droplets. These clouds reflect solar radiation more efficiently than clouds with fewer and larger droplets.[75] This effect also causes droplets to be of more uniform size, which reduces the growth of raindrops and makes clouds more reflective to incoming sunlight.[76] Indirect effects of aerosols are the largest uncertainty in radiative forcing.[77]
While aerosols typically limit global warming by reflecting sunlight, black carbon in soot that falls on snow or ice can contribute to global warming. Not only does this increase the absorption of sunlight, it also increases melting and sea level rise.[78] Limiting new black carbon deposits in the Arctic could reduce global warming by 0.2 °C by 2050.[79]
Natural forcings
As the Sun is the Earth's primary energy source, changes in incoming sunlight directly affect the climate system.[80] Solar irradiance has been measured directly by satellites,[81] and indirect measurements are available beginning in the early 1600s.[80] There has been no upward trend in the amount of the Sun's energy reaching the Earth, so it cannot be responsible for the current warming.[82] Physical climate models are also unable to reproduce the rapid warming observed in recent decades when taking into account only variations in solar output and volcanic activity.[83] Another line of evidence for the warming not being due to the Sun is how temperature changes differ at different levels in the Earth's atmosphere.[84] According to basic physical principles, the greenhouse effect produces warming of the lower atmosphere (the troposphere), but cooling of the upper atmosphere (the stratosphere).[85] If solar variations were responsible for the observed warming, warming of both the troposphere and the stratosphere would be expected, but that has not been the case.[42] Explosive volcanic eruptions represent the largest natural forcing over the industrial era. When the eruption is sufficiently strong, with sulfur dioxide reaching the stratosphere, sunlight can be partially blocked for a couple of years, with a temperature signal lasting about twice as long.[86]
Climate change feedback
.jpg)
The response of the climate system to an initial forcing is increased by self-reinforcing feedbacks and reduced by balancing feedbacks.[88] The primary balancing feedback to global temperature change is radiative cooling to space as infrared radiation in response to rising surface temperature.[89] The main reinforcing feedbacks are the water vapour feedback, the ice–albedo feedback, and probably the net effect of clouds.[90] Uncertainty over feedbacks is the major reason why different climate models project different magnitudes of warming for a given amount of emissions.[91]
As air gets warmer, it can hold more moisture. After an initial warming due to emissions of greenhouse gases, the atmosphere will hold more water. As water is a potent greenhouse gas, this further heats the climate: the water vapour feedback.[90] The reduction of snow cover and sea ice in the Arctic reduces the albedo of the Earth's surface.[92] More of the Sun's energy is now absorbed in these regions, contributing to Arctic amplification, which has caused Arctic temperatures to increase at more than twice the rate of the rest of the world.[93]
Cloud cover may change in the future. If cloud cover increases, more sunlight will be reflected back into space, cooling the planet. Simultaneously, the clouds enhance the greenhouse effect, warming the planet. The opposite is true if cloud cover decreases. It depends on the cloud type and location which process is more important. Overall, the net feedback over the industrial era has probably been self-reinforcing.[94]
Roughly half of each year's CO2 emissions have been absorbed by plants on land and in oceans.[95] Carbon dioxide and an extended growing season have stimulated plant growth making the land carbon cycle a balancing feedback. Climate change also increases droughts and heat waves that inhibit plant growth, which makes it uncertain whether this balancing feedback will persist in the future.[96] Soils contain large quantities of carbon and may release some when they heat up.[97] As more CO2 and heat are absorbed by the ocean, it acidifies, its circulation changes and phytoplankton takes up less carbon, decreasing the rate at which the ocean absorbs atmospheric carbon.[98] Climate change can also increase methane emissions from wetland, marine and freshwater systems and permafrost.[99]
Future warming and the carbon budget
Future warming depends on the strength of climate feedbacks and on emissions of greenhouse gases.[100] The former is often estimated using climate models. A climate model is a representation of the physical, chemical, and biological processes that affect the climate system.[101] They also include changes in the Earth's orbit, historical changes in the Sun's activity, and volcanic forcing.[102] Computer models attempt to reproduce and predict the circulation of the oceans, the annual cycle of the seasons, and the flows of carbon between the land surface and the atmosphere.[103] There are more than two dozen scientific institutions that develop climate models.[104] Models not only project different future temperature with different emissions of greenhouse gases, but also do not fully agree on the strength of different feedbacks on climate sensitivity and the amount of inertia of the system.[105]
The physical realism of models is tested by examining their ability to simulate contemporary or past climates.[106] Past models have underestimated the rate of Arctic shrinkage[107] and underestimated the rate of precipitation increase.[108] Sea level rise since 1990 was underestimated in older models, but now agrees well with observations.[109] The 2017 United States-published National Climate Assessment notes that "climate models may still be underestimating or missing relevant feedback processes".[110]
2 and all forcing agents' atmospheric CO
2-equivalents.
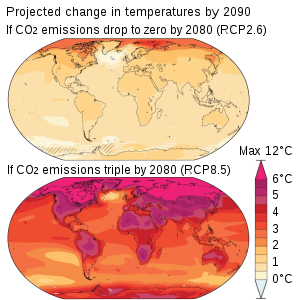
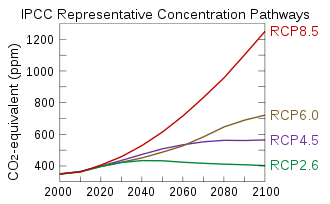
Four Representative Concentration Pathways (RCPs) are used as input for climate models: "a stringent mitigation scenario (RCP2.6), two intermediate scenarios (RCP4.5 and RCP6.0) and one scenario with very high GHG [greenhouse gas] emissions (RCP8.5)".[111] RCPs only look at concentrations of greenhouse gases, and so does not include the response of the carbon cycle.[112] Climate model projections summarized in the IPCC Fifth Assessment Report indicate that, during the 21st century, the global surface temperature is likely to rise a further 0.3 to 1.7 °C (0.5 to 3.1 °F) in a moderate scenario, or as much as 2.6 to 4.8 °C (4.7 to 8.6 °F) in an extreme scenario, depending on the rate of future greenhouse gas emissions and on climate feedback effects.[113]
A subset of climate models add societal factors to a simple physical climate model. These models simulate how population, economic growth, and energy use affect – and interact with – the physical climate. With this information, these models can produce scenarios of how greenhouse gas emissions may vary in the future. This output is then used as input for physical climate models to generate climate change projections.[114] In some scenarios emissions continue to rise over the century, while others have reduced emissions.[115] Fossil fuel resources are abundant, and cannot be relied on to limit carbon emissions in the 21st century.[116] Emission scenarios can be combined with modelling of the carbon cycle to predict how atmospheric concentrations of greenhouse gases might change in the future.[117] According to these combined models, by 2100 the atmospheric concentration of CO2 could be as low as 380 or as high as 1400 ppm, depending on the Shared Socioeconomic Pathway (SSP) and the mitigation scenario.[118]
The remaining carbon emissions budget is determined from modelling the carbon cycle and climate sensitivity to greenhouse gases.[119] According to the IPCC, global warming can be kept below 1.5 °C with a two-thirds chance if emissions after 2018 do not exceed 420 or 570 GtCO
2 depending on the choice of the measure of global temperature. This amount corresponds to 10 to 13 years of current emissions. There are high uncertainties about the budget; for instance, it may be 100 GtCO
2 smaller due to methane release from permafrost and wetlands.[120]
Effects
Physical environment
The environmental effects of global warming are broad and far-reaching. They include effects on the oceans, ice, and weather and may occur gradually or rapidly. Evidence for these effects come from studying climate change in the past, modelling and modern observations.[122] Since the 1950s, droughts and heat waves have appeared simultaneously with increasing frequency.[123] Extremely wet or dry events within the monsoon period have increased in India and East Asia.[124] Various mechanisms have been identified that might explain extreme weather in mid-latitudes from the rapidly warming Arctic, such as the jet stream becoming more erratic.[125] The maximum rainfall and wind speed from hurricanes and typhoons is likely increasing.[126]
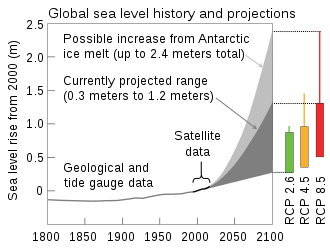
Global sea level is rising as a consequence of glacial melt, melt of the ice sheets in Greenland and Antarctica, and thermal expansion. Between 1993 and 2017, the rise was on average 3.1 ± 0.3 mm per year, and accelerated.[127] Over the 21st century, the IPCC projects that in a very high emissions scenario the sea level could rise by 61–110 cm.[128] Increased ocean warmth is undermining and threatening to unplug Antarctic glacier outlets risking large melt of the ice sheet,[129] and a separate expert assessment doesn't exclude 2 meters sea level rise in 2100 under high emissions due to such uncertainties in Antarctica and Greenland ice sheets.[130]
Global warming has led to decades of shrinking and thinning of the Arctic sea ice, making it vulnerable to atmospheric anomalies.[131] Projections of declines in Arctic sea ice vary.[132] While ice-free summers are expected to be rare at 1.5 °C (2.7 °F) degrees of warming, they are set to occur once every three to ten years at a warming level of 2.0 °C (3.6 °F),[133] increasing the ice–albedo feedback.[134] Higher atmospheric CO
2 concentrations have led to an increase in dissolved CO2, which causes ocean acidification.[135] Furthermore, oxygen levels decrease because oxygen is less soluble in warmer water, an effect known as ocean deoxygenation.[136]
Long-term impacts and tipping points
The long-term effects of global warming include further ice melt, ocean warming, sea level rise, and ocean acidification. On the timescale of centuries to millennia, the magnitude of global warming will be determined primarily by anthropogenic CO2 emissions.[137] This is due to carbon dioxide's very long lifetime in the atmosphere.[137] Carbon dioxide is slowly taking up by the ocean, such that ocean acidification will continue for hundreds to thousands of years.[138] The emissions are estimated to have prolonged the current interglacial period by at least 100,000 years.[139] Because the great mass of glaciers and ice caps depressed the Earth's crust, another long-term effect of ice melt and deglaciation is the gradual rising of landmasses, a process called post-glacial rebound.[140] Sea level rise will continue over many centuries, with an estimated rise of 2.3 metres per degree Celsius (4.2 ft/°F) after 2000 years.[141]
If global warming exceeds 1.5 °C, there is a greater risk of passing through ‘tipping points’, thresholds beyond which certain impacts can no longer be avoided even if temperatures are reduced.[142] Some large-scale changes could occur abruptly, i.e. over a short time period. One potential source of abrupt tipping would be the rapid release of methane and carbon dioxide from permafrost, which would amplify global warming.[143] Another example is the possibility for the Atlantic Meridional Overturning Circulation to collapse,[144] which could trigger cooling in the North Atlantic, Europe, and North America.[145] If multiple temperature and carbon cycle tipping points re-inforce each other, or if there were to be strong threshold behaviour in cloud cover, there could be a global tipping into a hothouse Earth.[146]
Nature and wildlife
Recent warming has driven many terrestrial and freshwater species poleward and towards higher altitudes.[147] Higher atmospheric CO2 levels and an extended growing season have resulted in global greening, whereas heatwaves and drought have reduced ecosystem productivity in some regions. The future balance of these opposing effects is unclear.[148] Global warming has contributed to the expansion of drier climatic zones, such as, probably, the expansion of deserts in the subtropics.[149] Without substantial actions to reduce the rate of global warming, land-based ecosystems risk major shifts in their composition and structure.[150] Overall, it is expected that climate change will result in the extinction of many species and reduced diversity of ecosystems.[151]
The ocean has heated more slowly than the land, but plants and animals in the ocean have migrated towards the colder poles as fast as or faster than species on land.[152] Just as on land, heat waves in the ocean occur more due to climate change, with harmful effects found on a wide range of organisms such as corals, kelp, and seabirds.[153] Ocean acidification threatens damage to coral reefs, fisheries, protected species, and other natural resources of value to society.[154] Coastal ecosystems are under stress, with almost half of wetlands having disappeared as a consequence of climate change and other human impacts. Harmful algae blooms have increased due to warming, ocean deoxygenation and eutrophication.[155]
- Climate change impacts on the environment
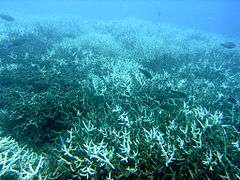 Ecological collapse possibilities. Bleaching has damaged the Great Barrier Reef and threatens reefs worldwide.[156]
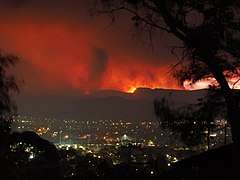
.jpg) Arctic warming. Permafrost thaws undermine infrastructure and release methane in a positive feedback loop.[143]
Arctic warming. Permafrost thaws undermine infrastructure and release methane in a positive feedback loop.[143]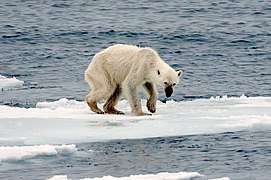 Habitat destruction. Many arctic animals rely on sea ice, which has been disappearing in a warming Arctic.[158]
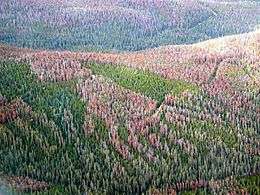 Pest propagation. Mild winters allow more pine beetles to survive to kill large swaths of forest.[159]
Humans
The effects of climate change on humans, mostly due to warming and shifts in precipitation, have been detected worldwide. The social impacts of climate change will be uneven across the world.[160] All regions are at risk of experiencing negative impacts,[161] with low-latitude, less developed areas facing the greatest risk.[162] Regional impacts of climate change are now observable on all continents and across ocean regions.[163] The Arctic, Africa, small islands, and Asian megadeltas are regions that are likely to be especially affected by future climate change.[164] Many risks increase with higher magnitudes of global warming.[165]
Global warming of around 4 °C relative to late 20th century levels could pose a large risk to global and regional food security.[166] Crop production will probably be negatively affected in low-latitude countries, while effects at northern latitudes may be positive or negative.[167] The impact for the four major crops was negative for wheat and maize, and neutral for soy and rice, in the years 1960–2013.[168] Up to an additional 183 million people worldwide, particularly those with lower incomes, are at risk of hunger as a consequence of warming.[169] While increased CO
2 levels help crop growth at lower temperature increases, those crops do become less nutritious.[169] Based on local and indigenous knowledge, climate change is already affecting food security in mountain regions in South America and Asia, and in various drylands, particularly in Africa.[169] Regions dependent on glacier water, regions that are already dry, and small islands are also at increased risk of water stress due to climate change.[170]
In small islands and mega deltas, inundation from sea level rise is expected to threaten vital infrastructure and human settlements.[171] This could lead to statelessness for populations in island nations, such as the Maldives and Tuvalu.[172] Climate change can be a driver of migration, both within and between countries.[173]
Global warming has likely already increased global economic inequality, and is projected to do so in the future.[174] The majority of severe impacts of climate change are expected in sub-Saharan Africa and South-East Asia, where existing poverty is exacerbated.[175] The World Bank estimates that global warming could drive over 120 million people into poverty by 2030.[176] Current inequalities between men and women, between rich and poor and between people of different ethnicity have been observed to worsen as a consequence of climate variability and climate change.[177] Regions may become uninhabitable, with humidity and temperatures reaching levels too high for humans to survive.[178]
Generally, impacts on public health will be more negative than positive.[179] Impacts include the direct effects of extreme weather, leading to injury and loss of life;[180] and indirect effects, such as undernutrition brought on by crop failures.[181] Various infectious diseases are more easily transmitted in a warming climate, such as dengue fever, which affects children most severely, and malaria.[182] Young children are further the most vulnerable to food shortages, and together with older people to extreme heat.[183] Climate change has been linked to an increase in violent conflict by amplifying poverty and economic shocks, which are well-documented drivers of these conflicts.[184]
- Climate change impacts on people
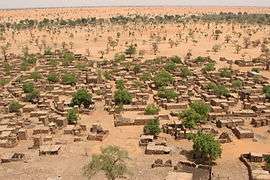 Environmental migration. Sparser rainfall leads to desertification that harms agriculture and can displace populations.[185]
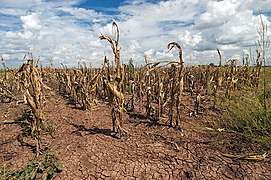 Agricultural changes. Droughts, rising temperatures, and extreme weather negatively impact agriculture.[186]
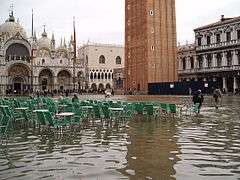 Tidal flooding. Sea level rise increases flooding in low-lying coastal regions. Shown: Venice, Italy.[187]
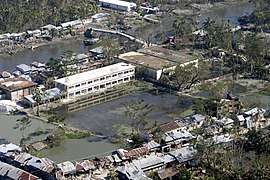 Storm intensification. Bangladesh after Cyclone Sidr is an example of catastrophic flooding from increased rainfall.[188]
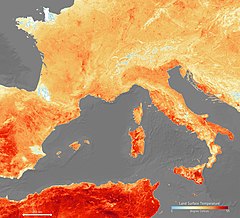 Heat wave intensification. Events like the June 2019 European heat wave are becoming more common.[189]
Responses
The two conventional responses are preventing as much additional warming as possible (a.k.a. "mitigation") and adapting to unavoidable warming. To increase chances of successful adaptation, as much additional warming as possible needs to be prevented. Many of the countries that have contributed least to global greenhouse gas emissions are among the most vulnerable to climate change, which raises questions about justice and fairness with regard to mitigation and adaptation.[190]
A third, and highly controversial option, involves geoengineering, in which humans attempt to design climate through more intensive intentional intervention with the climate system.[191]
Mitigation
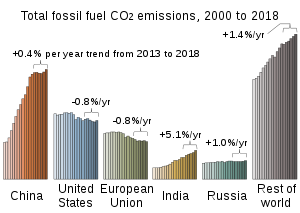
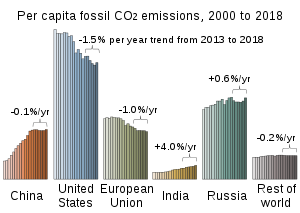
2 emissions in China and the rest of world have eclipsed the output of the United States and Europe.[192]
The IPCC has stressed the need to keep global warming below 1.5 °C (2.7 °F) compared to pre-industrial levels in order to avoid some irreversible impacts.[10] Climate change impacts can be mitigated by reducing greenhouse gas emissions and by enhancing the capacity of Earth's surface to absorb greenhouse gases from the atmosphere.[193] In order to limit global warming to less than 1.5 °C with a high likelihood of success, the IPCC estimates that global GHG emissions will need to be net zero by 2050,[194] or by 2070 with a 2 °C target. This will require far-reaching, systemIc changes on an unprecedented scale in energy, land, cities, transport, buildings, and industry.[195] To make progress towards that goal, the United Nations Environment Programme estimates that, within the next decade, countries will need to triple the amount of reductions they have committed to in their current Paris agreements.[196]
Technologies and other methods
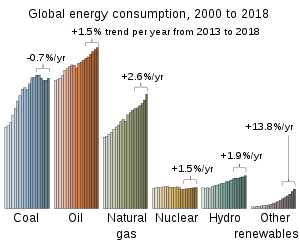
Long-term scenarios all point to rapid and significant investment in renewable energy and energy efficiency as key to reducing GHG emissions.[197] These technologies include solar and wind power, bioenergy, geothermal energy, and hydroelectricity. Combined, they are capable of supplying several times the world's current energy needs.[198] Solar PV and wind, in particular, have seen substantial growth and progress over the last few years, such that they are currently among the cheapest sources of new power generation.[199] Renewables represented 75% of all new electricity generation installed in 2019, with solar and wind constituting nearly all of that amount.[200] However, fossil fuels continue to dominate world energy supplies. In 2018 fossil fuels produced 80% of the world's energy, with modern renewable sources, including solar and wind power, accounting for around 11%.[201]
There are obstacles to the rapid development of renewable energy. Environmental and land use concerns are sometimes associated with large solar, wind and hydropower projects.[202] Solar and wind power also require energy storage systems and other modifications to the electricity grid to operate effectively,[197] although several storage technologies are now emerging to supplement the traditional use of pumped-storage hydropower.[203] The use of rare metals and other hazardous materials has also been raised as a concern with solar power.[204] The use of bioenergy is often not carbon neutral, and may have negative consequences for food security,[205] largely due to the amount of land required compared to other renewable energy options.[206]
Where energy production or CO
2-intensive heavy industries continue to produce waste CO
2, the gas can be captured and stored instead of being released to the atmosphere. Although costly, [207] carbon capture and storage ("CSS") is likely necessary to meet global climate change mitigation targets negotiated in the Paris Agreement.[208] Earth's natural carbon sinks can be enhanced to sequester significantly larger amounts of CO
2 beyond naturally occurring levels.[209] Forest preservation, reforestation and tree planting on non-forest lands are considered the most effective, although they may present food security concerns. Soil management on croplands and grasslands is another effective mitigation technique. For all these approaches there remain large scientific uncertainties with implementing them on a global scale.[210]
Individuals can also take actions to reduce their carbon footprint. These include: driving an EV or other energy efficient car and reducing vehicles miles by using mass transit or cycling; adopting a plant-based diet; reducing energy use in the home; limiting consumption of goods and services; and foregoing air travel.[211]
Scenarios and strategies for 2050
Although there is no single pathway to limit global warming to 1.5 or 2 °C,[212] most scenarios and strategies see a major increase in the use of renewable energy in combination with increased energy efficiency measures to generate the needed greenhouse gas reductions.[213] Forestry and agriculture components also include steps to reduce pressures on ecosystems and enhance their carbon sequestration capabilities.[214] Scenarios that limit global warming to 1.5 °C generally project the large scale use of carbon dioxide removal methods to augment the greenhouse gas reduction approaches mentioned above.[215]
Renewable energy would become the dominant form of electricity generation, rising to 85% or more by 2050 in some scenarios. The use of electricity for other needs, such as heating, would rise to the point where electricity becomes the largest form of overall energy supply by 2050.[216] Investment in coal would be eliminated and coal use nearly phased out by 2050.[217]
In transport, scenarios envision sharp increases in the market share of electric vehicles, low carbon fuel substitution for other transportation modes like shipping, and changes in transportation patterns to reduce overall demand, for example increased public transport.[218] Buildings will see additional electrification with the use of technologies like heat pumps, as well as continued energy efficiency improvements achieved via low energy building codes.[219] Industrial efforts will focus on increasing the energy efficiency of production processes, such as the use of cleaner technology for cement production,[220] designing and creating less energy intensive products, increasing product lifetimes, and developing incentives to reduce product demand.[221]
The agriculture and forestry sector faces a triple challenge of limiting greenhouse gas emissions, preventing further conversion of forests to agricultural land, and meeting increases in world food demand.[222] A suite of actions could reduce agriculture/forestry based greenhouse gas emissions by 66% from 2010 levels by reducing growth in demand for food and other agricultural products, increasing land productivity, protecting and restoring forests, and reducing GHG emissions from agricultural production.[223]
Policies and measures
A wide range of policies, regulations and laws are being used to reduce greenhouse gases. Carbon pricing mechanisms include carbon taxes and emissions trading systems.[224] As of 2019, carbon pricing covers about 20% of global greenhouse gas emissions.[225] Renewable portfolio standards have been enacted in several countries to move utilities to increase the percentage of electricity they generate from renewable sources.[226] Phasing out of fossil fuel subsidies, currently estimated at $300 billion globally (about twice the level of renewable energy subsidies),[227] could reduce greenhouse gas emissions by 6%.[228] Subsidies could also be redirected to support the transition to clean energy.[229] More prescriptive methods that can reduce greenhouse gases include vehicle efficiency standards, renewable fuel standards, and air pollution regulations on heavy industry.[230]
As the use of fossil fuels is reduced, there are Just Transition considerations involving the social and economic challenges that arise. An example is the employment of workers in the affected industries, along with the well-being of the broader communities involved.[231] Climate justice considerations, such as those facing indigenous populations in the Arctic,[232] are another important aspect of mitigation policies.[233]
Adaptation
Adaptation is “the process of adjustment to current or expected changes in climate and its effects”. As climate change varies across regions, adaptation does too.[234] While some adaptation responses call for trade-offs, others bring synergies and co-benefits.[235] Examples of adaptation are improved coastline protection, better disaster management, and the development of more resistant crops.[236] Increased use of air conditioning allows people to better cope with heat, but also increases energy demand.[237] Adaptation is especially important in developing countries since they are predicted to bear the brunt of the effects of global warming.[238] The capacity and potential for humans to adapt, called adaptive capacity, is unevenly distributed across different regions and populations, and developing countries generally have less capacity to adapt.[239] The public sector, private sector, and communities are all gaining experience with adaptation, and adaptation is becoming embedded within certain planning processes.[240] There are limits to adaptation and more severe climate change requires more transformative adaptation, which can be prohibitively expensive.[234]
Climate engineering
Geoengineering or climate engineering is the deliberate large-scale modification of the climate to counteract climate change.[241] Techniques fall generally into the categories of solar radiation management and carbon dioxide removal, although various other schemes have been suggested. A 2018 review paper concluded that although geo-engineering is physically possible, all the techniques are in early stages of development, carry large risks and uncertainties and raise significant ethical and legal issues.[242]
Society and culture
Political response
The geopolitics of climate change is complex and has often been framed as a prisoners' dilemma, in which all countries benefit from mitigation done by other countries, but individual countries would lose from investing in a transition to a low-carbon economy themselves. Net importers of fossil fuels win economically from transitioning, and net exporters face stranded assets: fossil fuels they cannot sell.[243] Furthermore, the benefits to individual countries in terms of public health and local environmental improvements of coal phase out exceed the costs, potentially eliminating the free-rider problem.[244] The geopolitics may be further complicated by the supply chain of rare earth metals, which are necessary to produce clean technology.[245]
UN Framework Convention
As of 2020 nearly all countries in the world are parties to the United Nations Framework Convention on Climate Change (UNFCCC).[246] The objective of the Convention is to prevent dangerous human interference with the climate system.[247] As stated in the Convention, this requires that greenhouse gas concentrations are stabilized in the atmosphere at a level where ecosystems can adapt naturally to climate change, food production is not threatened, and economic development can be sustained.[248] The Framework Convention was agreed on in 1992, but global emissions have risen since then.[59] Its yearly conferences are the stage of global negotiations.[249]
This mandate was sustained in the 1997 Kyoto Protocol to the Framework Convention.[250] In ratifying the Kyoto Protocol, most developed countries accepted legally binding commitments to limit their emissions. These first-round commitments expired in 2012.[251] United States President George W. Bush rejected the treaty on the basis that "it exempts 80% of the world, including major population centres such as China and India, from compliance, and would cause serious harm to the US economy".[252] During these negotiations, the G77 (a lobbying group in the United Nations representing developing countries)[253] pushed for a mandate requiring developed countries to "[take] the lead" in reducing their emissions.[254] This was justified on the basis that the developed countries' emissions had contributed most to the accumulation of greenhouse gases in the atmosphere, per-capita emissions were still relatively low in developing countries, and the emissions of developing countries would grow to meet their development needs.[255]
In 2009 several UNFCCC Parties produced the Copenhagen Accord,[257] which has been widely portrayed as disappointing because of its low goals, leading poorer nations to reject it.[258] Nations associated with the Accord aimed to limit the future increase in global mean temperature to below 2 °C.[259] In 2015 all UN countries negotiated the Paris Agreement, which aims to keep climate change well below 2 °C and contains an aspirational goal of keeping warming under 1.5 °C. The agreement replaced the Kyoto Protocol. Unlike Kyoto, no binding emission targets are set in the Paris Agreement. Instead, the procedure of regularly setting ever more ambitious goals and reevaluating these goals every five years has been made binding.[260] The Paris Agreement reiterated that developing countries must be financially supported.[261] As of November 2019, 194 states and the European Union have signed the treaty and 186 states and the EU have ratified or acceded to the agreement.[262] In November 2019 the Trump administration notified the UN that it would withdraw the United States from the Paris Agreement in 2020.[263]
Other policy
In 2019, the British Parliament became the first national government in the world to officially declare a climate emergency.[264] Other countries and jurisdictions followed.[265] In November 2019 the European Parliament declared a "climate and environmental emergency",[266] and the European Commission presented its European Green Deal with which they hope to make the EU carbon-neutral in 2050.[267]
While the ozone layer and climate change are considered separate problems, the solution to the former has significantly mitigated global warming. The estimated mitigation of the Montreal Protocol, an international agreement to stop emitting ozone-depleting gases, is estimated to have been more effective than the Kyoto Protocol, which was specifically designed to curb greenhouse gas emissions.[268] It has been argued that the Montreal Protocol may have done more than any other measure, as of 2017, to mitigate climate change as those substances were also powerful greenhouse gases.[269]
Scientific consensus
In the scientific literature, there is an overwhelming consensus that global surface temperatures have increased in recent decades and that the trend is caused mainly by human-induced emissions of greenhouse gases.[271] No scientific body of national or international standing disagrees with this view.[272] Scientific discussion takes place in journal articles that are peer-reviewed, which scientists subject to assessment every couple of years in the Intergovernmental Panel on Climate Change reports.[273] In 2013, the IPCC Fifth Assessment Report stated that "is extremely likely that human influence has been the dominant cause of the observed warming since the mid-20th century".[274] Their 2018 report expressed the scientific consensus as: "human influence on climate has been the dominant cause of observed warming since the mid-20th century".[275]
Consensus has further developed that some form of action should be taken to protect people against the impacts of climate change, and national science academies have called on world leaders to cut global emissions.[276] In 2017, in the second warning to humanity, 15,364 scientists from 184 countries stated that "the current trajectory of potentially catastrophic climate change due to rising greenhouse gases from burning fossil fuels, deforestation, and agricultural production – particularly from farming ruminants for meat consumption" is "especially troubling".[277] In 2019, a group of more than 11,000 scientists from 153 countries named climate change an "emergency" that would lead to "untold human suffering" if no big shifts in action takes place.[278] The emergency declaration emphasized that economic growth and population growth "are among the most important drivers of increases in CO
2 emissions from fossil fuel combustion" and that "we need bold and drastic transformations regarding economic and population policies".[279]
Public debate
The global warming problem came to international public attention in the late 1980s.[280] Due to confusing media coverage in the early 1990s, issues such as ozone depletion and climate change were often mixed up, affecting public understanding of these issues.[281] Although there are a few areas of linkage, the relationship between the two is weak.[282]
Significant regional differences exist in how concerned people are about climate change and how much they understand the issue.[283] In 2010, just a little over half the US population viewed it as a serious concern for either themselves or their families, while 73% of people in Latin America and 74% in developed Asia felt this way.[284] Similarly, in 2015 a median of 54% of respondents considered it "a very serious problem", but Americans and Chinese (whose economies are responsible for the greatest annual CO2 emissions) were among the least concerned.[283] Worldwide in 2011, people were more likely to attribute global warming to human activities than to natural causes, except in the US where nearly half of the population attributed global warming to natural causes.[285] Public reactions to global warming and concern about its effects have been increasing, with many perceiving it as the worst global threat.[286] In a 2019 CBS poll, 64% of the US population said that climate change is a "crisis" or a "serious problem", with 44% saying human activity was a significant contributor.[287]
Denial and misinformation
Public debate about climate change has been strongly affected by climate change denial and misinformation, which originated in the United States and has since spread to other countries, particularly Canada and Australia. The actors behind climate change denial form a well-funded and relatively coordinated coalition of fossil fuel companies, industry groups, conservative think tanks, and contrarian scientists.[289] Like the tobacco industry before, the main strategy of these groups has been to manufacture doubt about scientific data and results.[290] Many who deny, dismiss, or hold unwarranted doubt about the scientific consensus on anthropogenic global warming are labelled as "climate change skeptics", which several scientists have noted is a misnomer.[291]
There are different variants of climate denial: some deny that warming takes place at all, some acknowledge warming but attribute it to natural influences, and some minimize the negative impacts of climate change.[292] Manufacturing uncertainty about the science later developed into a manufacturing of controversy: creating the belief that there remains significant uncertainty about climate change within the scientific community in order to delay policy changes.[293] Strategies to promote these ideas include a criticism of scientific institutions,[294] and questioning the motives of individual scientists.[292] An "echo chamber" of climate-denying blogs and media has further fomented misunderstanding of global warming.[295]
Protest and litigation
Protests seeking more ambitious climate action increased in the 2010s in the form of fossil fuel divestment,[296] and worldwide demonstrations.[297] In particular, youth across the globe protested by skipping school, inspired by Swedish teenager Greta Thunberg in the school strike for climate.[298] Mass civil disobedience actions by Extinction Rebellion and Ende Gelände have ended in police intervention and large-scale arrests.[299] Litigation is increasingly used as a tool to strengthen climate action, with governments being the biggest target of lawsuits demanding that they become ambitious on climate action or enforce existing laws. Cases against fossil-fuel companies, from activists, shareholders and investors, generally seek compensation for loss and damage.[300]
Discovery
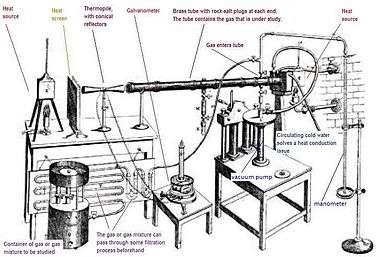
In 1681 Edme Mariotte noted that glass, though transparent to sunlight, obstructs radiant heat.[301] Around 1774 Horace Bénédict de Saussure showed that non-luminous warm objects emit infrared heat, and used a glass-topped insulated box to trap and measure heat from sunlight.[302] In 1824 Joseph Fourier proposed by analogy a version of the greenhouse effect; transparent atmosphere lets through visible light, which warms the surface. The warmed surface emits infrared radiation, but the atmosphere is relatively opaque to infrared and slows the emission of energy, warming the planet.[303] Starting in 1859,[304] John Tyndall established that nitrogen and oxygen (99% of dry air) are transparent to infrared, but water vapour and traces of some gases (significantly methane and carbon dioxide) both absorb infrared and, when warmed, emit infrared radiation. Changing concentrations of these gases could have caused "all the mutations of climate which the researches of geologists reveal" including ice ages.[305]
Svante Arrhenius noted that water vapour in air continuously varied, but carbon dioxide (CO
2) was determined by long term geological processes. At the end of an ice age, warming from increased CO
2 would increase the amount of water vapour, amplifying its effect in a feedback process. In 1896, he published the first climate model of its kind, showing that halving of CO
2 could have produced the drop in temperature initiating the ice age. Arrhenius calculated the temperature increase expected from doubling CO
2 to be around 5–6 °C (9.0–10.8 °F).[306] Other scientists were initially sceptical and believed the greenhouse effect to be saturated so that adding more CO
2 would make no difference. Experts thought climate would be self-regulating.[307] From 1938 Guy Stewart Callendar published evidence that climate was warming and CO
2 levels increasing,[308] but his calculations met the same objections.[307]
Early calculations treated the atmosphere as a single layer: Gilbert Plass used digital computers to model the different layers and found added CO
2 would cause warming. Hans Suess found evidence CO
2 levels had been rising, Roger Revelle showed the oceans would not absorb the increase, and together they helped Charles Keeling to begin a record of continued increase, the Keeling Curve.[307] Scientists alerted the public,[309] and the dangers were highlighted at James Hansen's 1988 Congressional testimony.[310] The Intergovernmental Panel on Climate Change, set up in 1988 to provide formal advice to the world's governments, spurred interdisciplinary research.[311]
Terminology
Before the 1980s, when it was unclear whether warming by greenhouse gases would dominate aerosol-induced cooling, scientist often used the term inadvertent climate modification to refer to humankind's impact on the climate. With increasing evidence of warming, the terms global warming and climate change were introduced, with the former referring only to increasing surface warming, and the latter to the full effect of greenhouse gases on climate.[312] Global warming became the dominant popular term after NASA climate scientist James Hansen used it in his 1988 testimony in the U.S. Senate.[310] In the 2000s, the term climate change increased in popularity.[313] In lay usage, global warming usually refers to human-induced warming of the Earth system, whereas climate change can refer to natural as well as anthropogenic change.[314] The two terms are often used interchangeably.[315]
Various scientists, politicians and news media have adopted the terms climate crisis or a climate emergency to talk about climate change, while using global heating instead of global warming.[316] The policy editor-in-chief of The Guardian explained why they included this language in their editorial guidelines: "We want to ensure that we are being scientifically precise, while also communicating clearly with readers on this very important issue".[317] Oxford Dictionary chose climate emergency as the word of the year 2019 and defines the term as "a situation in which urgent action is required to reduce or halt climate change and avoid potentially irreversible environmental damage resulting from it".[318]
See also
- Anthropocene – proposed new geological time interval in which humans are having significant geological impact
- Global cooling – minority view held by scientists in the 1970s that imminent cooling of the Earth would take place
Notes
- IPCC AR5 WG1 Summary for Policymakers 2013, p. 4: Warming of the climate system is unequivocal, and since the 1950s, many of the observed changes are unprecedented over decades to millennia. The atmosphere and ocean have warmed, the amounts of snow and ice have diminished, sea level has risen, and the concentrations of greenhouse gases have increased; IPCC SR15 Ch1 2018, p. 54: The abundant empirical evidence of the unprecedented rate and global scale of impact of human influence on the Earth System (Steffen et al., 2016; Waters et al., 2016) has led many scientists to call for an acknowledgement that the Earth has entered a new geological epoch: the Anthropocene.
- "Global Annual Mean Surface Air Temperature Change". NASA. Retrieved 23 February 2020.
- USGCRP Chapter 3 2017 Figure 3.1 panel 2, Figure 3.3 panel 5.
- Gleick, 7 January 2017; "Scientific Consensus: Earth's Climate is Warming". Climate Change: Vital Signs of the Planet. NASA JPL. Archived from the original on 28 March 2020. Retrieved 29 March 2020.
- Olivier & Peters 2019, p. 14, 16–17.
- IPCC AR5 WG2 Technical Summary 2014, pp. 44–46; D'Odorico et al. 2013.
- Campbella et al. 2016; National Research Council 2012, pp. 26–27.
- IPCC SR15 Ch1 2018, p. 64: Sustained net zero anthropogenic emissions of CO2 and declining net anthropogenic non-CO2 radiative forcing over a multi-decade period would halt anthropogenic global warming over that period, although it would not halt sea level rise or many other aspects of climate system adjustment.
- Trenberth & Fasullo 2016
- IPCC SR15 Summary for Policymakers 2018, p. 7: Future climate-related risks ... are larger if global warming exceeds 1.5 °C (2.7 °F) before returning to that level by 2100 than if global warming gradually stabilizes at 1.5°C. ... Some impacts may be long-lasting or irreversible, such as the loss of some ecosystems (high confidence).
- Climate Action Tracker 2019, p. 1: Under current pledges, the world will warm by 2.8°C by the end of the century, close to twice the limit they agreed in Paris. Governments are even further from the Paris temperature limit in terms of their real-world action, which would see the temperature rise by 3°C.; United Nations Environment Programme 2019, p. 27.
- IPCC SR15 Ch2 2018, p. 95: In model pathways with no or limited overshoot of 1.5°C, global net anthropogenic CO2 emissions decline by about 45% from 2010 levels by 2030 (40–60% interquartile range), reaching net zero around 2050 (2045–2055 interquartile range); Rogelj et al. 2015.
- Neukom et al. 2019.
- EPA 2016: The U.S. Global Change Research Program, the National Academy of Sciences, and the Intergovernmental Panel on Climate Change (IPCC) have each independently concluded that warming of the climate system in recent decades is "unequivocal". This conclusion is not drawn from any one source of data but is based on multiple lines of evidence, including three worldwide temperature datasets showing nearly identical warming trends as well as numerous other independent indicators of global warming (e.g. rising sea levels, shrinking Arctic sea ice).
- IPCC SR15 Summary for Policymakers 2018, p. 4; WMO 2019, p. 6.
- IPCC SR15 Ch1 2018, p. 81.
- IPCC AR5 WG1 Ch2 2013, p. 162.
- IPCC AR5 WG1 Ch5 2013, p. 386; Neukom et al. 2019.
- IPCC AR5 WG1 Ch5 2013, pp. 389, 399–400: "The PETM [around 55.5–55.3 million years ago] was marked by ... global warming of 4 °C to 7 °C ... Deglacial global warming occurred in two main steps from 17.5 to 14.5 ka [thousand years ago] and 13.0 to 10.0 ka."
- IPCC SR15 Ch1 2018, p. 54.
- IPCC SR15 Ch1 2018, p. 57: This report adopts the 51-year reference period, 1850–1900 inclusive, assessed as an approximation of pre-industrial levels in AR5 ... Temperatures rose by 0.0 °C–0.2 °C from 1720–1800 to 1850–1900 (Hawkins et al., 2017); Hawkins et al. 2017, p. 1844.
- IPCC AR5 WG1 Summary for Policymakers 2013, pp. 4–5: "Global-scale observations from the instrumental era began in the mid-19th century for temperature and other variables ... the period 1880 to 2012 ... multiple independently produced datasets exist."
- Kennedy et al. 2010, p. S26. Figure 2.5.
- "Climate Change: Ocean Heat Content". NOAA. 2018. Archived from the original on 12 February 2019. Retrieved 20 February 2019.
- IPCC AR5 WG1 Ch3 2013, p. 257: "Ocean warming dominates the global energy change inventory. Warming of the ocean accounts for about 93% of the increase in the Earth's energy inventory between 1971 and 2010 (high confidence), with warming of the upper (0 to 700 m) ocean accounting for about 64% of the total.
- Cazenave et al. 2014.
- Kennedy et al. 2010, pp. S26, S59-S60; USGCRP Chapter 1 2017, p. 35.
- IPCC AR4 WG2 Ch1 2007, Sec. 1.3.5.1, p. 99.
- Sévellec & Drijfhout 2018.
- England et al. 2014; Knight et al. 2009.
- Lindsey 2018.
- IPCC SRCCL Summary for Policymakers 2019, p. 7.
- Sutton, Dong & Gregory 2007.
- United States Environmental Protection Agency 2016, p. 5: "Black carbon that is deposited on snow and ice darkens those surfaces and decreases their reflectivity (albedo). This is known as the snow/ice albedo effect. This effect results in the increased absorption of radiation that accelerates melting."
- NOAA, 10 July 2011.
- IPCC AR5 WG1 Ch12 2013, p. 1062; Cohen et al. 2014.
- NASA, 12 September 2018.
- Delworth & Zeng 2012, p. 5; Franzke et al. 2020.
- National Research Council 2012, p. 9.
- IPCC AR5 WG1 Ch10 2013, p. 916.
- Knutson 2017, p. 443; IPCC AR5 WG1 Ch10 2013, pp. 875–876.
- USGCRP 2009, p. 20.
- IPCC AR5 WG1 Summary for Policymakers 2013, pp. 13–14.
- NASA. "The Causes of Climate Change". Climate Change: Vital Signs of the Planet. Archived from the original on 8 May 2019. Retrieved 8 May 2019.
- IPCC AR4 WG1 Ch1 2007, FAQ1.1: "To emit 240 W m−2, a surface would have to have a temperature of around −19 °C (−2 °F). This is much colder than the conditions that actually exist at the Earth's surface (the global mean surface temperature is about 14 °C).
- ACS. "What Is the Greenhouse Effect?". Archived from the original on 26 May 2019. Retrieved 26 May 2019.
- Schmidt et al. 2010; USGCRP Climate Science Supplement 2014, p. 742.
- Wang, Shugart & Lerdau 2017.
- The Guardian, 19 February 2020.
- WMO 2020, p. 5.
- BBC, 10 May 2013; Schiermeier 2015.
- Siegenthaler et al. 2005; Lüthi et al. 2008.
- BBC, 10 May 2013.
- Reisinger & Clark 2018.
- Michigan State University 2014: Nitrous oxide is produced by microbes in almost all soils. In agriculture, N2O is emitted mainly from fertilized soils and animal wastes—wherever nitrogen (N) is readily available.; EPA 2019: Agricultural activities, such as fertilizer use, are the primary source of N2O emissions; Davidson 2009: 2.0% of manure nitrogen and 2.5% of fertilizer nitrogen was converted to nitrous oxide between 1860 and 2005; these percentage contributions explain the entire pattern of increasing nitrous oxide concentrations over this period
- Olivier & Peters 2019, p. 14, 16–17, 23.
- Olivier & Peters 2019, p. 17.
- Oertel et al. 2016: Within the first 30 years after turning forest into agricultural land, 30–35% of the soil carbon stored in the top 7 cm is lost, while below plough depth no changes are recognizable; Union of Concerned Scientists, 9 December 2012: When trees are cut down and burned or allowed to rot, their stored carbon is released into the air as carbon dioxide.
- EPA 2019.
- Davis & Caldeira 2010.
- Bajzelj, Allwood & Cullen 2013.
- IPCC SRCCL Summary for Policymakers 2019, p. 10.
- IPCC SROCC Ch5 2019, p. 450.
- Friedlingstein et al. 2019, p. 1803.
- Ritchie & Roser 2018
- The Sustainability Consortium, 13 September 2018; UN FAO 2016, p. 18.
- Curtis et al. 2018.
- World Resources Institute, 8 December 2019.
- IPCC SRCCL Ch2 2019, p. 172: "The global biophysical cooling alone has been estimated by a larger range of climate models and is −0.10 ± 0.14°C; it ranges from –0.57°C to +0.06°C ... This cooling is essentially dominated by increases in surface albedo: historical land cover changes have generally led to a dominant brightening of land".
- Haywood 2016; McNeill 2017; Samset et al. 2018.
- IPCC AR5 WG1 Ch2 2013, p. 183.
- He et al. 2018; Storelvmo et al. 2016.
- Ramanathan & Carmichael 2008.
- Wild et al. 2005; Storelvmo et al. 2016; Samset et al. 2018.
- Twomey 1977.
- Albrecht 1989.
- USGCRP Chapter 2 2017, p. 78.
- Ramanathan & Carmichael 2008; RIVM 2016.
- Sand et al. 2015.
- USGCRP Chapter 2 2017, p. 78.
- National Research Council 2008, p. 6.
- "Is the Sun causing global warming?". Climate Change: Vital Signs of the Planet. Archived from the original on 5 May 2019. Retrieved 10 May 2019.
- Schmidt, Shindell & Tsigaridis 2014; Fyfe et al. 2016.
- IPCC AR4 WG1 Ch9 2007, pp. 702–703.
- IPCC AR4 WG1 Ch9 2007, pp. 702–703; Randel et al. 2009.
- USGCRP Chapter 2 2017, p. 79
- "Thermodynamics: Albedo". NSIDC. Archived from the original on 11 October 2017. Retrieved 10 October 2017.
- "The study of Earth as an integrated system". Vitals Signs of the Planet. Earth Science Communications Team at NASA's Jet Propulsion Laboratory / California Institute of Technology. 2013. Archived from the original on 26 February 2019..
- USGCRP Chapter 2 2017, pp. 89-90.
- USGCRP Chapter 2 2017, pp. 89-91.
- Wolff et al. 2015: "the nature and magnitude of these feedbacks are the principal cause of uncertainty in the response of Earth's climate (over multi-decadal and longer periods) to a particular emissions scenario or greenhouse gas concentration pathway."
- NASA, 28 May 2013.
- Cohen et al. 2014.
- USGCRP Chapter 2 2017, p. 90.
- NASA, 16 June 2011: "So far, land plants and the ocean have taken up about 55 percent of the extra carbon people have put into the atmosphere while about 45 percent has stayed in the atmosphere. Eventually, the land and oceans will take up most of the extra carbon dioxide, but as much as 20 percent may remain in the atmosphere for many thousands of years."
- Scientific American, 23 January 2018: "Climate change's negative effects on plants will likely outweigh any gains from elevated atmospheric carbon dioxide levels"; IPCC SRCCL Ch2 2019, p. 133.
- Melillo et al. 2017: Our first-order estimate of a warming-induced loss of 190 Pg of soil carbon over the 21st century is equivalent to the past two decades of carbon emissions from fossil fuel burning.
- USGCRP Chapter 2 2017, pp. 93-95.
- Dean et al. 2018.
- Wolff et al. 2015
- IPCC AR5 SYR Glossary 2014, p. 120.
- Carbon Brief, 15 January 2018, "What are the different types of climate models?".
- Carbon Brief, 15 January 2018, "What is a climate model?".
- Carbon Brief, 15 January 2018, "Who does climate modelling around the world?".
- Stott & Kettleborough 2002.
- IPCC AR4 WG1 Ch8 2007, FAQ 8.1.
- Stroeve et al. 2007; National Geographic, 13 August 2019.
- Liepert & Previdi 2009.
- Rahmstorf et al. 2007; Mitchum et al. 2018.
- USGCRP Chapter 15 2017.
- IPCC AR5 SYR Summary for Policymakers 2014, Sec. 2.1.
- IPCC AR5 WG1 Technical Summary 2013, pp. 79–80.
- IPCC AR5 WG1 Technical Summary 2013, p. 57.
- Carbon Brief, 15 January 2018, "What are the inputs and outputs for a climate model?".
- Riahi et al. 2017; Carbon Brief, 19 April 2018.
- IPCC AR5 WG3 Ch5 2014, pp. 379–380.
- Matthews et al. 2009.
- Carbon Brief, 19 April 2018; Meinshausen 2019, p. 462.
- Rogelj et al. 2019.
- IPCC SR15 Summary for Policymakers 2018, p. 12.
- NOAA 2017.
- Hansen et al. 2016; Smithsonian, 26 June 2016.
- USGCRP Chapter 15 2017, p. 415.
- Scientific American, 29 April 2014; Burke & Stott 2017.
- Francis & Vavrus 2012; Sun, Perlwitz & Hoerling 2016; Carbon Brief, 31 January 2019.
- USGCRP Chapter 9 2017, p. 260.
- WCRP Global Sea Level Budget Group 2018.
- IPCC SROCC Ch4 2019, p. 324: GMSL (global mean sea level, red) will rise between 0.43 m (0.29–0.59 m, likely range) (RCP2.6) and 0.84 m (0.61–1.10 m, likely range) (RCP8.5) by 2100 (medium confidence) relative to 1986–2005.
- DeConto & Pollard 2016.
- Bamber et al. 2019.
- Zhang et al. 2008.
- IPCC AR5 WG1 Ch11 2013, p. 995; Wang & Overland 2009.
- IPCC SROCC Summary for Policymakers 2019, p. 18.
- Pistone, Eisenman & Ramanathan 2019.
- Doney et al. 2009.
- Deutsch et al. 2011.
- National Research Council 2011, p. 14; IPCC AR5 WG1 Ch12 2013, pp. 88–89, FAQ 12.3.
- IPCC AR5 WG1 Ch12 2013, p. 1112.
- Crucifix 2016
- McGuire 2010.
- Smith et al. 2009; Levermann et al. 2013.
- IPCC SR15 Ch3 2018, p. 283.
- Turetsky et al. 2019.
- Clark et al. 2008.
- Liu et al. 2017.
- Lenton et al. 2019.
- IPCC SR15 Ch3 2018, p. 218.
- IPCC SRCCL Ch2 2019, p. 133.
- IPCC SRCCL Summary for Policymakers 2019, p. 7; Zeng & Yoon 2009.
- The Washington Post, 30 August 2018.
- Urban 2015.
- Poloczanska et al. 2013.
- Smale et al. 2019.
- UNEP 2010, pp. 4–8.
- IPCC SROCC Ch5 2019, p. 451.
- "Coral Reef Risk Outlook". National Oceanic and Atmospheric Administration. Retrieved 4 April 2020.
At present, local human activities, coupled with past thermal stress, threaten an estimated 75 percent of the world’s reefs. By 2030, estimates predict more than 90% of the world's reefs will be threatened by local human activities, warming, and acidification, with nearly 60% facing high, very high, or critical threat levels.
- Carbon Brief, 7 January 2020.
- IPCC AR5 WG2 Ch28 2014, p. 1596: "Within 50 to 70 years, loss of hunting habitats may lead to elimination of polar bears from seasonally ice-covered areas, where two-thirds of their world population currently live."
- "What a changing climate means for Rocky Mountain National Park". National Park Service. Retrieved 9 April 2020.
- IPCC AR5 WG2 Technical Summary 2014, pp. 93–94, FAQ 7 and 8.
- IPCC AR5 WG2 Technical Summary 2014, pp. 27–30.
- IPCC AR5 WG2 Ch19 2014, p. 1077.
- IPCC AR5 WG2 Ch18 2014, pp. 983, 1008.
- IPCC AR4 SYR 2007, Section 3.3.3: Especially affected systems, sectors and regions Archived 23 December 2018 at the Wayback Machine.
- IPCC AR5 WG2 Ch19 2014, pp. 1073–1080.
- IPCC AR5 WG2 Summary for Policymakers 2014, p. 18.
- IPCC AR5 WG2 Ch7 2014, p. 488.
- IPCC AR5 WG2 Ch7 2014, pp. 491–492.
- IPCC SRCCL Ch5 2019, p. 439.
- Holding et al. 2016; IPCC AR5 WG2 Ch3 2014, pp. 232–233.
- IPCC AR4 SYR 2007, Section 3.3.3: "Especially affected systems, sectors and regions" Archived 23 December 2018 at the Wayback Machine; IPCC AR4 WG2 Ch16 2007, Executive Summary Archived 23 December 2018 at the Wayback Machine.
- UNHCR 2011, p. 3.
- Cattaneo et al. 2019; UN Environment, 25 October 2018.
- Diffenbaugh & Burke 2019; The Guardian, 26 January 2015; Burke, Davis & Diffenbaugh 2018.
- IPCC AR5 WG2 Ch13 2014, pp. 796–797.
- Hallegatte et al. 2016, p. 12.
- IPCC AR5 WG2 Ch13 2014, p. 796.
- Sherwood & Huber 2010.
- IPCC AR5 WG2 Ch11 2014, p. 742; Costello et al. 2009; Watts et al. 2015.
- IPCC AR5 WG2 Ch11 2014, pp. 720–723.
- Costello et al. 2009; Watts et al. 2015; IPCC AR5 WG2 Ch11 2014, p. 713.
- Watts et al. 2019, pp. 1836, 1848.
- Watts et al. 2019, pp. 1841, 1847.
- IPCC AR5 WG2 Summary for Policymakers 2014, p. 20.
- Serdeczny et al. 2016.
- IPCC SRCCL Ch5 2019, pp. 439, 464.
- National Oceanic and Atmospheric Administration. "What is nuisance flooding?". Retrieved 8 April 2020.
- Kabir et al. 2016.
- Van Oldenborgh et al. 2019.
- IPCC AR5 SYR Summary for Policymakers 2014, p. 17, Section 3.
- Gordijn & ten Have 2012
- Friedlingstein et al. 2019, Table 7.
- IPCC AR5 SYR Glossary 2014, p. 125.
- IPCC SR15 Summary for Policymakers 2018, pp. 13–15.
- IPCC SR15 Summary for Policymakers 2018, p. 15.
- United Nations Environment Programme 2019, Table ES.1.
- United Nations Environment Programme 2019, p. 46.
- Teske et al. 2019, p. 163, Table 7.1.
- Ritchie 2019; United Nations Environment Programme 2019, p. XXIV, Fig.ES.5
- The Guardian, 6 April 2020.
- REN21 2020, p. 32, Fig.1.
- Berrill et al. 2016.
- Vox, 20 September 2019.
- Union of Concerned Scientists, 5 March 2013.
- IPCC SR15 Ch4 2018, pp. 324–325.
- Geyer, Stoms & Kallaos 2013.
- IPCC SR15 Ch4 2018, pp. 326–327; Bednar, Obersteiner & Wagner 2019; European Commission, 28 November 2018, p. 188.
- Bui, Mai; Adjiman, Claire S.; Bardow, André; Anthony, Edward J.; Boston, Andy; Brown, Solomon; Fennell, Paul S.; Fuss, Sabine; Galindo, Amparo; Hackett, Leigh A.; Hallett, Jason P. (2018). "Carbon capture and storage (CCS): the way forward". Energy & Environmental Science. 11 (5): 1062–1176. doi:10.1039/C7EE02342A. ISSN 1754-5692.
- World Resources Institute, 8 August 2019: IPCC SRCCL Ch2 2019, pp. 189–193.
- IPCC SR15 Ch4 2018, pp. 327–330.
- New York Times, 1 January 2020; Druckman & Jackson 2016, Fig. 9.3.
- IPCC SR15 Ch2 2018, p. 109.
- Teske, ed. 2019, p. xxiii.
- World Resources Institute, 8 August 2019.
- Bui, Adjiman & Bardow 2018, p. 1068; IPCC SR15 Summary for Policymakers 2018, p. 17.
- United Nations Environment Programme 2019, Table ES.3; Teske, ed. 2019, p. xxvii, Fig.5.
- IPCC SR15 Ch2 2018, p. 131, Figure 2.15; Teske 2019, pp. 409–410.
- IPCC SR15 Ch2 2018, pp. 142–144; United Nations Environment Programme 2019, Table ES.3 & p.49; IPCC AR5 WG3 Ch8 2014, 613-616.
- IPCC AR5 WG3 Ch9 2014, pp. 686–694.
- BBC, 17 December 2018.
- IPCC AR5 WG3 Ch10 2014, pp. 753–762; IRENA 2019, p. 49.
- World Resources Institute, December 2019, p. 1.
- World Resources Institute, December 2019, p. 10.
- Union of Concerned Scientists, 8 January 2017; Hagmann, Ho & Loewenstein 2019.
- World Bank, June 2019, p. 12, Box 1.
- National Conference of State Legislators, 17 April 2020; European Parliament, February 2020.
- REN21 2019, p. 34.
- Global Subsidies Initiative 2019, p. iv
- International Institute for Sustainable Development 2019.
- ICCT 2019, p. iv; Natural Resources Defense Council, 29 September 2017.
- Carbon Brief, 4 Jan 2017.
- Pacific Environment, 3 October 2018; Ristroph 2019.
- UNCTAD 2009.
- IPCC SR15 Ch4 2018, pp. 396-397.
- IPCC AR5 SYR 2014, p. 112.
- NASA's Global Climate Change. "Global climate change adaptation and mitigation". Climate Change: Vital Signs of the Planet. Archived from the original on 3 April 2019. Retrieved 12 April 2019.
- IPCC SR15 Ch5 2018, p. 457.
- Cole 2008.
- IPCC AR4 WG2 Ch19 2007, p. 796.
- IPCC AR5 SYR 2014, p. 54.
- The Royal Society 2009; Gardiner & McKinnon 2019.
- Lawrence et al. 2018.
- Mercure et al. 2018.
- Rauner et al. 2020.
- O'Sullivan, Overland & Sandalow 2017, pp. 11–12.
- UNFCCC, "What is the United Nations Framework Convention on Climate Change?"
- UNFCCC 1992, Article 2.
- IPCC AR4 WG3 Ch1 2007, Executive summary.
- UNFCCC, "What are United Nations Climate Change Conferences?".
- Kyoto Protocol 1997; Liverman 2009, p. 290.
- Kyoto Protocol 1997.
- Dessai 2001, p. 5.
- Dessai 2001, p. 4.
- Grubb 2003.
- Liverman 2009, p. 290.
- Friedlingstein et al. 2019.
- Müller 2010; The New York Times, 25 May 2015; UNFCCC: Copenhagen 2009.
- EUobserver, 20 December 2009.
- UNFCCC: Copenhagen 2009.
- Climate Focus 2015, p. 3; Carbon Brief, 8 October 2018.
- Climate Focus 2015, p. 5.
- "Status of Treaties, United Nations Framework Convention on Climate Change". United Nations Treaty Collection. Retrieved 20 November 2019.; Salon, 25 September 2019.
- The New York Times, 4 November 2019.
- BBC, 1 May 2019; Vice, 2 May 2019.
- The Verge, 27 December 2019.
- The Guardian, 28 November 2019
- Forbes, 3 February 2020.
- Goyal et al. 2019.
- UN Environment, 20 November 2017.
- "CO2 is making Earth greener—for now". NASA. Retrieved 28 February 2020.
- Cook et al. 2016.
- NRC 2008, p. 2; Oreskes 2007, p. 68; Gleick, 7 January 2017
- Royal Society 2005.
- IPCC AR5 WG1 Summary for Policymakers 2013, p. 17, D.3.
- IPCC SR15 Ch1 2018, p. 53.
- Joint statement of the G8+5 Academies (2009); Gleick, 7 January 2017.
- Ripple et al. 2017.
- The Independent, 5 November 2019.
- Ripple et al. 2019.
- Weart "The Public and Climate Change (since 1980)".
- Newell 2006, p. 80; Yale Climate Connections, 2 November 2010.
- Shindell et al. 2006.
- Pew Research Center 2015.
- Gallup, 20 April 2011.
- Gallup, 22 April 2011.
- Pew Research Center, 24 June 2013.
- The Guardian, 15 September 2019.
- Stover 2014.
- Dunlap & McCright 2011, pp. 144, 155; Björnberg et al. 2017.
- Oreskes & Conway 2010; Björnberg et al. 2017.
- O’Neill & Boykoff 2010; Björnberg et al. 2017.
- Björnberg et al. 2017.
- Dunlap & McCright 2015, p. 308.
- Dunlap & McCright 2011, p. 146.
- Harvey et al. 2018.
- Gunningham 2018.
- The New York Times, 29 April 2017.
- The Guardian, 19 March 2019; Boulianne, Lalancette & Ilkiw 2020.
- BBC, 16 April 2019; Euronews, 22 June 2019; Deutsche Welle, 22 June 2019.
- Setzer & Byrnes 2019.
- Calel 2014; Fleming 2008, Fourier.
- Barry 1978; Archer & Pierrehumbert 2013, p. 5.
- Archer & Pierrehumbert 2013, pp. 10–14.
- Tyndall 1861.
- Archer & Pierrehumbert 2013, pp. 39–42; Fleming 2008, Tyndall. In 1856 Eunice Newton Foote experimented using glass cylinders filled with different gases heated by sunlight, but her apparatus could not distinguish the infrared greenhouse effect. She found moist air warmed more than dry air, and CO
2 warmed most, so she concluded higher levels of this in the past would have increased temperatures: Huddleston 2019. - Lapenis 1998.
- Weart "The Carbon Dioxide Greenhouse Effect"; Fleming 2008, Arrhenius.
- Callendar 1938; Fleming 2007.
- Weart "Suspicions of a Human-Caused Greenhouse (1956–1969)".
- Weart "The Public and Climate Change: The Summer of 1988", "News reporters gave only a little attention ...".
- Weart 2013, p. 3567.
- NASA, 5 December 2008.
- Joo et al. 2015.
- NOAA, 17 June 2015: "when scientists or public leaders talk about global warming these days, they almost always mean human-caused warming"; IPCC AR5 SYR Glossary 2014, p. 120: "Climate change refers to a change in the state of the climate that can be identified (e.g., by using statistical tests) by changes in the mean and/or the variability of its properties and that persists for an extended period, typically decades or longer. Climate change may be due to natural internal processes or external forcings such as modulations of the solar cycles, volcanic eruptions and persistent anthropogenic changes in the composition of the atmosphere or in land use."
- NASA, 7 July 2020; Shaftel 2016: " 'Climate change' and 'global warming' are often used interchangeably but have distinct meanings. ... Global warming refers to the upward temperature trend across the entire Earth since the early 20th century ... Climate change refers to a broad range of global phenomena ...[which] include the increased temperature trends described by global warming."; Associated Press, 22 September 2015: "The terms global warming and climate change can be used interchangeably. Climate change is more accurate scientifically to describe the various effects of greenhouse gases on the world because it includes extreme weather, storms and changes in rainfall patterns, ocean acidification and sea level.".
- Hodder & Martin 2009; BBC Science Focus Magazine, 3 February 2020.
- The Guardian, 17 May 2019; BBC Science Focus Magazine, 3 February 2020.
- USA Today, 21 November 2019.
Sources
IPCC reports
AR4 Working Group I Report
- IPCC (2007). Solomon, S.; Qin, D.; Manning, M.; Chen, Z.; et al. (eds.). Climate Change 2007: The Physical Science Basis. Contribution of Working Group I to the Fourth Assessment Report of the Intergovernmental Panel on Climate Change. Cambridge University Press. ISBN 978-0-521-88009-1. (pb: 978-0-521-70596-7).
- Le Treut, H.; Somerville, R.; Cubasch, U.; Ding, Y.; et al. (2007). "Chapter 1: Historical Overview of Climate Change Science" (PDF). IPCC AR4 WG1 2007. pp. 93–127.
- Randall, D. A.; Wood, R. A.; Bony, S.; Colman, R.; et al. (2007). "Chapter 8: Climate Models and their Evaluation" (PDF). IPCC AR4 WG1 2007. pp. 589–662.
- Hegerl, G. C.; Zwiers, F. W.; Braconnot, P.; Gillett, N. P.; et al. (2007). "Chapter 9: Understanding and Attributing Climate Change" (PDF). IPCC AR4 WG1 2007. pp. 663–745.
AR4 Working Group II Report
- IPCC (2007). Parry, M. L.; Canziani, O. F.; Palutikof, J. P.; van der Linden, P. J.; et al. (eds.). Climate Change 2007: Impacts, Adaptation and Vulnerability. Contribution of Working Group II to the Fourth Assessment Report of the Intergovernmental Panel on Climate Change. Cambridge University Press. ISBN 978-0-521-88010-7. (pb: 978-0-521-70597-4).
- Rosenzweig, C.; Casassa, G.; Karoly, D. J.; Imeson, A.; et al. (2007). "Chapter 1: Assessment of observed changes and responses in natural and managed systems" (PDF). IPCC AR4 WG2 2007. pp. 79–131.
- Mimura, N.; Nurse, L.; McLean, R. F.; Agard, J.; et al. (2007). "Chapter 16: Small islands" (PDF). IPCC AR4 WG2 2007. pp. 687–716.
- Schneider, S. H.; Semenov, S.; Patwardhan, A.; Burton, I.; et al. (2007). "Chapter 19: Assessing key vulnerabilities and the risk from climate change" (PDF). IPCC AR4 WG2 2007. pp. 779–810.
AR4 Working Group III Report
- IPCC (2007). Metz, B.; Davidson, O. R.; Bosch, P. R.; Dave, R.; et al. (eds.). Climate Change 2007: Mitigation of Climate Change. Contribution of Working Group III to the Fourth Assessment Report of the Intergovernmental Panel on Climate Change. Cambridge University Press. ISBN 978-0-521-88011-4. (pb: 978-0-521-70598-1).
- Rogner, H.-H.; Zhou, D.; Bradley, R.; Crabbé, P.; et al. (2007). "Chapter 1: Introduction" (PDF). IPCC AR4 WG3 2007. pp. 95–116.
AR4 Synthesis Report
- IPCC (2007). Core Writing Team; Pachuri, R. K.; Reisinger, A. (eds.). Climate Change 2007: Synthesis Report. Contribution of Working Groups I, II and III to the Fourth Assessment Report of the Intergovernmental Panel on Climate Change. IPCC. ISBN 978-92-9169-122-7.
AR5 Working Group I Report
- IPCC (2013). Stocker, T. F.; Qin, D.; Plattner, G.-K.; Tignor, M.; et al. (eds.). Climate Change 2013: The Physical Science Basis (PDF). Contribution of Working Group I to the Fifth Assessment Report of the Intergovernmental Panel on Climate Change. Cambridge, United Kingdom and New York, NY, USA: Cambridge University Press. ISBN 978-1-107-05799-9. (pb: 978-1-107-66182-0). https://www.ipcc.ch/report/ar5/wg1/
- IPCC (2013). "Summary for Policymakers" (PDF). IPCC AR5 WG1 2013.
- Stocker, T. F.; Qin, D.; Plattner, G.-K.; Alexander, L. V.; et al. (2013). "Technical Summary" (PDF). IPCC AR5 WG1 2013. pp. 33–115.
- Hartmann, D. L.; Klein Tank, A. M. G.; Rusticucci, M.; Alexander, L. V.; et al. (2013). "Chapter 2: Observations: Atmosphere and Surface" (PDF). IPCC AR5 WG1 2013. pp. 159–254.
- Rhein, M.; Rintoul, S. R.; Aoki, S.; Campos, E.; et al. (2013). "Chapter 3: Observations: Ocean" (PDF). IPCC AR5 WG1 2013. pp. 255–315.
- Masson-Delmotte, V.; Schulz, M.; Abe-Ouchi, A.; Beer, J.; et al. (2013). "Chapter 5: Information from Paleoclimate Archives" (PDF). IPCC AR5 WG1 2013. pp. 383–464.
- Bindoff, N. L.; Stott, P. A.; AchutaRao, K. M.; Allen, M. R.; et al. (2013). "Chapter 10: Detection and Attribution of Climate Change: from Global to Regional" (PDF). IPCC AR5 WG1 2013. pp. 867–952.
- Kirtman, B.; Power, S.; Adedoyin, J. A.; Boer, G. J.; et al. (2013). "Chapter 11: Near-term Climate Change: Projections and Predictability" (PDF). IPCC AR5 WG1 2013. pp. 953–1028.
- Collins, M.; Knutti, R.; Arblaster, J. M.; Dufresne, J.-L.; et al. (2013). "Chapter 12: Long-term Climate Change: Projections, Commitments and Irreversibility" (PDF). IPCC AR5 WG1 2013. pp. 1029–1136.
AR5 Working Group II Report
- IPCC (2014). Field, C. B.; Barros, V. R.; Dokken, D. J.; Mach, K. J.; et al. (eds.). Climate Change 2014: Impacts, Adaptation, and Vulnerability. Part A: Global and Sectoral Aspects. Contribution of Working Group II to the Fifth Assessment Report of the Intergovernmental Panel on Climate Change. Cambridge University Press. ISBN 978-1-107-05807-1. (pb: 978-1-107-64165-5). Chapters 1–20, SPM, and Technical Summary.
- IPCC (2014). "Summary for Policymakers" (PDF). IPCC AR5 WG2 A 2014. pp. 1–32.
- Field, C. B.; Barros, V. R.; Mach, K. J.; Mastrandrea, M. D.; et al. (2014). "Technical Summary" (PDF). IPCC AR5 WG2 A 2014. pp. 35–94.
- Jiménez Cisneros, B. E.; Oki, T.; Arnell, N. W.; Benito, G.; et al. (2014). "Chapter 3: Freshwater Resources" (PDF). IPCC AR5 WG2 A 2014. pp. 229–269.
- Porter, J. R.; Xie, L.; Challinor, A. J.; Cochrane, K.; et al. (2014). "Chapter 7: Food Security and Food Production Systems" (PDF). IPCC AR5 WG2 A 2014. pp. 485–533.
- Smith, K. R.; Woodward, A.; Campbell-Lendrum, D.; Chadee, D. D.; et al. (2014). "Chapter 11: Human Health: Impacts, Adaptation, and Co-Benefits" (PDF). In IPCC AR5 WG2 A 2014. pp. 709–754.
- Olsson, L.; Opondo, M.; Tschakert, P.; Agrawal, A.; et al. (2014). "Chapter 13: Livelihoods and Poverty" (PDF). IPCC AR5 WG2 A 2014. pp. 793–832.
- Cramer, W.; Yohe, G. W.; Auffhammer, M.; Huggel, C.; et al. (2014). "Chapter 18: Detection and Attribution of Observed Impacts" (PDF). IPCC AR5 WG2 A 2014. pp. 979–1037.
- Oppenheimer, M.; Campos, M.; Warren, R.; Birkmann, J.; et al. (2014). "Chapter 19: Emergent Risks and Key Vulnerabilities" (PDF). IPCC AR5 WG2 A 2014. pp. 1039–1099.
- IPCC (2014). Barros, V. R.; Field, C. B.; Dokken, D. J.; Mach, K. J.; et al. (eds.). Climate Change 2014: Impacts, Adaptation, and Vulnerability. Part B: Regional Aspects (PDF). Contribution of Working Group II to the Fifth Assessment Report of the Intergovernmental Panel on Climate Change. Cambridge, United Kingdom and New York, NY, USA: Cambridge University Press. ISBN 978-1-107-05816-3. (pb: 978-1-107-68386-0). Chapters 21–30, Annexes, and Index.
- Larsen, J. N.; Anisimov, O. A.; Constable, A.; Hollowed, A. B.; et al. (2014). "Chapter 28: Polar Regions" (PDF). IPCC AR5 WG2 B 2014. pp. 1567–1612.
AR5 Working Group III Report
- IPCC (2014). Edenhofer, O.; Pichs-Madruga, R.; Sokona, Y.; Farahani, E.; et al. (eds.). Climate Change 2014: Mitigation of Climate Change. Contribution of Working Group III to the Fifth Assessment Report of the Intergovernmental Panel on Climate Change. Cambridge, United Kingdom and New York, NY, USA: Cambridge University Press. ISBN 978-1-107-05821-7. (pb: 978-1-107-65481-5).
- Blanco, G.; Gerlagh, R.; Suh, S.; Barrett, J.; et al. (2014). "Chapter 5: Drivers, Trends and Mitigation" (PDF). IPCC AR5 WG3 2014. pp. 351–411.
- Creutzig, F.; Cruz-Núñez, X.; D’Agosto, M.; Dimitriu, D.; et al. (2014). "Chapter 8: Transport" (PDF). IPCC AR5 WG3 2014.
- Lucon, O.; Ürge-Vorsatz, D.; Ahmed, A.; Akbari, H.; et al. (2014). "Chapter 9: Buildings" (PDF). IPCC AR5 WG3 2014.
- Fischedick, M.; Roy, J.; Abdel-Aziz, A.; Acquaye, A.; et al. (2014). "Chapter 10: Industry" (PDF). IPCC AR5 WG3 2014.
AR5 Synthesis Report
- IPCC AR5 SYR (2014). The Core Writing Team; Pachauri, R. K.; Meyer, L. A. (eds.). Climate Change 2014: Synthesis Report. Contribution of Working Groups I, II and III to the Fifth Assessment Report of the Intergovernmental Panel on Climate Change. Geneva, Switzerland: IPCC.
- IPCC (2014). "Summary for Policymakers" (PDF). IPCC AR5 SYR 2014.
- IPCC (2014). "Annex II: Glossary" (PDF). IPCC AR5 SYR 2014.
Special Report: Global Warming of 1.5 ºC
- IPCC (2018). Masson-Delmotte, V.; Zhai, P.; Pörtner, H.-O.; Roberts, D.; et al. (eds.). Global Warming of 1.5°C. An IPCC Special Report on the impacts of global warming of 1.5°C above pre-industrial levels and related global greenhouse gas emission pathways, in the context of strengthening the global response to the threat of climate change, sustainable development, and efforts to eradicate poverty (PDF). Intergovernmental Panel on Climate Change. https://www.ipcc.ch/sr15/.
- IPCC (2018). "Summary for Policymakers" (PDF). IPCC SR15 2018. pp. 3–24.
- Allen, M. R.; Dube, O. P.; Solecki, W.; Aragón-Durand, F.; et al. (2018). "Chapter 1: Framing and Context" (PDF). IPCC SR15 2018. pp. 49–91.
- Rogelj, J.; Shindell, D.; Jiang, K.; Fifta, S.; et al. (2018). "Chapter 2: Mitigation Pathways Compatible with 1.5°C in the Context of Sustainable Development" (PDF). IPCC SR15 2018. pp. 93–174.
- Hoegh-Guldberg, O.; Jacob, D.; Taylor, M.; Bindi, M.; et al. (2018). "Chapter 3: Impacts of 1.5ºC Global Warming on Natural and Human Systems" (PDF). IPCC SR15 2018. pp. 175–311.
- de Coninck, H.; Revi, A.; Babiker, M.; Bertoldi, P.; et al. (2018). "Chapter 4: Strengthening and Implementing the Global Response" (PDF). IPCC SR15 2018. pp. 313–443.
- Roy, J.; Tschakert, P.; Waisman, H.; Abdul Halim, S.; et al. (2018). "Chapter 5: Sustainable Development, Poverty Eradication and Reducing Inequalities" (PDF). IPCC SR15 2018. pp. 445–538.
Special Report: Climate change and Land
- IPCC (2019). Shukla, P. R.; Skea, J.; Calvo Buendia, E.; Masson-Delmotte, V.; et al. (eds.). IPCC Special Report on Climate Change, Desertification, Land Degradation, Sustainable Land Management, Food Security, and Greenhouse gas fluxes in Terrestrial Ecosystems (PDF). In press.
- IPCC (2019). "Summary for Policymakers" (PDF). IPCC SRCCL 2019. pp. 3–34.
- Jia, G.; Shevliakova, E.; Artaxo, P. E.; De Noblet-Ducoudré, N.; et al. (2019). "Chapter 2: Land-Climate Interactions" (PDF). IPCC SRCCL 2019. pp. 131–247.
- Mbow, C.; Rosenzweig, C.; Barioni, L. G.; Benton, T.; et al. (2019). "Chapter 5: Food Security" (PDF). IPCC SRCCL 2019. pp. 437–550.
Special Report: The Ocean and Cryosphere in a Changing Climate
- IPCC (2019). Pörtner, H.-O.; Roberts, D. C.; Masson-Delmotte, V.; Zhai, P.; et al. (eds.). IPCC Special Report on the Ocean and Cryosphere in a Changing Climate (PDF). In press.
- IPCC (2019). "Summary for Policymakers" (PDF). IPCC SROCC 2019. pp. 3–35.
- Oppenheimer, M.; Glavovic, B.; Hinkel, J.; van de Wal, R.; et al. (2019). "Chapter 4: Sea Level Rise and Implications for Low Lying Islands, Coasts and Communities" (PDF). IPCC SROCC 2019. pp. 321–445.
- Bindoff, N. L.; Cheung, W. W. L.; Kairo, J. G.; Arístegui, J.; et al. (2019). "Chapter 5: Changing Ocean, Marine Ecosystems, and Dependent Communities" (PDF). IPCC SROCC 2019. pp. 447–587.
Other peer-reviewed sources
- Albrecht, Bruce A. (1989). "Aerosols, Cloud Microphysics, and Fractional Cloudiness". Science. 245 (4923): 1227–1239. Bibcode:1989Sci...245.1227A. doi:10.1126/science.245.4923.1227. PMID 17747885. S2CID 46152332.
- Bajzelj, B.; Allwood, J.; Cullen, J. (2013). "Designing Climate Change Mitigation Plans That Add Up". Environmental Science and Technology. 47 (14): 8062–8069. Bibcode:2013EnST...47.8062B. doi:10.1021/es400399h. PMC 3797518. PMID 23799265.
- Bamber, Jonathan L.; Oppenheimer, Michael; Kopp, Robert E.; Aspinall, Willy P.; Cooke, Roger M. (2019). "Ice sheet contributions to future sea-level rise from structured expert judgment". Proceedings of the National Academy of Sciences. 116 (23): 11195–11200. doi:10.1073/pnas.1817205116. ISSN 0027-8424. PMID 31110015.
- Barry, R. G. (1978). "H.-B. de Saussure: The First Mountain Meteorologist". Bulletin of the American Meteorological Society. 59 (6): 702–705. Bibcode:1978BAMS...59..702B. doi:10.1175/1520-0477(1978)059<0702:hbdstf>2.0.co;2. ISSN 0003-0007.
- Bednar, Johannes; Obersteiner, Michael; Wagner, Fabian (2019). "On the financial viability of negative emissions". Nature Communications. 10 (1): 1783. Bibcode:2019NatCo..10.1783B. doi:10.1038/s41467-019-09782-x. ISSN 2041-1723. PMC 6467865. PMID 30992434.
- Berrill, P.; Arvesen, A.; Scholz, Y.; Gils, H. C.; et al. (2016). "Environmental impacts of high penetration renewable energy scenarios for Europe". Environmental Research Letters. 11 (1): 014012. Bibcode:2016ERL....11a4012B. doi:10.1088/1748-9326/11/1/014012.
- Björnberg, Karin Edvardsson; Karlsson, Mikael; Gilek, Michael; Hansson, Sven Ove (2017). "Climate and environmental science denial: A review of the scientific literature published in 1990–2015". Journal of Cleaner Production. 167: 229–241. doi:10.1016/j.jclepro.2017.08.066. ISSN 0959-6526.
- Boulianne, Shelley; Lalancette, Mireille; Ilkiw, David (2020). ""School Strike 4 Climate": Social Media and the International Youth Protest on Climate Change". Media and Communication. 8 (2): 208–218. doi:10.17645/mac.v8i2.2768. ISSN 2183-2439.
- Bui, M.; Adjiman, C.; Bardow, A. (2018). "Carbon capture and storage (CCS): the way forward". Energy & Environmental Science. 11 (5): 1062–1176. doi:10.1039/c7ee02342a.
- Burke, Claire; Stott, Peter (2017). "Impact of Anthropogenic Climate Change on the East Asian Summer Monsoon". Journal of Climate. 30 (14): 5205–5220. arXiv:1704.00563. Bibcode:2017JCli...30.5205B. doi:10.1175/JCLI-D-16-0892.1. ISSN 0894-8755. S2CID 59509210.
- Burke, Marshall; Davis, W. Matthew; Diffenbaugh, Noah S (2018). "Large potential reduction in economic damages under UN mitigation targets". Nature. 557 (7706): 549–553. Bibcode:2018Natur.557..549B. doi:10.1038/s41586-018-0071-9. ISSN 1476-4687. PMID 29795251. S2CID 43936274.
- Callendar, G. S. (1938). "The artificial production of carbon dioxide and its influence on temperature". Quarterly Journal of the Royal Meteorological Society. 64 (275): 223–240. Bibcode:1938QJRMS..64..223C. doi:10.1002/qj.49706427503.
- Campbella, Bruce M.; Vermeulen, Sonja J.; Aggarwa, Pramod K.; Corner-Dolloff, Caitlin; et al. (2016). "Reducing risks to food security from climate change". Global Food Security. 11: 34–43. doi:10.1016/j.gfs.2016.06.002.
- Cattaneo, Cristina; Beine, Michel; Fröhlich, Christiane J.; Kniveton, Dominic; et al. (2019). "Human Migration in the Era of Climate Change". Review of Environmental Economics and Policy. 13 (2): 189–206. doi:10.1093/reep/rez008. ISSN 1750-6816.
- Cazenave, Anny; Dieng, Habib-Boubacar; Meyssignac, Benoit; von Schuckmann, Karina; et al. (2014). "The rate of sea-level rise". Nature Climate Change. 4 (5): 358–361. Bibcode:2014NatCC...4..358C. doi:10.1038/nclimate2159. ISSN 1758-6798. S2CID 85396999.
- Cohen, Judah; Screen, James; Furtado, Jason C.; Barlow, Mathew; et al. (2014). "Recent Arctic amplification and extreme mid-latitude weather" (PDF). Nature Geoscience. 7 (9): 627–637. Bibcode:2014NatGe...7..627C. doi:10.1038/ngeo2234. ISSN 1752-0908.
- Cole, Daniel H. (2008). "Climate Change, Adaptation, and Development". UCLA Journal of Environmental Law and Policy. 26 (1).
- Cook, John; Oreskes, Naomi; Doran, Peter T.; Anderegg, William R. L.; et al. (2016). "Consensus on consensus: a synthesis of consensus estimates on human-caused global warming". Environmental Research Letters. 11 (4): 048002. Bibcode:2016ERL....11d8002C. doi:10.1088/1748-9326/11/4/048002.
- Costello, Anthony; Abbas, Mustafa; Allen, Adriana; Ball, Sarah; et al. (2009). "Managing the health effects of climate change". The Lancet. 373 (9676): 1693–1733. doi:10.1016/S0140-6736(09)60935-1. PMID 19447250. S2CID 205954939. Archived from the original on 13 August 2017.
- Curtis, P.; Slay, C.; Harris, N.; Tyukavina, A.; et al. (2018). "Classifying drivers of global forest loss". Science. 361 (6407): 1108–1111. Bibcode:2018Sci...361.1108C. doi:10.1126/science.aau3445. PMID 30213911. S2CID 52273353.
- Davidson, Eric (2009). "The contribution of manure and fertilizer nitrogen to atmospheric nitrous oxide since 1860". Nature Geoscience. 2: 659–662. doi:10.1016/j.chemer.2016.04.002.
- Davis, S. J.; Caldeira, K. (2010). "Consumption-based accounting of CO2 emissions". Proceedings of the National Academy of Sciences. 107 (12): 5687–5692. Bibcode:2010PNAS..107.5687D. doi:10.1073/pnas.0906974107. PMC 2851800. PMID 20212122.
- DeConto, Robert M.; Pollard, David (2016). "Contribution of Antarctica to past and future sea-level rise". Nature. 531 (7596): 591–597. Bibcode:2016Natur.531..591D. doi:10.1038/nature17145. ISSN 1476-4687. PMID 27029274. S2CID 205247890.
- Dean, Joshua F.; Middelburg, Jack J.; Röckmann, Thomas; Aerts, Rien; et al. (2018). "Methane Feedbacks to the Global Climate System in a Warmer World". Reviews of Geophysics. 56 (1): 207–250. doi:10.1002/2017RG000559. ISSN 1944-9208.
- Delworth, Thomas L.; Zeng, Fanrong (2012). "Multicentennial variability of the Atlantic meridional overturning circulation and its climatic influence in a 4000 year simulation of the GFDL CM2.1 climate model". Geophysical Research Letters. 39 (13): n/a. Bibcode:2012GeoRL..3913702D. doi:10.1029/2012GL052107. ISSN 1944-8007.
- Deutsch, Curtis; Brix, Holger; Ito, Taka; Frenzel, Hartmut; et al. (2011). "Climate-Forced Variability of Ocean Hypoxia" (PDF). Science. 333 (6040): 336–339. Bibcode:2011Sci...333..336D. doi:10.1126/science.1202422. PMID 21659566. S2CID 11752699. Archived (PDF) from the original on 9 May 2016.
- Diffenbaugh, Noah S.; Burke, Marshall (2019). "Global warming has increased global economic inequality". Proceedings of the National Academy of Sciences. 116 (20): 9808–9813. doi:10.1073/pnas.1816020116. ISSN 0027-8424. PMC 6525504. PMID 31010922.
- D'Odorico, Paolo; Bhattachan, Abinash; Davis, Kyle F.; Ravi, Sujith; Runyan, Christiane W. (2013). "Global desertification: Drivers and feedbacks". Advances in Water Resources. 51: 326–344. Bibcode:2013AdWR...51..326D. doi:10.1016/j.advwatres.2012.01.013.
- Doney, Scott C.; Fabry, Victoria J.; Feely, Richard A.; Kleypas, Joan A. (2009). "Ocean Acidification: The Other CO2 Problem". Annual Review of Marine Science. 1 (1): 169–192. Bibcode:2009ARMS....1..169D. doi:10.1146/annurev.marine.010908.163834. PMID 21141034. S2CID 402398.
- England, Matthew H.; McGregor, Shayne; Spence, Paul; Meehl, Gerald A.; et al. (2014). "Recent intensification of wind-driven circulation in the Pacific and the ongoing warming hiatus" (PDF). Nature Climate Change. 4 (3): 222–227. Bibcode:2014NatCC...4..222E. CiteSeerX 10.1.1.683.5365. doi:10.1038/nclimate2106. Archived (PDF) from the original on 9 August 2017. Retrieved 29 January 2019.
- Fahey, D. W.; Doherty, S. J.; Hibbard, K. A.; Romanou, A.; Taylor, P. C. (2017). "Chapter 2: Physical Drivers of Climate Change" (PDF). In USGCRP2017.
- Knutson, T.; Kossin, J. P.; Mears, C.; Perlwitz, J.; Wehner, M. F. (2017). "Chapter 3: Detection and Attribution of Climate Change" (PDF). In USGCRP2017.
- Francis, Jennifer A.; Vavrus, Stephen (2012). "Evidence linking Arctic amplification to extreme weather in mid-latitudes". Geophysical Research Letters. 39 (6): n/a. Bibcode:2012GeoRL..39.6801F. doi:10.1029/2012GL051000.
- Franzke, Christian L. E.; Barbosa, Susana; Blender, Richard; Fredriksen, Hege-Beate; et al. (2020). "The Structure of Climate Variability Across Scales". Reviews of Geophysics. 58 (2): e2019RG000657. Bibcode:2020RvGeo..5800657F. doi:10.1029/2019RG000657. ISSN 1944-9208.
- Friedlingstein, Pierre; Jones, Matthew W.; O'Sullivan, Michael; Andrew, Robbie M.; et al. (2019). "Global Carbon Budget 2019". Earth System Science Data. 11 (4): 1783–1838. Bibcode:2019ESSD...11.1783F. doi:10.5194/essd-11-1783-2019. ISSN 1866-3508.
- Fyfe, John C.; Meehl, Gerald A.; England, Matthew H.; Mann, Michael E.; et al. (2016). "Making sense of the early-2000s warming slowdown" (PDF). Nature Climate Change. 6 (3): 224–228. Bibcode:2016NatCC...6..224F. doi:10.1038/nclimate2938. Archived (PDF) from the original on 7 February 2019.
- Gardiner, Stephen; McKinnon, Catriona (2019). "The Justice and Legitimacy of Geoengineering". Critical Review of International Social and Political Philosophy. 23 (5): 557–563. doi:10.1080/13698230.2019.1693157. ISSN 1369-8230.
- Geyer, R.; Stoms, D.; Kallaos, J. (2013). "Spatially-Explicit Life Cycle Assessment of Sun-to-Wheels Transportation Pathways in the U.S.". Environmental Science Technology. 47 (2): 1170–1176. Bibcode:2013EnST...47.1170G. doi:10.1021/es302959h. PMID 23268715.
- Gordijn, Bert; ten Have, Henk (2012). "Ethics of mitigation, adaptation and geoengineering". Medicine, Health Care and Philosophy. 15 (1): 1–2. doi:10.1007/s11019-011-9374-4. ISSN 1572-8633.
- Goyal, Rishav; England, Matthew H; Sen Gupta, Alex; Jucker, Martin (2019). "Reduction in surface climate change achieved by the 1987 Montreal Protocol". Environmental Research Letters. 14 (12): 124041. Bibcode:2019ERL....14l4041G. doi:10.1088/1748-9326/ab4874. ISSN 1748-9326.
- Grubb, M. (2003). "The Economics of the Kyoto Protocol" (PDF). World Economics. 4 (3): 144–145. Archived from the original (PDF) on 4 September 2012.
- Gunningham, Neil (2018). "Mobilising civil society: can the climate movement achieve transformational social change?" (PDF). Interface: A Journal for and About Social Movements. 10. Archived (PDF) from the original on 12 April 2019. Retrieved 12 April 2019.
- Hagmann, David; Ho, Emily H.; Loewenstein, George (2019). "Nudging out support for a carbon tax". Nature Climate Change. 9 (6): 484–489. Bibcode:2019NatCC...9..484H. doi:10.1038/s41558-019-0474-0. S2CID 182663891.
- Hansen, James; Sato, Makiko; Hearty, Paul; Ruedy, Reto; et al. (2016). "Ice melt, sea level rise and superstorms: evidence from paleoclimate data, climate modeling, and modern observations that 2 °C global warming could be dangerous". Atmospheric Chemistry and Physics. 16 (6): 3761–3812. arXiv:1602.01393. Bibcode:2016ACP....16.3761H. doi:10.5194/acp-16-3761-2016. ISSN 1680-7316. S2CID 9410444.
- Harvey, Jeffrey A.; Van den Berg, Daphne; Ellers, Jacintha; Kampen, Remko; et al. (2018). "Internet Blogs, Polar Bears, and Climate-Change Denial by Proxy". BioScience. 68 (4): 281–287. doi:10.1093/biosci/bix133. ISSN 0006-3568. PMC 5894087. PMID 29662248.
- Hawkins, Ed; Ortega, Pablo; Suckling, Emma; Schurer, Andrew; et al. (2017). "Estimating Changes in Global Temperature since the Preindustrial Period". Bulletin of the American Meteorological Society. 98 (9): 1841–1856. Bibcode:2017BAMS...98.1841H. doi:10.1175/bams-d-16-0007.1. ISSN 0003-0007.
- He, Yanyi; Wang, Kaicun; Zhou, Chunlüe; Wild, Martin (2018). "A Revisit of Global Dimming and Brightening Based on the Sunshine Duration". Geophysical Research Letters. 45 (9): 4281–4289. Bibcode:2018GeoRL..45.4281H. doi:10.1029/2018GL077424. ISSN 1944-8007.
- Hodder, Patrick; Martin, Brian (2009). "Climate Crisis? The Politics of Emergency Framing". Economic and Political Weekly. 44 (36): 53–60. ISSN 0012-9976. JSTOR 25663518.
- Holding, S.; Allen, D. M.; Foster, S.; Hsieh, A.; et al. (2016). "Groundwater vulnerability on small islands". Nature Climate Change. 6 (12): 1100–1103. Bibcode:2016NatCC...6.1100H. doi:10.1038/nclimate3128. ISSN 1758-6798.
- Joo, Gea-Jae; Kim, Ji Yoon; Do, Yuno; Lineman, Maurice (2015). "Talking about Climate Change and Global Warming". PLOS ONE. 10 (9): e0138996. Bibcode:2015PLoSO..1038996L. doi:10.1371/journal.pone.0138996. ISSN 1932-6203. PMC 4587979. PMID 26418127.
- Kabir, Russell; Khan, Hafiz T. A.; Ball, Emma; Caldwell, Khan (2016). "Climate Change Impact: The Experience of the Coastal Areas of Bangladesh Affected by Cyclones Sidr and Aila". Journal of Environmental and Public Health. 2016: 9654753. doi:10.1155/2016/9654753. PMC 5102735. PMID 27867400.
- Kennedy, J. J.; Thorne, W. P.; Peterson, T. C.; Ruedy, R. A.; et al. (2010). Arndt, D. S.; Baringer, M. O.; Johnson, M. R. (eds.). "How do we know the world has warmed?". Special supplement: State of the Climate in 2009. Bulletin of the American Meteorological Society. 91 (7). S26-S27. doi:10.1175/BAMS-91-7-StateoftheClimate.
- Kopp, R. E.; Hayhoe, K.; Easterling, D. R.; Hall, T.; et al. (2017). "Chapter 15: Potential Surprises: Compound Extremes and Tipping Elements". In USGCRP 2017. Archived from the original on 20 August 2018.
- Knight, J.; Kenney, J. J.; Folland, C.; Harris, G.; et al. (2009). "Do Global Temperature Trends Over the Last Decade Falsify Climate Predictions? [in "State of the Climate in 2008"]". Bulletin of the American Meteorological Society. 90 (8): S75–S79. doi:10.1175/BAMS-91-7-StateoftheClimate.
- Kossin, J. P.; Hall, T.; Knutson, T.; Kunkel, K. E.; Trapp, R. J.; Waliser, D. E.; Wehner, M. F. (2017). "Chapter 9: Extreme Storms". In USGCRP2017.
- Knutson, T. (2017). "Appendix C: Detection and attribution methodologies overview.". In USGCRP2017.
- Lapenis, Andrei G. (1998). "Arrhenius and the Intergovernmental Panel on Climate Change". Eos. 79 (23): 271. Bibcode:1998EOSTr..79..271L. doi:10.1029/98EO00206.
- Lawrence, Mark G.; Schäfer, Stefan; Muri, Helene; Scott, Vivian; et al. (2018). "Evaluating climate geoengineering proposals in the context of the Paris Agreement temperature goals". Nature Communications. 9 (1): 3734. Bibcode:2018NatCo...9.3734L. doi:10.1038/s41467-018-05938-3. ISSN 2041-1723. PMC 6137062. PMID 30213930.
- Lenton, Timothy M.; Rockström, Johan; Gaffney, Owen; Rahmstorf, Stefan; et al. (2019). "Climate tipping points — too risky to bet against". Nature. 575 (7784): 592–595. Bibcode:2019Natur.575..592L. doi:10.1038/d41586-019-03595-0. PMID 31776487.
- Levermann, Anders; Clark, Peter U.; Marzeion, Ben; Milne, Glenn A.; et al. (2013). "The multimillennial sea-level commitment of global warming". Proceedings of the National Academy of Sciences. 110 (34): 13745–13750. Bibcode:2013PNAS..11013745L. doi:10.1073/pnas.1219414110. ISSN 0027-8424. PMC 3752235. PMID 23858443.
- Liepert, Beate G.; Previdi, Michael (2009). "Do Models and Observations Disagree on the Rainfall Response to Global Warming?". Journal of Climate. 22 (11): 3156–3166. Bibcode:2009JCli...22.3156L. doi:10.1175/2008JCLI2472.1.
- Liverman, Diana M. (2009). "Conventions of climate change: constructions of danger and the dispossession of the atmosphere". Journal of Historical Geography. 35 (2): 279–296. doi:10.1016/j.jhg.2008.08.008.
- Liu, Wei; Xie, Shang-Ping; Liu, Zhengyu; Zhu, Jiang (2017). "Overlooked possibility of a collapsed Atlantic Meridional Overturning Circulation in warming climate". Science Advances. 3 (1): e1601666. Bibcode:2017SciA....3E1666L. doi:10.1126/sciadv.1601666. PMC 5217057. PMID 28070560.
- Lüthi, Dieter; Le Floch, Martine; Bereiter, Bernhard; Blunier, Thomas; et al. (2008). "High-resolution carbon dioxide concentration record 650,000–800,000 years before present" (PDF). Nature. 453 (7193): 379–382. Bibcode:2008Natur.453..379L. doi:10.1038/nature06949. PMID 18480821. S2CID 1382081.
- Matthews, H. Damon; Gillett, Nathan P.; Stott, Peter A.; Zickfeld, Kirsten (2009). "The proportionality of global warming to cumulative carbon emissions". Nature. 459 (7248): 829–832. Bibcode:2009Natur.459..829M. doi:10.1038/nature08047. ISSN 1476-4687. PMID 19516338. S2CID 4423773.
- McGuire, Bill (2010). "Climate forcing of geological and geomorphological hazards". Philosophical Transactions of the Royal Society A: Mathematical, Physical and Engineering Sciences. 368 (1919): 2311–2315. Bibcode:2010RSPTA.368.2311M. doi:10.1098/rsta.2010.0077. PMID 20403830.
- McNeill, V. Faye (2017). "Atmospheric Aerosols: Clouds, Chemistry, and Climate". Annual Review of Chemical and Biomolecular Engineering. 8 (1): 427–444. doi:10.1146/annurev-chembioeng-060816-101538. ISSN 1947-5438. PMID 28415861.
- Melillo, J. M.; Frey, S. D.; DeAngelis, K. M.; Werner, W. J.; et al. (2017). "Long-term pattern and magnitude of soil carbon feedback to the climate system in a warming world". Science. 358 (6359): 101–105. Bibcode:2017Sci...358..101M. doi:10.1126/science.aan2874. PMID 28983050.
- Mercure, J.-F.; Pollitt, H.; Viñuales, J. E.; Edwards, N. R.; et al. (2018). "Macroeconomic impact of stranded fossil fuel assets" (PDF). Nature Climate Change. 8 (7): 588–593. Bibcode:2018NatCC...8..588M. doi:10.1038/s41558-018-0182-1. ISSN 1758-6798. S2CID 89799744.
- Mitchum, G. T.; Masters, D.; Hamlington, B. D.; Fasullo, J. T.; et al. (2018). "Climate-change–driven accelerated sea-level rise detected in the altimeter era". Proceedings of the National Academy of Sciences. 115 (9): 2022–2025. Bibcode:2018PNAS..115.2022N. doi:10.1073/pnas.1717312115. ISSN 0027-8424. PMC 5834701. PMID 29440401.
- National Research Council (2011). Climate Stabilization Targets: Emissions, Concentrations, and Impacts over Decades to Millennia. Washington, DC: National Academies Press. doi:10.17226/12877. ISBN 978-0-309-15176-4. Archived from the original on 20 July 2010. Retrieved 19 August 2013.
- National Research Council (2011). "Causes and Consequences of Climate Change". America's Climate Choices. Washington, DC: The National Academies Press. doi:10.17226/12781. ISBN 978-0-309-14585-5. Archived from the original on 21 July 2015. Retrieved 28 January 2019.
- Neukom, Raphael; Steiger, Nathan; Gómez-Navarro, Juan José; Wang, Jianghao; et al. (2019). "No evidence for globally coherent warm and cold periods over the preindustrial Common Era" (PDF). Nature. 571 (7766): 550–554. Bibcode:2019Natur.571..550N. doi:10.1038/s41586-019-1401-2. ISSN 1476-4687. PMID 31341300. S2CID 198494930.
- Neukom, Raphael; Barboza, Luis A.; Erb, Michael P.; Shi, Feng; et al. (2019). "Consistent multidecadal variability in global temperature reconstructions and simulations over the Common Era". Nature Geoscience. 12 (8): 643–649. Bibcode:2019NatGe..12..643P. doi:10.1038/s41561-019-0400-0. ISSN 1752-0908. PMC 6675609. PMID 31372180.
- Oertel, Cornelius; Matschullat, Jorg; Zurba, Kamal; Zimmermann, Frank; Erasmi, Stefan (2016). "Greenhouse gas emissions from soils—A review". Geochemistry. 76 (3): 327–352. doi:10.1016/j.chemer.2016.04.002.
- O’Neill, Saffron J.; Boykoff, Max (2010). "Climate denier, skeptic, or contrarian?". Proceedings of the National Academy of Sciences of the United States of America. 107 (39): E151. Bibcode:2010PNAS..107E.151O. doi:10.1073/pnas.1010507107. ISSN 0027-8424. PMC 2947866. PMID 20807754.
- Pistone, Kristina; Eisenman, Ian; Ramanathan, Veerabhadran (2019). "Radiative Heating of an Ice-Free Arctic Ocean". Geophysical Research Letters. 46 (13): 7474–7480. Bibcode:2019GeoRL..46.7474P. doi:10.1029/2019GL082914. ISSN 1944-8007. S2CID 197572148.
- Poloczanska, Elvira S.; Brown, Christopher J.; Sydeman, William J.; Kiessling, Wolfgang; et al. (2013). "Global imprint of climate change on marine life" (PDF). Nature Climate Change. 3 (10): 919–925. Bibcode:2013NatCC...3..919P. doi:10.1038/nclimate1958. ISSN 1758-6798.
- Rahmstorf, Stefan; Cazenave, Anny; Church, John A.; Hansen, James E.; et al. (2007). "Recent Climate Observations Compared to Projections" (PDF). Science. 316 (5825): 709. Bibcode:2007Sci...316..709R. doi:10.1126/science.1136843. PMID 17272686. S2CID 34008905. Archived (PDF) from the original on 6 September 2018.
- Ramanathan, V.; Carmichael, G. (2008). "Global and Regional Climate Changes due to Black Carbon". Nature Geoscience. 1 (4): 221–227. Bibcode:2008NatGe...1..221R. doi:10.1038/ngeo156.
- Randel, William J.; Shine, Keith P.; Austin, John; Barnett, John; et al. (2009). "An update of observed stratospheric temperature trends" (PDF). Journal of Geophysical Research. 114 (D2): D02107. Bibcode:2009JGRD..11402107R. doi:10.1029/2008JD010421.
- Rauner, Sebastian; Bauer, Nico; Dirnaichner, Alois; Van Dingenen, Rita; Mutel, Chris; Luderer, Gunnar (2020). "Coal-exit health and environmental damage reductions outweigh economic impacts". Nature Climate Change. 10 (4): 308–312. Bibcode:2020NatCC..10..308R. doi:10.1038/s41558-020-0728-x. ISSN 1758-6798. S2CID 214619069.
- Reisinger, Andy; Clark, Harry (2018). "How much do direct livestock emissions actually contribute to global warming?". Global Change Biology. 24 (4): 1749–1761. Bibcode:2018GCBio..24.1749R. doi:10.1111/gcb.13975. ISSN 1365-2486. PMID 29105912. S2CID 3608959.
- Riahi, Keywan; van Vuuren, Detlef P.; Kriegler, Elmar; Edmonds, Jae; et al. (2017). "The Shared Socioeconomic Pathways and their energy, land use, and greenhouse gas emissions implications: An overview". Global Environmental Change. 42: 153–168. doi:10.1016/j.gloenvcha.2016.05.009. ISSN 0959-3780.
- Ripple, William J.; Wolf, Christopher; Newsome, Thomas M.; Galetti, Mauro; et al. (2017). "World Scientists' Warning to Humanity: A Second Notice". BioScience. 67 (12): 1026–1028. doi:10.1093/biosci/bix125.
- Ripple, William J.; Wolf, Christopher; Newsome, Thomas M.; Barnard, Phoebe; et al. (2019). "World Scientists' Warning of a Climate Emergency". BioScience. doi:10.1093/biosci/biz088. hdl:1808/30278.
- Ristroph, E. (2019). "Fulfilling Climate Justice And Government Obligations To Alaska Native Villages: What Is The Government Role?". William & Mary Environmental Law and Policy Review. 43 (2).
- Rogelj, Joeri; Forster, Piers M.; Kriegler, Elmar; Smith, Christopher J.; et al. (2019). "Estimating and tracking the remaining carbon budget for stringent climate targets". Nature. 571 (7765): 335–342. Bibcode:2019Natur.571..335R. doi:10.1038/s41586-019-1368-z. ISSN 1476-4687. PMID 31316194. S2CID 197542084.
- Rogelj, Joeri; Meinshausen, Malte; Schaeffer, Michiel; Knutti, Reto; Riahi, Keywan (2015). "Impact of short-lived non-CO2 mitigation on carbon budgets for stabilizing global warming". Environmental Research Letters. 10 (7): 1–10. doi:10.1088/1748-9326/10/7/075001.
- Samset, B. H.; Sand, M.; Smith, C. J.; Bauer, S. E.; et al. (2018). "Climate Impacts From a Removal of Anthropogenic Aerosol Emissions" (PDF). Geophysical Research Letters. 45 (2): 1020–1029. Bibcode:2018GeoRL..45.1020S. doi:10.1002/2017GL076079. ISSN 1944-8007.
- Sand, M.; Berntsen, T. K.; von Salzen, K.; Flanner, M. G.; et al. (2015). "Response of Arctic temperature to changes in emissions of short-lived climate forcers". Nature. 6 (3): 286–289. doi:10.1038/nclimate2880.
- Schmidt, Gavin A.; Ruedy, Reto A.; Miller, Ron L.; Lacis, Andy A. (2010). "Attribution of the present-day total greenhouse effect". Journal of Geophysical Research: Atmospheres. 115 (D20): D20106. Bibcode:2010JGRD..11520106S. doi:10.1029/2010JD014287. ISSN 2156-2202. S2CID 28195537.
- Schmidt, Gavin A.; Shindell, Drew T.; Tsigaridis, Kostas (2014). "Reconciling warming trends". Nature Geoscience. 7 (3): 158–160. Bibcode:2014NatGe...7..158S. doi:10.1038/ngeo2105. hdl:2060/20150000726.
- Serdeczny, Olivia; Adams, Sophie; Baarsch, Florent; Coumou, Dim; et al. (2016). "Climate change impacts in Sub-Saharan Africa: from physical changes to their social repercussions" (PDF). Regional Environmental Change. 17 (6): 1585–1600. doi:10.1007/s10113-015-0910-2. ISSN 1436-378X. S2CID 3900505.
- Sévellec, Florian; Drijfhout, Sybren S. (2018). "A novel probabilistic forecast system predicting anomalously warm 2018–2022 reinforcing the long-term global warming trend". Nature Communications. 9 (1): 3024. Bibcode:2018NatCo...9.3024S. doi:10.1038/s41467-018-05442-8. PMC 6092397. PMID 30108213.
- Sherwood, Steven C.; Huber, Matthew (2010). "An adaptability limit to climate change due to heat stress". PNAS. 107 (21): 9552–9555. Bibcode:2010PNAS..107.9552S. doi:10.1073/pnas.0913352107. PMC 2906879. PMID 20439769.
- Shindell, Drew; Faluvegi, Greg; Lacis, Andrew; Hansen, James; et al. (2006). "Role of tropospheric ozone increases in 20th-century climate change" (PDF). Journal of Geophysical Research. 111 (D8): D08302. Bibcode:2006JGRD..11108302S. CiteSeerX 10.1.1.409.4489. doi:10.1029/2005JD006348. Archived (PDF) from the original on 10 August 2017.
- Siegenthaler, Urs; Stocker, Thomas F.; Monnin, Eric; Lüthi, Dieter; et al. (2005). "Stable Carbon Cycle–Climate Relationship During the Late Pleistocene" (PDF). Science. 310 (5752): 1313–1317. Bibcode:2005Sci...310.1313S. doi:10.1126/science.1120130. PMID 16311332.
- Sutton, Rowan T.; Dong, Buwen; Gregory, Jonathan M. (2007). "Land/sea warming ratio in response to climate change: IPCC AR4 model results and comparison with observations". Geophysical Research Letters. 34 (2): L02701. Bibcode:2007GeoRL..3402701S. doi:10.1029/2006GL028164.
- Smale, Dan A.; Wernberg, Thomas; Oliver, Eric C. J.; Thomsen, Mads; Harvey, Ben P. (2019). "Marine heatwaves threaten global biodiversity and the provision of ecosystem services" (PDF). Nature Climate Change. 9 (4): 306–312. Bibcode:2019NatCC...9..306S. doi:10.1038/s41558-019-0412-1. ISSN 1758-6798. S2CID 91471054.
- Smith, Joel B.; Schneider, Stephen H.; Oppenheimer, Michael; Yohe, Gary W.; et al. (2009). "Assessing dangerous climate change through an update of the Intergovernmental Panel on Climate Change (IPCC) 'reasons for concern'". Proceedings of the National Academy of Sciences. 106 (11): 4133–4137. Bibcode:2009PNAS..106.4133S. doi:10.1073/pnas.0812355106. PMC 2648893. PMID 19251662.
- Stott, Peter A.; Kettleborough, J. A. (2002). "Origins and estimates of uncertainty in predictions of twenty-first century temperature rise". Nature. 416 (6882): 723–726. Bibcode:2002Natur.416..723S. doi:10.1038/416723a. ISSN 1476-4687. PMID 11961551. S2CID 4326593.
- Stroeve, J.; Holland, Marika M.; Meier, Walt; Scambos, Ted; et al. (2007). "Arctic sea ice decline: Faster than forecast". Geophysical Research Letters. 34 (9): L09501. Bibcode:2007GeoRL..3409501S. doi:10.1029/2007GL029703.
- Storelvmo, T.; Phillips, P. C. B.; Lohmann, U.; Leirvik, T.; Wild, M. (2016). "Disentangling greenhouse warming and aerosol cooling to reveal Earth's climate sensitivity" (PDF). Nature Geoscience. 9 (4): 286–289. Bibcode:2016NatGe...9..286S. doi:10.1038/ngeo2670. ISSN 1752-0908.
- Sun, Lantao; Perlwitz, Judith; Hoerling, Martin (2016). "What caused the recent "Warm Arctic, Cold Continents" trend pattern in winter temperatures?". Geophysical Research Letters. 43 (10): 5345–5352. Bibcode:2016GeoRL..43.5345S. doi:10.1002/2016GL069024. ISSN 1944-8007. S2CID 9384933.
- Trenberth, Kevin E.; Fasullo, John T. (2016). "Insights into Earth's Energy Imbalance from Multiple Sources". Journal of Climate. 29 (20): 7495–7505. Bibcode:2016JCli...29.7495T. doi:10.1175/JCLI-D-16-0339.1.
- Turetsky, Merritt R.; Abbott, Benjamin W.; Jones, Miriam C.; Anthony, Katey Walter; et al. (2019). "Permafrost collapse is accelerating carbon release". Nature. 569 (7754): 32–34. Bibcode:2019Natur.569...32T. doi:10.1038/d41586-019-01313-4. PMID 31040419.
- Twomey, S. (1977). "The Influence of Pollution on the Shortwave Albedo of Clouds". J. Atmos. Sci. 34 (7): 1149–1152. Bibcode:1977JAtS...34.1149T. doi:10.1175/1520-0469(1977)034<1149:TIOPOT>2.0.CO;2. ISSN 1520-0469.
- Tyndall, John (1861). "On the Absorption and Radiation of Heat by Gases and Vapours, and on the Physical Connection of Radiation, Absorption, and Conduction". Philosophical Magazine. 4. 22: 169–194, 273–285. Archived from the original on 26 March 2016.
- UNEP (2010). UNEP Emerging Issues: Environmental Consequences of Ocean Acidification: A Threat to Food Security (PDF). Nairobi, Kenya: United Nations Environment Programme (UNEP). Archived from the original (PDF) on 7 April 2015..
- Urban, Mark C. (2015). "Accelerating extinction risk from climate change". Science. 348 (6234): 571–573. Bibcode:2015Sci...348..571U. doi:10.1126/science.aaa4984. ISSN 0036-8075. PMID 25931559.

- USGCRP (2017). Wuebbles, D. J.; Fahey, D. W.; Hibbard, K. A.; Dokken, D. J.; et al. (eds.). Climate Science Special Report: Fourth National Climate Assessment, Volume I. Washington, DC: U.S. Global Change Research Program. doi:10.7930/J0J964J6.
- Wuebbles, D. J.; Easterling, D. R.; Hayhoe, K.; Knutson, T.; et al. (2017). "Chapter 1: Our Globally Changing Climate" (PDF). In USGCRP2017.
- Walsh, John; Wuebbles, Donald; Hayhoe, Katherine; Kossin, Kossin; et al. (2014). "Appendix 3: Climate Science Supplement" (PDF). Climate Change Impacts in the United States: The Third National Climate Assessment. US National Climate Assessment.
- Wang, M.; Overland, J. E. (2009). "A sea ice free summer Arctic within 30 years?". Geophysical Research Letters. 36 (7): n/a. Bibcode:2009GeoRL..36.7502W. doi:10.1029/2009GL037820. Archived from the original on 19 January 2012.
- Wang, Bin; Shugart, Herman H.; Lerdau, Manuel T. (2017). "Sensitivity of global greenhouse gas budgets to tropospheric ozone pollution mediated by the biosphere". Environmental Research Letters. 12 (8): 084001. Bibcode:2017ERL....12h4001W. doi:10.1088/1748-9326/aa7885. ISSN 1748-9326.
- Watts, Nick; Adger, W Neil; Agnolucci, Paolo; Blackstock, Jason; et al. (2015). "Health and climate change: policy responses to protect public health". The Lancet. 386 (10006): 1861–1914. doi:10.1016/S0140-6736(15)60854-6. hdl:10871/20783. PMID 26111439. S2CID 205979317. Archived from the original on 7 April 2017.
- Watts, Nick; Amann, Markus; Arnell, Nigel; Ayeb-Karlsson, Sonja; et al. (2019). "The 2019 report of The Lancet Countdown on health and climate change: ensuring that the health of a child born today is not defined by a changing climate". The Lancet. 394 (10211): 1836–1878. doi:10.1016/S0140-6736(19)32596-6. ISSN 0140-6736. PMID 31733928. S2CID 207976337.
- WCRP Global Sea Level Budget Group (2018). "Global sea-level budget 1993–present". Earth System Science Data. 10 (3): 1551–1590. Bibcode:2018ESSD...10.1551W. doi:10.5194/essd-10-1551-2018. ISSN 1866-3508.
- Weart, Spencer (2013). "Rise of interdisciplinary research on climate". Proceedings of the National Academy of Sciences. 110 (Supplement 1): 3657–3664. doi:10.1073/pnas.1107482109. PMC 3586608. PMID 22778431.
- Wild, M.; Gilgen, Hans; Roesch, Andreas; Ohmura, Atsumu; et al. (2005). "From Dimming to Brightening: Decadal Changes in Solar Radiation at Earth's Surface". Science. 308 (5723): 847–850. Bibcode:2005Sci...308..847W. doi:10.1126/science.1103215. PMID 15879214. S2CID 13124021.
- Wolff, Eric W.; Shepherd, John G.; Shuckburgh, Emily; Watson, Andrew J. (2015). "Feedbacks on climate in the Earth system: introduction". Philosophical Transactions of the Royal Society A: Mathematical, Physical and Engineering Sciences. 373 (2054): 20140428. Bibcode:2015RSPTA.37340428W. doi:10.1098/rsta.2014.0428. PMC 4608041. PMID 26438277.
- Zeng, Ning; Yoon, Jinho (2009). "Expansion of the world's deserts due to vegetation-albedo feedback under global warming". Geophysical Research Letters. 36 (17): L17401. Bibcode:2009GeoRL..3617401Z. doi:10.1029/2009GL039699. ISSN 1944-8007. S2CID 1708267.
- Zhang, Jinlun; Lindsay, Ron; Steele, Mike; Schweiger, Axel (2008). "What drove the dramatic arctic sea ice retreat during summer 2007?". Geophysical Research Letters. 35: 1–5. Bibcode:2008GeoRL..3511505Z. doi:10.1029/2008gl034005. S2CID 9387303.
Books, reports and legal documents
- Adams, B.; Luchsinger, G. (2009). Climate Justice for a Changing Planet: A Primer for Policy Makers and NGOs (PDF). UN Non-Governmental Liaison Service (NGLS). ISBN 978-92-1-101208-8.
- Archer, David; Pierrehumbert, Raymond (2013). The Warming Papers: The Scientific Foundation for the Climate Change Forecast. John Wiley & Sons. ISBN 978-1-118-68733-8.
- Climate Focus (December 2015). "The Paris Agreement: Summary. Climate Focus Client Brief on the Paris Agreement III" (PDF). Archived (PDF) from the original on 5 October 2018. Retrieved 12 April 2019.
- Clark, P. U.; Weaver, A. J.; Brook, E.; Cook, E. R.; et al. (December 2008). "Executive Summary". In: Abrupt Climate Change. A Report by the U.S. Climate Change Science Program and the Subcommittee on Global Change Research. Reston, VA: U.S. Geological Survey. Archived from the original on 4 May 2013.
- Climate Action Tracker (2019). Warming projections global update, December 2019 (PDF) (Report).
- Dessai, Suraje (2001). "The climate regime from The Hague to Marrakech: Saving or sinking the Kyoto Protocol?" (PDF). Tyndall Centre Working Paper 12. Tyndall Centre. Archived from the original (PDF) on 10 June 2012. Retrieved 5 May 2010.
- Druckman, A.; Jackson, T. (2016). "Understanding Households as Drivers of Carbon Emissions". In Clift, R.; Druckman, A. (eds.). Taking Stock of Industrial Ecology. Springer, Cham. pp. 181–203. doi:10.1007/978-3-319-20571-7_9. ISBN 978-3-319-20571-7.
- Dunlap, Riley E.; McCright, Aaron M. (2011). "Chapter 10: Organized climate change denial". In Dryzek, John S.; Norgaard, Richard B.; Schlosberg, David (eds.). The Oxford Handbook of Climate Change and Society. Oxford University Press. pp. 144–160. ISBN 9780199566600.
- Dunlap, Riley E.; McCright, Aaron M. (2015). "Chapter 10: Challenging Climate Change: The Denial Countermovement". In Dunlap, Riley E.; Brulle, Robert J. (eds.). Climate Change and Society: Sociological Perspectives. Oxford University Press. pp. 300–332. ISBN 9780199 356119.
- European Commission (28 November 2018). In-depth analysis accompanying the Commission Communication COM(2018) 773: A Clean Planet for all - A European strategic long-term vision for a prosperous, modern, competitive and climate neutral economy (PDF) (Report). Brussels. p. 188.
- Fleming, James Rodger (2007). The Callendar Effect: the life and work of Guy Stewart Callendar (1898–1964). Boston: American Meteorological Society. ISBN 978-1-878220-76-9.
- Academia Brasileira de Ciéncias (Brazil); Royal Society of Canada; Chinese Academy of Sciences; Académie des Sciences (France); Deutsche Akademie der Naturforscher Leopoldina (Germany); Indian National Science Academy; Accademia Nazionale dei Lincei (Italy); Science Council of Japan, Academia Mexicana de Ciencias; Russian Academy of Sciences; Academy of Science of South Africa; Royal Society (United Kingdom); National Academy of Sciences (United States of America) (May 2009). "G8+5 Academies' joint statement: Climate change and the transformation of energy technologies for a low carbon future" (PDF). The National Academies of Sciences, Engineering, and Medicine. Archived (PDF) from the original on 15 February 2010. Retrieved 5 May 2010.
- Global Subsidies Initiative (June 2019). Raising Ambition Through Fossil Fuel Subsidy Reform: Greenhouse gas emissions results modelling from 26 countries (PDF) (Report). Geneva: Global Subsidies Initiative of the International Institute for Sustainable Development.
- Haywood, Jim (2016). "Chapter 27 - Atmospheric Aerosols and Their Role in Climate Change". In Letcher, Trevor M. (ed.). Climate Change: Observed Impacts on Planet Earth. Elsevier. p. 456. ISBN 9780444635242.
- Bridle, Richard; Sharma, Shruti; Mostafa, Mostafa; Geddes, Anna (June 2019). Fossil Fuel to Clean Energy Subsidy Swaps (PDF) (Report). p. iv.
- Global Energy Transformation: A Roadmap to 2050 (2019 edition) (PDF) (Report). IRENA. 2019. Retrieved 15 May 2020.
- Meinshausen, Malte (2019). "Implications of the Developed Scenarios for Climate Change". In Teske, Sven (ed.). Achieving the Paris Climate Agreement Goals. Achieving the Paris Climate Agreement Goals: Global and Regional 100% Renewable Energy Scenarios with Non-energy GHG Pathways for +1.5 °C and +2 °C. Springer International Publishing. pp. 459–469. doi:10.1007/978-3-030-05843-2_12. ISBN 978-3-030-05843-2.
- Millar, Neville; Doll, Julie; Robertson, G. (November 2014). Management of nitrogen fertilizer to reduce nitrous oxide (N2O) emissions from field crops (PDF) (Report). Michigan State University.
- Miller, J.; Du, L.; Kodjak, D. (2017). Impacts of World-Class Vehicle Efficiency and Emissions Regulations in Select G20 Countries (PDF) (Report). Washington, DC: The International Council on Clean Transportation.
- Müller, Benito (February 2010). Copenhagen 2009: Failure or final wake-up call for our leaders? EV 49 (PDF). Oxford Institute for Energy Studies. p. i. ISBN 978-1-907555-04-6. Archived (PDF) from the original on 10 July 2017. Retrieved 18 May 2010.
- National Research Council (2008). Understanding and responding to climate change: Highlights of National Academies Reports, 2008 edition, produced by the US National Research Council (US NRC) (Report). Washington, DC: National Academy of Sciences. Archived from the original on 4 March 2016. Retrieved 14 January 2016.
- National Research Council (2012). Climate Change: Evidence, Impacts, and Choices (PDF) (Report). Archived (PDF) from the original on 20 February 2013. Retrieved 9 September 2017.
- Newell, Peter (14 December 2006). Climate for Change: Non-State Actors and the Global Politics of the Greenhouse. Cambridge University Press. ISBN 978-0-521-02123-4. Retrieved 30 July 2018.
- NOAA. "January 2017 analysis from NOAA: Global and Regional Sea Level Rise Scenarios for the United States" (PDF). Archived (PDF) from the original on 18 December 2017. Retrieved 7 February 2019.
- NRC (2008). "Understanding and Responding to Climate Change" (PDF). Board on Atmospheric Sciences and Climate, US National Academy of Sciences. Archived (PDF) from the original on 11 October 2017. Retrieved 9 November 2010.
- O'Sullivan, Meghan; Overland, Indra; Sandalow, David (2017). The Geopolitics of Renewable Energy (PDF) (working paper). New York: Center on Global Energy Policy.
- Olivier, J. G. J.; Peters, J. A. H. W. (2019). Trends in global CO
2 and total greenhouse gas emissions (PDF). The Hague: PBL Netherlands Environmental Assessment Agency. - Oreskes, Naomi (2007). "The scientific consensus on climate change: How do we know we're not wrong?". In DiMento, Joseph F. C.; Doughman, Pamela M. (eds.). Climate Change: What It Means for Us, Our Children, and Our Grandchildren. The MIT Press. ISBN 978-0-262-54193-0.
- Oreskes, Naomi; Conway, Erik (2010). Merchants of Doubt: How a Handful of Scientists Obscured the Truth on Issues from Tobacco Smoke to Global Warming (first ed.). Bloomsbury Press. ISBN 978-1-59691-610-4.
- REN21 (2019). Renewables 2019 Global Status Report (PDF). Paris: REN21 Secretariat. ISBN 978-3-9818911-7-1.
- REN21 (2020). Renewables 2020 Global Status Report (PDF). Paris: REN21 Secretariat. ISBN 978-3-948393-00-7.
- Royal Society (13 April 2005). Economic Affairs – Written Evidence. The Economics of Climate Change, the Second Report of the 2005–2006 session, produced by the UK Parliament House of Lords Economics Affairs Select Committee. UK Parliament. Archived from the original on 13 November 2011. Retrieved 9 July 2011.
- Stepherd, John (September 2009). Geoengineering the climate: Science, governance and uncertainty (PDF). London: The Royal Society. ISBN 978-0-85403-773-5.
- Setzer, Joana; Byrnes, Rebecca (July 2019). Global trends in climate change litigation: 2019 snapshot (PDF). London: the Grantham Research Institute on Climate Change and the Environment and the Centre for Climate Change Economics and Policy.
- Teske, Sven, ed. (2019). "Executive Summary" (PDF). Achieving the Paris Climate Agreement Goals: Global and Regional 100% Renewable Energy Scenarios with Non-energy GHG Pathways for +1.5 °C and +2 °C. Springer International Publishing. pp. xiii–xxxv. doi:10.1007/978-3-030-05843-2. ISBN 978-3-030-05843-2.
- Teske, Sven; Nagrath, Kriti; Morris, Tom; Dooley, Kate (2019). "Renewable Energy Resource Assessment". In Teske, Sven (ed.). Achieving the Paris Climate Agreement Goals. Achieving the Paris Climate Agreement Goals: Global and Regional 100% Renewable Energy Scenarios with Non-energy GHG Pathways for +1.5 °C and +2 °C. Springer International Publishing. pp. 161–173. doi:10.1007/978-3-030-05843-2_7. ISBN 978-3-030-05843-2.
- Teske, Sven (2019). "Trajectories for a Just Transition of the Fossil Fuel Industry". In Teske, Sven (ed.). Achieving the Paris Climate Agreement Goals. Achieving the Paris Climate Agreement Goals: Global and Regional 100% Renewable Energy Scenarios with Non-energy GHG Pathways for +1.5 °C and +2 °C. Springer International Publishing. pp. 403–411. doi:10.1007/978-3-030-05843-2_9. ISBN 978-3-030-05843-2.
- UN FAO (2016). Global Forest Resources Assessment 2015. How are the world's forests changing? (PDF) (Report). Food and Agriculture Organization of the United Nations. ISBN 978-92-5-109283-5. Retrieved 1 December 2019.
- United Nations Environment Programme (2019). Emissions Gap Report 2019 (PDF). Nairobi. ISBN 978-92-807-3766-0.
- UNFCCC (1992). United Nations Framework Convention on Climate Change (PDF).
- UNFCCC (1997). "Kyoto Protocol to the United Nations Framework Convention on Climate Change". United Nations.
- UNFCCC (30 March 2010). "Decision 2/CP.15: Copenhagen Accord". Report of the Conference of the Parties on its fifteenth session, held in Copenhagen from 7 to 19 December 2009. United Nations Framework Convention on Climate Change. FCCC/CP/2009/11/Add.1. Archived from the original on 30 April 2010. Retrieved 17 May 2010.
- UNFCCC (2015). "Paris Agreement" (PDF). United Nations Framework Convention on Climate Change.
- Park, Susin (May 2011). "Climate Change and the Risk of Statelessness: The Situation of Low-lying Island States" (PDF). United Nations High Commissioner for Refugees. Archived (PDF) from the original on 2 May 2013. Retrieved 13 April 2012.
- United States Environmental Protection Agency (2016). Methane and Black Carbon Impacts on the Arctic: Communicating the Science (Report). Archived from the original on 6 September 2017. Retrieved 27 February 2019.
- Van Oldenborgh, Geert-Jan; Philip, Sjoukje; Kew, Sarah; Vautard, Robert; et al. (2019). "Human contribution to the record-breaking June 2019 heat wave in France". Semantic Scholar. S2CID 199454488.
- State and Trends of Carbon Pricing 2019 (PDF) (Report). Washington, DC: World Bank. June 2019. doi:10.1596/978-1-4648-1435-8.
- World Meteorological Organization (2019). WMO Statement on the State of the Global Climate in 2018. WMO-No. 1233. Geneva. ISBN 978-92-63-11233-0.
- World Meteorological Organization (2020). WMO Statement on the State of the Global Climate in 2019. WMO-No. 1248. Geneva. ISBN 978-92-63-11248-4.
- Hallegatte, Stephane; Bangalore, Mook; Bonzanigo, Laura; Fay, Marianne; et al. (2016). Shock Waves : Managing the Impacts of Climate Change on Poverty. Climate Change and Development (PDF). Washington DC: World Bank. doi:10.1596/978-1-4648-0673-5. ISBN 978-1-4648-0674-2.
- World Resources Institute (December 2019). Creating a Sustainable Food Future: A Menu of Solutions to Feed Nearly 10 Billion People by 2050 (PDF). Washington, DC. ISBN 1-56973-953-6.
Non-technical sources
- American Institute of Physics
- Weart, Spencer (October 2008). The Discovery of Global Warming (2nd ed.). Cambridge, MA: Harvard University Press. ISBN 978-0-67403-189-0. Archived from the original on 18 November 2016. Retrieved 16 June 2020.
- Weart, Spencer (February 2019). The Discovery of Global Warming (online ed.). Archived from the original on 18 June 2020. Retrieved 19 June 2020.
- Weart, Spencer (January 2020). "The Carbon Dioxide Greenhouse Effect". The Discovery of Global Warming. American Institute of Physics. Archived from the original on 11 November 2016. Retrieved 19 June 2020.
- Weart, Spencer (January 2020). "The Public and Climate Change". The Discovery of Global Warming. American Institute of Physics. Archived from the original on 11 November 2016. Retrieved 19 June 2020.
- Weart, Spencer (January 2020). "The Public and Climate Change: Suspicions of a Human-Caused Greenhouse (1956–1969)". The Discovery of Global Warming. American Institute of Physics. Archived from the original on 11 November 2016. Retrieved 19 June 2020.
- Weart, Spencer (January 2020). "The Public and Climate Change (cont. – since 1980)". The Discovery of Global warming. American Institute of Physics. Archived from the original on 11 November 2016. Retrieved 19 June 2020.
- Weart, Spencer (January 2020). "The Public and Climate Change: The Summer of 1988". The Discovery of Global Warming. American Institute of Physics. Archived from the original on 11 November 2016. Retrieved 19 June 2020.
- Associated Press
- Colford, Paul (22 September 2015). "An addition to AP Stylebook entry on global warming". AP Style Blog. Retrieved 6 November 2019.
- BBC
- Amos, Jonathan (10 May 2013). "Carbon dioxide passes symbolic mark". BBC. Archived from the original on 29 May 2013. Retrieved 27 May 2013.
- Rodgers, Lucy (17 December 2018). "Climate change: The massive CO2 emitter you may not know about". BBC. Archived from the original on 17 December 2018.
- "Extinction Rebellion: Climate protesters block roads". BBC. 16 April 2019. Archived from the original on 16 April 2019. Retrieved 16 April 2019.
- "UK Parliament declares climate change emergency". BBC. 1 May 2019. Retrieved 30 June 2019.
- Rigby, Sara (3 February 2020). "Climate change: should we change the terminology?". BBC Science Focus Magazine. Retrieved 24 March 2020.
- Bulletin of the Atomic Scientists
- Stover, Dawn (23 September 2014). "The global warming 'hiatus'". Bulletin of the Atomic Scientists. Archived from the original on 11 July 2020.
- Carbon Brief
- Yeo, Sophie (4 January 2017). "Clean energy: The challenge of achieving a 'just transition' for workers". Carbon Brief. Retrieved 18 May 2020.
- McSweeney, Robert M.; Hausfather, Zeke (15 January 2018). "Q&A: How do climate models work?". Carbon Brief. Archived from the original on 5 March 2019. Retrieved 2 March 2019.
- Hausfather, Zeke (19 April 2018). "Explainer: How 'Shared Socioeconomic Pathways' explore future climate change". Carbon Brief. Retrieved 20 July 2019.
- Hausfather, Zeke (8 October 2018). "Analysis: Why the IPCC 1.5C report expanded the carbon budget". Carbon Brief. Retrieved 28 July 2020.
- McSweeney, Robert M. (31 January 2019). "Q&A: How is Arctic warming linked to the 'polar vortex' and other extreme weather?". Carbon Brief.
- Dunne, Daisy; Gabbatiss, Josh; Mcsweeny, Robert (7 January 2020). "Media reaction: Australia's bushfires and climate change". Carbon Brief. Retrieved 11 January 2020.
- Deutsche Welle
- Ruiz, Irene Banos (22 June 2019). "Climate Action: Can We Change the Climate From the Grassroots Up?". Ecowatch. Deutsche Welle. Archived from the original on 23 June 2019. Retrieved 23 June 2019.
- EPA
- "Myths vs. Facts: Denial of Petitions for Reconsideration of the Endangerment and Cause or Contribute Findings for Greenhouse Gases under Section 202(a) of the Clean Air Act". U.S. Environmental Protection Agency. 25 August 2016. Retrieved 7 August 2017.
- US EPA (13 September 2019). "Global Greenhouse Gas Emissions Data". Archived from the original on 17 February 2020. Retrieved 8 August 2020.
- EUobserver
- "Copenhagen failure 'disappointing', 'shameful'". euobserver.com. 20 December 2009. Archived from the original on 12 April 2019. Retrieved 12 April 2019.
- Euronews
- Cox, Sam (22 June 2019). "Thousands of protesters occupy German coal mine". www.euronews.com. Archived from the original on 13 July 2019. Retrieved 13 July 2019.
- European Parliament
- Ciucci, M. (February 2020). "Renewable Energy". European Parliament. Retrieved 3 June 2020.
- Forbes
- Mirchandani, Bhakti (3 February 2020). "A €1 Trillion Opportunity: How To Read The EU Green Deal Investment Plan". Forbes. Retrieved 10 February 2020.
- Gallup
- Ray, Julie; Pugliese, Anita (22 April 2011). "Worldwide, Blame for Climate Change Falls on Humans". Gallup. Archived from the original on 4 May 2011. Retrieved 3 May 2011.
- Pugliese, Anita (20 April 2011). "Fewer Americans, Europeans View Global Warming as a Threat". Gallup. Archived from the original on 24 April 2011. Retrieved 22 April 2011.
- The Guardian
- Nuccitelli, Dana (26 January 2015). "Climate change could impact the poor much more than previously thought". The Guardian. Archived from the original on 28 December 2016.
- Carrington, Damian (19 March 2019). "School climate strikes: 1.4 million people took part, say campaigners". The Guardian. Archived from the original on 20 March 2019. Retrieved 12 April 2019.
- Carrington, Damian (17 May 2019). "Why the Guardian is changing the language it uses about the environment". The Guardian. Retrieved 20 May 2019.
- Milman, Oliver (15 September 2019). "'Americans are waking up': two-thirds say climate crisis must be addressed". The Guardian. Retrieved 16 September 2019.
- Rankin, Jennifer (28 November 2019). "'Our house is on fire': EU parliament declares climate emergency". The Guardian. ISSN 0261-3077. Retrieved 28 November 2019.Too risky
- Watts, Jonathan (19 February 2020). "Oil and gas firms 'have had far worse climate impact than thought'". The Guardian.
- Carrington, Damian (6 April 2020). "New renewable energy capacity hit record levels in 2019". The Guardian. Retrieved 25 May 2020.
- The Independent
- Weston, Phoebe (5 November 2019). "11,000 scientists declare global climate emergency and warn of 'untold human suffering'". The Independent. Retrieved 7 November 2019.
- NASA
- Conway, Erik M. (5 December 2008). "What's in a Name? Global Warming vs. Climate Change". NASA. Archived from the original on 9 August 2010.
- Riebeek, H. (16 June 2011). "The Carbon Cycle: Feature Articles: Effects of Changing the Carbon Cycle". Earth Observatory, part of the EOS Project Science Office located at NASA Goddard Space Flight Center. Archived from the original on 6 February 2013. Retrieved 4 February 2013.
- "Arctic amplification". NASA. 2013. Archived from the original on 31 July 2018.
- Shaftel, Holly (January 2016). "What's in a name? Weather, global warming and climate change". NASA Climate Change: Vital Signs of the Planet. Archived from the original on 28 September 2018. Retrieved 12 October 2018.
- Carlowicz, Michael (12 September 2018). "Watery heatwave cooks the Gulf of Maine". NASA's Earth Observatory.
- Shaftel, Holly; Jackson, Randal; Callery, Susan; Bailey, Daniel, eds. (7 July 2020). "Overview: Weather, Global Warming and Climate Change". Climate Change: Vital Signs of the Planet. Retrieved 14 July 2020.
- National Conference of State Legislators
- "State Renewable Portfolio Standards and Goals". National Conference of State Legislators. 17 April 2020. Retrieved 3 June 2020.
- National Geographic
- Welch, Craig (13 August 2019). "Arctic permafrost is thawing fast. That affects us all". National Geographic. Retrieved 25 August 2019.
- National Science Digital Library
- Fleming, James R. (17 March 2008). "Climate Change and Anthropogenic Greenhouse Warming: A Selection of Key Articles, 1824–1995, with Interpretive Essays". National Science Digital Library Project Archive PALE:ClassicArticles. Retrieved 7 October 2019.
- Natural Resources Defense Council
- "What Is the Clean Power Plan?". Natural Resources Defense Council. 29 September 2017. Retrieved 3 August 2020.
- Nature
- Schiermeier, Quirin (7 July 2015). "Climate scientists discuss future of their field". Nature. doi:10.1038/nature.2015.17917. Archived from the original on 11 October 2017.
- Crucifix, Michel (2016). "Earth's narrow escape from a big freeze". Nature. 529 (7585): 162–163. doi:10.1038/529162a. ISSN 1476-4687. PMID 26762453.
- The New York Times
- Rudd, Kevin (25 May 2015). "Paris Can't Be Another Copenhagen". The New York Times. Archived from the original on 3 February 2018. Retrieved 26 May 2015.
- Fandos, Nicholas (29 April 2017). "Climate March Draws Thousands of Protesters Alarmed by Trump's Environmental Agenda". The New York Times. ISSN 0362-4331. Archived from the original on 12 April 2019. Retrieved 12 April 2019.
- Friedman, Lisa (4 November 2019). "Trump Serves Notice to Quit Paris Climate Agreement". The New York Times. ISSN 0362-4331. Retrieved 20 November 2019.
- Albeck-Ripka, Livia (1 January 2020). "How to Reduce Your Carbon Footprint". New York Times. Retrieved 31 May 2020.
- NOAA
- NOAA (10 July 2011). "Polar Opposites: the Arctic and Antarctic". Archived from the original on 22 February 2019. Retrieved 20 February 2019.
- "What's the difference between global warming and climate change?". NOAA Climate.gov. 17 June 2015. Archived from the original on 7 November 2018. Retrieved 15 October 2018.
- Huddleston, Amara (17 July 2019). "Happy 200th birthday to Eunice Foote, hidden climate science pioneer". NOAA Climate.gov. Retrieved 8 October 2019.
- Lindsey, Rebecca (4 September 2018). "Did global warming stop in 1998?". NOAA. Archived from the original on 4 March 2019. Retrieved 20 February 2019.
- Our World in Data
- Ritchie, Hannah; Roser, Max (15 January 2018). "Land Use – Our World in Data". Our World in Data. Retrieved 1 December 2019.
- Ritchie, Hannah (2019). "Renewable Energy". OurWorldInData.org. Retrieved 31 July 2020.
- Pew Research Center
- Pew Research Center (24 June 2013). "Climate Change and Financial Instability Seen as Top Global Threats". Pew Research Center for the People & the Press. Archived from the original on 4 October 2013.
- Pew Research Center (5 November 2015). Global Concern about Climate Change, Broad Support for Limiting Emissions (Report). Archived from the original on 29 July 2017. Retrieved 7 August 2017.
- Pacific Environment
- Tyson, Dj (3 October 2018). "This is What Climate Change Looks Like in Alaska—Right Now". Pacific Environment. Retrieved 3 June 2020.
- The Public Domain Review
- Calel, Raphael (19 February 2014). "The Founding Fathers v. The Climate Change Skeptics". The Public Domain Review. Retrieved 16 September 2019.
- RIVM
- Documentary Sea Blind (Dutch Television) (in Dutch). RIVM: Netherlands National Institute for Public Health and the Environment. 11 October 2016. Archived from the original on 17 August 2018. Retrieved 26 February 2019.
- Salon
- Leopold, Evelyn (25 September 2019). "How leaders planned to avert climate catastrophe at the UN (while Trump hung out in the basement)". Salon. Retrieved 20 November 2019.
- ScienceBlogs
- Gleick, Peter (7 January 2017). "Statements on Climate Change from Major Scientific Academies, Societies, and Associations (January 2017 update)". ScienceBlogs. Retrieved 2 April 2020.
- Scientific American
- Ogburn, Stephanie Paige (29 April 2014). "Indian Monsoons Are Becoming More Extreme". Scientific American. Archived from the original on 22 June 2018.
- Sneed, Annie (23 January 2018). "Ask the Experts: Does Rising CO2 Benefit Plants?". Scientific American. Archived from the original on 29 March 2019. Retrieved 27 February 2019.
- Smithsonian
- Wing, Scott L. (29 June 2016). "Studying the Climate of the Past Is Essential for Preparing for Today's Rapidly Changing Climate". Smithsonian. Retrieved 8 November 2019.
- The Sustainability Consortium
- "One-Fourth of Global Forest Loss Permanent: Deforestation Is Not Slowing Down". The Sustainability Consortium. 13 September 2018. Retrieved 1 December 2019.
- UN Environment
- "The Montreal Protocol: triumph by treaty". UN Environment. 20 November 2017. Archived from the original on 12 April 2019. Retrieved 12 April 2019.
- "Curbing environmentally unsafe, irregular and disorderly migration". UN Environment. 25 October 2018. Archived from the original on 18 April 2019. Retrieved 18 April 2019.
- UNFCCC
- "What are United Nations Climate Change Conferences?". UNFCCC. Archived from the original on 12 May 2019. Retrieved 12 May 2019.
- "What is the United Nations Framework Convention on Climate Change?". UNFCCC.
- Union of Concerned Scientists
- "Tropical Deforestation and Global Warming". Union of Concerned Scientists. 9 December 2012. Retrieved 6 August 2020.
- "Environmental Impacts of Renewable Energy Technologies". Union of Concerned Scientists. 5 March 2013. Retrieved 15 May 2020.
- "Carbon Pricing 101". Union of Concerned Scientists. 8 January 2017. Retrieved 15 May 2020.
- USA Today
- Rice, Doyle (21 November 2019). "'Climate emergency' is Oxford Dictionary's word of the year". USA Today. Retrieved 3 December 2019.
- Vice
- Segalov, Michael (2 May 2019). "The UK Has Declared a Climate Emergency: What Now?". Vice. Retrieved 30 June 2019.
- The Verge
- Calma, Justine (27 December 2019). "2019 was the year of 'climate emergency' declarations". The Verge. Retrieved 28 March 2020.
- Vox
- Roberts, D. (20 September 2019). "Getting to 100% renewables requires cheap energy storage. But how cheap?". Vox. Retrieved 28 May 2020.
- The Washington Post
- Kaplan, Sarah (30 August 2018). "Climate change could render many of Earth's ecosystems unrecognizable". The Washington Post. Archived from the original on 30 August 2018. Retrieved 30 August 2018.
- World Resources Institute
- Levin, Kelly (8 August 2019). "How Effective Is Land At Removing Carbon Pollution? The IPCC Weighs In". World Resources institute. Retrieved 15 May 2020.
- Seymour, Frances; Gibbs, David (8 December 2019). "Forests in the IPCC Special Report on Land Use: 7 Things to Know". World Resources Institute.
- Yale Climate Connections
- Peach, Sara (2 November 2010). "Yale Researcher Anthony Leiserowitz on Studying, Communicating with American Public". Yale Climate Connections. Archived from the original on 7 February 2019. Retrieved 30 July 2018.
External links
| Library resources about Global warming |
- Climate Change at the National Academies – Repository for reports
- Met Office: Climate Guide – UK National Weather Service
- Educational Global Climate Modelling (EdGCM) – Research-quality climate change simulator
- Global Climate Change Indicators – NOAA
- Result of total melting of Polar regions on World – National Geographic
| |||||||||||||
| |||||||||||||
| |||||||||||||
| |||||||||||||
| |||||||||||||
| |||||||||||||
| |||||||||||||
| Continents |  | |
|---|---|---|
| Oceans | ||
| Geology | ||
| Atmosphere | ||
| Environment | ||
| Culture and society | ||
| Planetary science | ||
| ||
| Authority control |
|
|---|