2016 United States presidential election in Nebraska
The 2016 United States presidential election in Nebraska was held on November 8, 2016, as part of the 2016 United States presidential election in which all 50 states plus the District of Columbia participated. Nebraska voters chose electors to represent them in the Electoral College via a popular vote pitting the Republican Party's nominee, businessman Donald Trump, and running mate Indiana Governor Mike Pence against Democratic Party nominee, former Secretary of State Hillary Clinton and her running mate, Virginia Senator Tim Kaine.
| ||||||||||||||||||||||||||
| Turnout | 71.06% | |||||||||||||||||||||||||
|---|---|---|---|---|---|---|---|---|---|---|---|---|---|---|---|---|---|---|---|---|---|---|---|---|---|---|
| ||||||||||||||||||||||||||
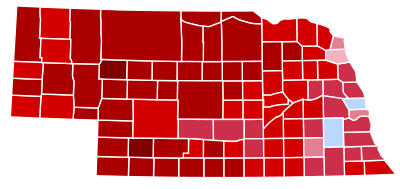 County Results
| ||||||||||||||||||||||||||
| ||||||||||||||||||||||||||
| Elections in Nebraska |
|---|
 |
|
|
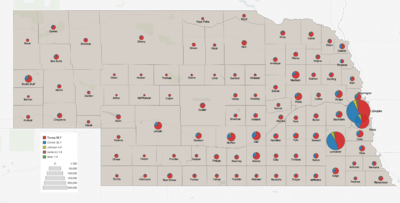
On May 10, 2016, in the presidential primaries, voters expressed their preferences for the Republican and Libertarian parties' respective nominees for president. Voters expressed their preferences for the Democratic party's nominee via caucus on March 5, 2016. Registered members of each party may only vote in their party's primary, while unaffiliated voters chose any one primary in which to vote.
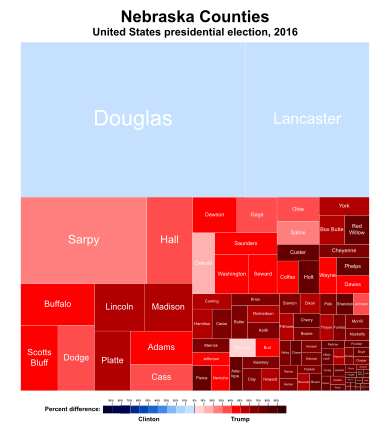
Donald Trump won the election in Nebraska with 58.7% of the vote. Hillary Clinton received 33.7% of the vote.[1]
Democratic caucus
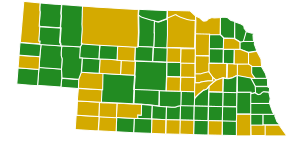
Democratic presidential caucuses
| Nebraska Democratic caucuses, March 5, 2016 | |||||
|---|---|---|---|---|---|
| Candidate | Popular vote | Estimated delegates | |||
| Count | Percentage | Pledged | Unpledged | Total | |
| Bernie Sanders | 19,120 | 57.14% | 15 | 1 | 16 |
| Hillary Clinton | 14,340 | 42.86% | 10 | 3 | 13 |
| Uncommitted | N/A | 0 | 1 | 1 | |
| Total | 33,460 | 100% | 25 | 5 | 30 |
| Source: The Green Papers | |||||
Democratic presidential primary (non-binding)
The Nebraska Democratic primary was held on May 10, 2016. The primary does not bind delegates. Delegates were bound by the caucuses on March 5, 2016.
| Nebraska Democratic primary, May 10, 2016 | |||||
|---|---|---|---|---|---|
| Candidate | Popular vote | Estimated delegates | |||
| Count | Percentage | Pledged | Unpledged | Total | |
| Hillary Clinton | 42,692 | 53.08% | N/A | ||
| Bernie Sanders | 37,744 | 46.92% | N/A | ||
| Total | 80,436 | 100% | N/A | ||
| Source: Nebraska Secretary of State Election - Official Primary Results | |||||
Republican primary
| |||||||||||||||||||||||||||||||||||||||||
| |||||||||||||||||||||||||||||||||||||||||
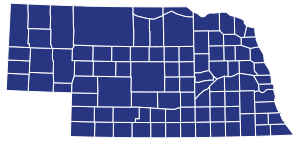 Nebraska results by county
Donald Trump (Note: Italicization indicates a withdrawn candidacy) | |||||||||||||||||||||||||||||||||||||||||
Twelve candidates appeared on the Republican presidential primary ballot:[2][3]
- Ben Carson (withdrawn)
- Ted Cruz (withdrawn)
- John Kasich (withdrawn)
- Marco Rubio (withdrawn)
- Donald Trump
| Nebraska Republican primary, May 10, 2016 | |||||
|---|---|---|---|---|---|
| Candidate | Votes | Percentage | Actual delegate count | ||
| Bound | Unbound | Total | |||
| Donald Trump | 122,327 | 61.47% | 36 | 0 | 36 |
| Ted Cruz (withdrawn) | 36,703 | 18.44% | 0 | 0 | 0 |
| John Kasich (withdrawn) | 22,709 | 11.41% | 0 | 0 | 0 |
| Ben Carson (withdrawn) | 10,016 | 5.03% | 0 | 0 | 0 |
| Marco Rubio (withdrawn) | 7,233 | 3.63% | 0 | 0 | 0 |
| Unprojected delegates: | 0 | 0 | 0 | ||
| Total: | 198,988 | 100.00% | 36 | 0 | 36 |
| Source: The Green Papers | |||||
Libertarian primary
| ||||||||||||||||||||||||||||||||||||||||
| ||||||||||||||||||||||||||||||||||||||||
 Nebraska results by county
| ||||||||||||||||||||||||||||||||||||||||
The Nebraska primary was held on May 10, 2016. Independents and registered Libertarians were allowed to vote in the state's Libertarian primary. The Nebraska Primary marked the third large victory for Gary Johnson in the handful of states that conduct Libertarian presidential primaries. However, since the Libertarian Party does not use such primaries for selecting delegates to its national nominating convention, the results were effectively non-binding.
| 2016 Nebraska Libertarian primary[4] | ||
|---|---|---|
| Candidate | Popular vote | |
| Count | Percentage | |
| 375 | 52.08% | |
| Austin Petersen | 135 | 18.75% |
| John McAfee | 124 | 17.22% |
| Marc Allan Feldman | 47 | 6.53% |
| Steve Kerbel | 35 | 4.86% |
| Total: | 720 | 100% |
General election polling
- Nebraska's 1st Congressional District
| Poll source | Date(s) administered |
Sample size |
Margin of error |
Hillary Clinton (D) |
Donald Trump (R) |
Gary Johnson (L) |
Other | Undecided |
|---|---|---|---|---|---|---|---|---|
| Emerson College[5] | September 25–27, 2016 | 233 | 29% | 53% | — | — | — |
- Nebraska's 2nd Congressional District
| Poll source | Date(s) administered |
Sample size |
Margin of error |
Hillary Clinton (D) |
Donald Trump (R) |
Gary Johnson (L) |
Other | Undecided |
|---|---|---|---|---|---|---|---|---|
| Emerson College[5] | September 25–27, 2016 | 233 | 40% | 49% | — | — | — | |
| The Singularis Group, LLC[6] | May 11–12, 2016 | 1,007 | ± 3.08% | 36% | 44% | — | — | 20% |
- Nebraska's 3rd Congressional District
| Poll source | Date(s) administered |
Sample size |
Margin of error |
Hillary Clinton (D) |
Donald Trump (R) |
Gary Johnson (L) |
Other | Undecided |
|---|---|---|---|---|---|---|---|---|
| Emerson College[5] | September 25–27, 2016 | 234 | 20% | 65% | — | — | — |
Predictions
The following are final 2016 predictions from various organizations for Nebraska as of Election Day.
- Los Angeles Times: Strongly Trump[7]
- CNN: Solid Trump[8]
- Sabato's Crystal Ball: Safe Trump[9]
- NBC: Likely Trump[10]
- RealClearPolitics: Solid Trump[11]
- Fox News: Solid Republican[12]
- ABC: Solid Trump[13]
Results
| 2016 United States presidential election in Nebraska | ||||||
|---|---|---|---|---|---|---|
| Party | Candidate | Running mate | Votes | Percentage | Electoral votes | |
| Republican | Donald Trump | Mike Pence | 495,961 | 58.75% | 5 | |
| Democratic | Hillary Clinton | Tim Kaine | 284,494 | 33.70% | 0 | |
| Libertarian | Gary Johnson | William Weld | 38,946 | 4.61% | 0 | |
| Write-Ins | 16,051 | 1.90% | 0 | |||
| Green | Jill Stein | Ajamu Baraka | 8,775 | 1.04% | 0 | |
| Totals | 844,227 | 100.00% | 5 | |||
Results by county
Final results by county from the Nebraska Secretary Of State.[14]
| County | Candidate | Total | |||||
|---|---|---|---|---|---|---|---|
| Trump | Clinton | Johnson | (write-in) | Stein | |||
| Adams | percent | 68.73% | 24.44% | 4.40% | 1.62% | 0.82% | 100.00% |
| Votes | 9,287 | 3,302 | 594 | 219 | 111 | 13,513 | |
| Antelope | percent | 83.27% | 11.67% | 3.20% | 1.28% | 0.58% | 100.00% |
| Votes | 2,732 | 383 | 105 | 42 | 19 | 3,281 | |
| Arthur | percent | 89.38% | 6.23% | 4.03% | 0.37% | 0.00% | 100.00% |
| Votes | 244 | 17 | 11 | 1 | 0 | 273 | |
| Banner | percent | 88.81% | 4.73% | 3.48% | 2.24% | 0.75% | 100.00% |
| Votes | 357 | 19 | 14 | 9 | 3 | 402 | |
| Blaine | percent | 87.07% | 9.46% | 3.15% | 0.32% | 0.00% | 100.00% |
| Votes | 276 | 30 | 10 | 1 | 0 | 317 | |
| Boone | percent | 79.14% | 14.25% | 4.72% | 1.31% | 0.59% | 100.00% |
| Votes | 2,299 | 414 | 137 | 38 | 17 | 2,905 | |
| Box Butte | percent | 73.46% | 19.60% | 4.67% | 1.54% | 0.73% | 100.00% |
| Votes | 3,617 | 965 | 230 | 76 | 36 | 4,924 | |
| Boyd | percent | 85.03% | 11.07% | 1.99% | 0.78% | 1.12% | 100.00% |
| Votes | 983 | 128 | 23 | 9 | 13 | 1,156 | |
| Brown | percent | 86.73% | 9.58% | 2.44% | 0.81% | 0.44% | 100.00% |
| Votes | 1,385 | 153 | 39 | 13 | 7 | 1,597 | |
| Buffalo | percent | 68.95% | 22.54% | 5.56% | 1.87% | 1.07% | 100.00% |
| Votes | 14,569 | 4,763 | 1,174 | 396 | 227 | 21,129 | |
| Burt | percent | 66.53% | 26.14% | 5.54% | 0.70% | 1.10% | 100.00% |
| Votes | 2,367 | 930 | 197 | 25 | 39 | 3,558 | |
| Butler | percent | 77.34% | 17.36% | 3.24% | 1.38% | 0.68% | 100.00% |
| votes | 3,079 | 691 | 129 | 55 | 27 | 3,981 | |
| Cass | percent | 65.35% | 26.94% | 4.94% | 1.75% | 1.02% | 100.00% |
| votes | 8,452 | 3,484 | 639 | 226 | 132 | 12,933 | |
| Cedar | percent | 79.91% | 12.92% | 5.07% | 1.40% | 0.70% | 100.00% |
| votes | 3,532 | 571 | 224 | 62 | 31 | 4,420 | |
| Chase | percent | 86.83% | 9.01% | 2.85% | 1.00% | 0.32% | 100.00% |
| votes | 1,648 | 171 | 54 | 19 | 6 | 1,898 | |
| Cherry | percent | 84.12% | 10.17% | 4.07% | 1.15% | 0.48% | 100.00% |
| votes | 2,623 | 317 | 127 | 36 | 15 | 3,118 | |
| Cheyenne | percent | 77.80% | 15.09% | 4.52% | 1.61% | 0.98% | 100.00% |
| votes | 3,665 | 711 | 213 | 76 | 46 | 4,711 | |
| Clay | percent | 79.02% | 15.56% | 3.78% | 1.14% | 0.49% | 100.00% |
| votes | 2,422 | 477 | 116 | 35 | 15 | 3,065 | |
| Colfax | percent | 67.55% | 26.73% | 3.67% | 1.24% | 0.81% | 100.00% |
| votes | 2,171 | 859 | 118 | 40 | 26 | 3,214 | |
| Cuming | percent | 76.63% | 17.65% | 3.85% | 1.23% | 0.64% | 100.00% |
| votes | 3,122 | 719 | 157 | 50 | 26 | 4,074 | |
| Custer | percent | 83.07% | 11.34% | 3.64% | 1.29% | 0.65% | 100.00% |
| votes | 4,695 | 641 | 206 | 73 | 37 | 5,652 | |
| Dakota | percent | 57.59% | 36.85% | 3.65% | 1.11% | 0.80% | 100.00% |
| votes | 3,616 | 2,314 | 229 | 70 | 50 | 6,279 | |
| Dawes | percent | 71.60% | 21.79% | 5.20% | 0.00% | 1.41% | 100.00% |
| votes | 2,632 | 801 | 191 | 0 | 52 | 3,676 | |
| Dawson | percent | 69.30% | 24.74% | 4.41% | 0.88% | 0.67% | 100.00% |
| votes | 5,984 | 2,136 | 381 | 76 | 58 | 8,635 | |
| Deuel | percent | 82.22% | 12.20% | 4.78% | 0.71% | 0.10% | 100.00% |
| votes | 809 | 120 | 47 | 7 | 1 | 984 | |
| Dixon | percent | 73.36% | 19.99% | 4.67% | 1.37% | 0.61% | 100.00% |
| votes | 2,041 | 556 | 130 | 38 | 17 | 2,782 | |
| Dodge | percent | 63.96% | 29.26% | 4.02% | 1.71% | 1.04% | 100.00% |
| votes | 9,933 | 4,544 | 624 | 266 | 162 | 15,529 | |
| Douglas | percent | 44.95% | 47.33% | 4.33% | 2.19% | 1.20% | 100.00% |
| votes | 108,077 | 113,798 | 10,402 | 5,274 | 2,882 | 240,433 | |
| Dundy | percent | 86.36% | 9.34% | 3.25% | 0.42% | 0.63% | 100.00% |
| votes | 823 | 89 | 31 | 4 | 6 | 953 | |
| Fillmore | percent | 72.42% | 20.84% | 5.13% | 0.88% | 0.71% | 100.00% |
| votes | 2,130 | 613 | 151 | 26 | 21 | 2,941 | |
| Franklin | percent | 80.51% | 14.94% | 3.23% | 0.90% | 0.42% | 100.00% |
| votes | 1,347 | 250 | 54 | 15 | 7 | 1,673 | |
| Frontier | percent | 83.58% | 12.12% | 2.71% | 0.98% | 0.60% | 100.00% |
| votes | 1,110 | 161 | 36 | 13 | 8 | 1,328 | |
| Furnas | percent | 82.09% | 12.99% | 3.63% | 0.81% | 0.47% | 100.00% |
| votes | 1,921 | 304 | 85 | 19 | 11 | 2,340 | |
| Gage | percent | 63.50% | 29.21% | 4.90% | 1.36% | 1.04% | 100.00% |
| votes | 6,380 | 2,935 | 492 | 137 | 104 | 10,048 | |
| Garden | percent | 80.84% | 14.23% | 3.63% | 1.12% | 0.19% | 100.00% |
| votes | 869 | 153 | 39 | 12 | 2 | 1,075 | |
| Garfield | percent | 83.78% | 12.35% | 2.35% | 1.02% | 0.51% | 100.00% |
| votes | 821 | 121 | 23 | 10 | 5 | 980 | |
| Gosper | percent | 78.61% | 16.44% | 3.76% | 0.59% | 0.59% | 100.00% |
| votes | 794 | 166 | 38 | 6 | 6 | 1,010 | |
| Grant | percent | 90.62% | 4.94% | 1.48% | 2.72% | 0.25% | 100.00% |
| votes | 367 | 20 | 6 | 11 | 1 | 405 | |
| Greeley | percent | 77.62% | 17.87% | 3.23% | 0.77% | 0.51% | 100.00% |
| votes | 912 | 210 | 38 | 9 | 6 | 1,175 | |
| Hall | percent | 65.31% | 28.48% | 4.06% | 1.28% | 0.87% | 100.00% |
| votes | 14,408 | 6,282 | 895 | 283 | 192 | 22,060 | |
| Hamilton | percent | 75.60% | 17.55% | 4.48% | 1.52% | 0.86% | 100.00% |
| votes | 3,783 | 878 | 224 | 76 | 43 | 5,004 | |
| Harlan | percent | 81.66% | 13.86% | 3.38% | 0.71% | 0.38% | 100.00% |
| votes | 1,496 | 254 | 62 | 13 | 7 | 1,832 | |
| Hayes | percent | 91.83% | 5.84% | 1.56% | 0.58% | 0.19% | 100.00% |
| votes | 472 | 30 | 8 | 3 | 1 | 514 | |
| Hitchcock | percent | 83.92% | 10.97% | 4.16% | 0.48% | 0.48% | 100.00% |
| votes | 1,232 | 161 | 61 | 7 | 7 | 1,468 | |
| Holt | percent | 85.07% | 10.38% | 3.17% | 0.86% | 0.53% | 100.00% |
| votes | 4,354 | 531 | 162 | 44 | 27 | 5,118 | |
| Hooker | percent | 85.13% | 9.59% | 3.84% | 0.72% | 0.72% | 100.00% |
| votes | 355 | 40 | 16 | 3 | 3 | 417 | |
| Howard | percent | 76.29% | 18.17% | 3.61% | 1.20% | 0.73% | 100.00% |
| votes | 2,284 | 544 | 108 | 36 | 22 | 2,994 | |
| Jefferson | percent | 68.66% | 23.96% | 5.21% | 1.32% | 0.86% | 100.00% |
| votes | 2,399 | 837 | 182 | 46 | 30 | 3,494 | |
| Johnson | percent | 64.86% | 26.95% | 5.84% | 1.29% | 1.05% | 100.00% |
| votes | 1,355 | 563 | 122 | 27 | 22 | 2,089 | |
| Kearney | percent | 76.79% | 16.69% | 4.49% | 1.24% | 0.79% | 100.00% |
| votes | 2,531 | 550 | 148 | 41 | 26 | 3,296 | |
| Keith | percent | 80.19% | 14.15% | 4.07% | 0.97% | 0.62% | 100.00% |
| votes | 3,235 | 571 | 164 | 39 | 25 | 4,034 | |
| Keya Paha | percent | 88.63% | 7.71% | 3.28% | 0.39% | 0.00% | 100.00% |
| votes | 460 | 40 | 17 | 2 | 0 | 519 | |
| Kimball | percent | 79.31% | 13.71% | 4.65% | 1.25% | 1.07% | 100.00% |
| votes | 1,330 | 230 | 78 | 21 | 18 | 1,677 | |
| Knox | percent | 77.47% | 17.50% | 3.33% | 1.00% | 0.70% | 100.00% |
| votes | 3,188 | 720 | 137 | 41 | 29 | 4,115 | |
| Lancaster | percent | 45.21% | 45.44% | 5.22% | 2.68% | 1.45% | 100.00% |
| votes | 61,588 | 61,898 | 7,109 | 3,654 | 1,974 | 136,223 | |
| Lincoln | percent | 75.41% | 18.06% | 4.41% | 1.46% | 0.66% | 100.00% |
| votes | 12,164 | 2,913 | 711 | 236 | 107 | 16,131 | |
| Logan | percent | 88.30% | 7.06% | 3.97% | 0.44% | 0.22% | 100.00% |
| votes | 400 | 32 | 18 | 2 | 1 | 453 | |
| Loup | percent | 83.90% | 12.47% | 2.60% | 0.78% | 0.26% | 100.00% |
| votes | 323 | 48 | 10 | 3 | 1 | 385 | |
| Madison | percent | 74.10% | 18.90% | 4.66% | 1.46% | 0.88% | 100.00% |
| votes | 10,628 | 2,711 | 669 | 209 | 126 | 14,343 | |
| McPherson | percent | 89.55% | 4.88% | 4.88% | 0.35% | 0.35% | 100.00% |
| votes | 257 | 14 | 14 | 1 | 1 | 287 | |
| Merrick | percent | 77.24% | 15.89% | 4.36% | 1.74% | 0.77% | 100.00% |
| votes | 2,926 | 602 | 165 | 66 | 29 | 3,788 | |
| Morrill | percent | 81.58% | 12.86% | 3.80% | 1.13% | 0.63% | 100.00% |
| votes | 1,802 | 284 | 84 | 25 | 14 | 2,209 | |
| Nance | percent | 77.79% | 17.33% | 2.96% | 1.05% | 0.86% | 100.00% |
| votes | 1,261 | 281 | 48 | 17 | 14 | 1,621 | |
| Nemaha | percent | 66.94% | 24.83% | 5.69% | 1.68% | 0.85% | 100.00% |
| votes | 2,116 | 785 | 180 | 53 | 27 | 3,161 | |
| Nuckolls | percent | 78.28% | 16.01% | 3.99% | 0.82% | 0.91% | 100.00% |
| votes | 1,726 | 353 | 88 | 18 | 20 | 2,205 | |
| Otoe | percent | 65.17% | 27.16% | 5.03% | 1.86% | 0.78% | 100.00% |
| votes | 4,860 | 2,025 | 375 | 139 | 58 | 7,457 | |
| Pawnee | percent | 73.40% | 21.02% | 4.14% | 0.68% | 0.75% | 100.00% |
| votes | 974 | 279 | 55 | 9 | 10 | 1,327 | |
| Perkins | percent | 83.64% | 11.07% | 3.71% | 1.24% | 0.34% | 100.00% |
| votes | 1,217 | 161 | 54 | 18 | 5 | 1,455 | |
| Phelps | percent | 81.98% | 12.18% | 4.05% | 1.41% | 0.38% | 100.00% |
| votes | 3,849 | 572 | 190 | 66 | 18 | 4,695 | |
| Pierce | percent | 84.08% | 10.52% | 3.44% | 1.38% | 0.58% | 100.00% |
| votes | 3,052 | 382 | 125 | 50 | 21 | 3,630 | |
| Platte | percent | 75.97% | 18.33% | 3.43% | 1.67% | 0.60% | 100.00% |
| votes | 10,965 | 2,646 | 495 | 241 | 86 | 14,433 | |
| Polk | percent | 78.54% | 16.00% | 3.95% | 1.28% | 0.23% | 100.00% |
| votes | 2,028 | 413 | 102 | 33 | 6 | 2,582 | |
| Red Willow | percent | 82.36% | 12.48% | 3.69% | 0.97% | 0.50% | 100.00% |
| votes | 4,258 | 645 | 191 | 50 | 26 | 5,170 | |
| Richardson | percent | 72.77% | 21.50% | 4.18% | 0.84% | 0.71% | 100.00% |
| votes | 2,769 | 818 | 159 | 32 | 27 | 3,805 | |
| Rock | percent | 86.09% | 8.77% | 4.14% | 0.50% | 0.50% | 100.00% |
| votes | 687 | 70 | 33 | 4 | 4 | 798 | |
| Saline | percent | 58.49% | 33.74% | 5.53% | 1.23% | 1.01% | 100.00% |
| votes | 3,004 | 1,733 | 284 | 63 | 52 | 5,136 | |
| Sarpy | percent | 56.02% | 34.79% | 5.81% | 2.34% | 1.04% | 100.00% |
| votes | 45,143 | 28,033 | 4,682 | 1,886 | 836 | 80,580 | |
| Saunders | percent | 69.57% | 23.23% | 4.74% | 1.57% | 0.89% | 100.00% |
| votes | 7,555 | 2,523 | 515 | 170 | 97 | 10,860 | |
| Scotts Bluff | percent | 70.38% | 22.40% | 4.77% | 1.57% | 0.88% | 100.00% |
| votes | 10,076 | 3,207 | 683 | 225 | 126 | 14,317 | |
| Seward | percent | 68.85% | 23.67% | 4.25% | 2.17% | 1.06% | 100.00% |
| votes | 5,454 | 1,875 | 337 | 172 | 84 | 7,922 | |
| Sheridan | percent | 84.78% | 11.00% | 2.68% | 0.84% | 0.69% | 100.00% |
| votes | 2,211 | 287 | 70 | 22 | 18 | 2,608 | |
| Sherman | percent | 73.11% | 21.61% | 3.75% | 0.70% | 0.83% | 100.00% |
| votes | 1,150 | 340 | 59 | 11 | 13 | 1,573 | |
| Sioux | percent | 83.70% | 11.01% | 3.80% | 0.95% | 0.54% | 100.00% |
| votes | 616 | 81 | 28 | 7 | 4 | 736 | |
| Stanton | percent | 78.08% | 14.89% | 5.14% | 1.39% | 0.50% | 100.00% |
| votes | 2,187 | 417 | 144 | 39 | 14 | 2,801 | |
| Thayer | percent | 76.25% | 18.55% | 4.61% | 0.22% | 0.37% | 100.00% |
| votes | 2,051 | 499 | 124 | 6 | 10 | 2,690 | |
| Thomas | percent | 87.53% | 7.63% | 2.54% | 1.53% | 0.76% | 100.00% |
| votes | 344 | 30 | 10 | 6 | 3 | 393 | |
| Thurston | percent | 49.95% | 44.01% | 2.68% | 1.01% | 2.35% | 100.00% |
| votes | 1,043 | 919 | 56 | 21 | 49 | 2,088 | |
| Valley | percent | 80.73% | 15.37% | 2.40% | 0.95% | 0.54% | 100.00% |
| votes | 1,780 | 339 | 53 | 21 | 12 | 2,205 | |
| Washington | percent | 68.54% | 24.22% | 4.74% | 1.62% | 0.90% | 100.00% |
| votes | 7,424 | 2,623 | 513 | 175 | 97 | 10,832 | |
| Wayne | percent | 71.32% | 22.11% | 5.35% | 0.29% | 0.93% | 100.00% |
| votes | 2,693 | 835 | 202 | 11 | 35 | 3,776 | |
| Webster | percent | 77.87% | 17.92% | 2.99% | 0.64% | 0.59% | 100.00% |
| votes | 1,330 | 306 | 51 | 11 | 10 | 1,708 | |
| Wheeler | percent | 81.08% | 13.33% | 3.66% | 1.08% | 0.86% | 100.00% |
| votes | 377 | 62 | 17 | 5 | 4 | 465 | |
| York | percent | 73.66% | 18.59% | 5.41% | 1.54% | 0.81% | 100.00% |
| votes | 4,700 | 1,186 | 345 | 98 | 52 | 6,381 | |
| Total | percent | 58.75% | 33.70% | 4.61% | 1.90% | 1.04% | 100.00% |
| votes | 495,961 | 284,494 | 38,946 | 16,051 | 8,775 | 844,227 | |
By congressional district
Trump won all of the state's three congressional districts, winning all of the state's electoral votes.[15]
| District | Trump | Clinton | Representative |
|---|---|---|---|
| 1st | 56% | 36% | Jeff Fortenberry |
| 2nd | 47% | 45% | Brad Ashford |
| Don Bacon | |||
| 3rd | 74% | 20% | Adrian Smith |
Counties that swung from Republican to Democratic
See also
References
- https://www.nytimes.com/elections/results/nebraska
- WRAL: NC approves 27 candidates for presidential primary ballots
- NC State Board of Elections presidential primary candidates' list (preliminary)
- "Unofficial Results: Primary Election - May 10, 2016". Nebraska Secretary of State. May 10, 2016. Retrieved July 22, 2016.
- "Emerson Poll: Washington State Looks Safe for Democrats in the Presidential and Senate Races; Trump Has a Wide Lead in Nebraska" (PDF). Emerson College. Retrieved September 28, 2016.
- "BACON LEADS ASHFORD IN LATEST POLL". The Singularis Group, LLC. Don Bacon for Congress. May 16, 2016. Archived from the original on September 10, 2016. Retrieved August 14, 2016.
- "Our final map has Clinton winning with 352 electoral votes. Compare your picks with ours". Los Angeles Times. 2016-11-06. Retrieved 2016-11-13.
- "Road to 270: CNN's general election map - CNNPolitics.com". Cnn.com. 2016-11-08. Retrieved 2016-11-13.
- "Larry J. Sabato's Crystal Ball » 2016 President". Centerforpolitics.org. 2016-11-07. Retrieved 2016-11-13.
- Todd, Chuck. "NBC's Final Battleground Map Shows Clinton With a Significant Lead". NBC News. Retrieved 2016-11-13.
- "2016 Election Maps - Battle for White House". RealClearPolitics. Retrieved 2016-11-13.
- "Electoral Scorecard: Map shifts again in Trump's favor, as Clinton holds edge". Fox News. 2016-11-07. Retrieved 2016-11-13.
- "The Final 15: The Latest Polls in the Swing States That Will Decide the Election". Abcnews.go.com. 2016-11-07. Retrieved 2016-11-13.
- Revised Official Report of the Board of State Canvassers General Election November 8, 2016 Archived December 20, 2016, at the Wayback Machine John A. Gale Nebraska Secretary Of State.
- https://www.cookpolitical.com/introducing-2017-cook-political-report-partisan-voter-index
.jpg)

.jpg)


_(cropped).jpg)
.jpg)
