Hancock County, Georgia
Hancock County is a county located in the U.S. state of Georgia. As of the 2010 census, the population was 9,429.[1] The county seat is Sparta.[2] The county was created on December 17, 1793 and named for John Hancock.[3][4]
Hancock County | |
|---|---|
 Hancock County Courthouse and Confederate Monument in Sparta | |
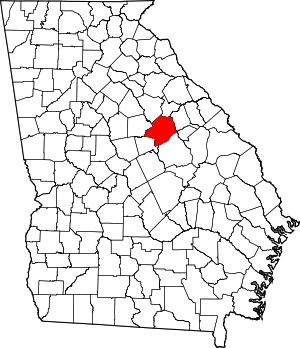 Location within the U.S. state of Georgia | |
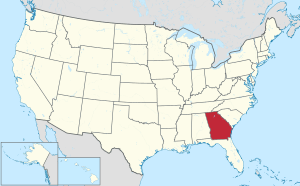 Georgia's location within the U.S. | |
| Coordinates: 33°16′N 83°00′W | |
| Country | |
| State | |
| Founded | December 17, 1793 |
| Named for | John Hancock |
| Seat | Sparta |
| Largest city | Sparta |
| Area | |
| • Total | 479 sq mi (1,240 km2) |
| • Land | 472 sq mi (1,220 km2) |
| • Water | 6.8 sq mi (18 km2) 1.4%% |
| Population | |
| • Estimate (2018) | 8,348 |
| • Density | 20/sq mi (8/km2) |
| Time zone | UTC−5 (Eastern) |
| • Summer (DST) | UTC−4 (EDT) |
| Congressional district | 10th |
| Website | www |
.jpg)
Hancock County is included in the Milledgeville, Georgia Micropolitan Statistical Area.
History
Before the Civil War, Hancock County's economy was based on growing cotton, and labor was done by slaves. This area is classified as part of the Black Belt of the United States, due to its fertile soil and association with the slave society. Slaves made up 61% of the total county population in the 1850 Census.[5] Unusually for such a plantation-dominated society, the county's representatives at the Georgia Secession Convention, overwhelmingly white and Democratic, voted against secession in 1861.[6]
The secession conventions were dominated by men who voted for separation, and Georgia soon seceded and entered the war.
Race relations
According to the 2010 census[7] estimate, the racial makeup of the county seat of Sparta was 84% African American, 15% White, 0.50% from two or more races, 0.30% Asian, and 0.10% Native American. Hispanic or Latino of any race were 0.70% of the population. Most African Americans support the Democratic Party and whites support the Republican Party.
In August 2015, the majority-white Hancock County Board of Elections initiated an effort to purge African-American voters from the rolls. They directed deputy sheriffs to the homes of more than 180 African Americans residing in the county seat of Sparta (these constituted some 20% of the city's total registered voters) to inform them they would lose their voting rights unless they appeared in court to prove their residency. A total of 53 voters were removed the voting rolls, but a federal judge overturned the Board's actions.[8]
Geography
According to the U.S. Census Bureau, the county has a total area of 479 square miles (1,240 km2), of which 472 square miles (1,220 km2) is land and 6.8 square miles (18 km2) (1.4%) is water.[9]
The western portion of Hancock County, which is defined by a line running southeast from White Plains to the intersection of State Route 22 and Springfield Road, then running southwest along State Route 22, is located in the Upper Oconee River sub-basin of the Altamaha River basin. The southern portion of the county, defined by a triangle made of State Route 22 and State Route 15, with Sparta at its apex, is located in the Lower Oconee River sub-basin of the same Altamaha River basin. The northeastern portion of Hancock County is located in the Upper Ogeechee River sub-basin of the Ogeechee River basin.[10]
Major highways
No Interstate Highway


Adjacent counties
- Taliaferro County - north
- Warren County - northeast
- Glascock County - east
- Washington County - southeast
- Baldwin County - southwest
- Putnam County - west
- Greene County - northwest
Demographics
| Historical population | |||
|---|---|---|---|
| Census | Pop. | %± | |
| 1800 | 14,456 | — | |
| 1810 | 13,330 | −7.8% | |
| 1820 | 12,734 | −4.5% | |
| 1830 | 11,820 | −7.2% | |
| 1840 | 9,659 | −18.3% | |
| 1850 | 11,578 | 19.9% | |
| 1860 | 12,044 | 4.0% | |
| 1870 | 11,317 | −6.0% | |
| 1880 | 16,989 | 50.1% | |
| 1890 | 17,149 | 0.9% | |
| 1900 | 18,277 | 6.6% | |
| 1910 | 19,189 | 5.0% | |
| 1920 | 18,357 | −4.3% | |
| 1930 | 13,070 | −28.8% | |
| 1940 | 12,764 | −2.3% | |
| 1950 | 11,052 | −13.4% | |
| 1960 | 9,979 | −9.7% | |
| 1970 | 9,019 | −9.6% | |
| 1980 | 9,466 | 5.0% | |
| 1990 | 8,908 | −5.9% | |
| 2000 | 10,076 | 13.1% | |
| 2010 | 9,429 | −6.4% | |
| Est. 2018 | 8,348 | [11] | −11.5% |
| U.S. Decennial Census[12] 1790-1960[13] 1900-1990[14] 1990-2000[15] 2010-2013[1] | |||
2000 census
At the 2000 census there were 10,076 people, 3,237 households, and 2,311 families living in the county. The population density was 21 people per square mile (8/km²). There were 4,287 housing units at an average density of 9 per square mile (4/km²). The racial makeup of the county was 77.76% Black or African American, 21.46% White, 0.16% Native American, 0.11% Asian, 0.14% from other races, and 0.38% from two or more races. 0.54%.[16] were Hispanic or Latino of any race.
Of the 3,237 households 31.30% had children under the age of 18 living with them, 38.00% were married couples living together, 28.20% had a female householder with no husband present, and 28.60% were non-families. 26.10% of households were one person and 10.80% were one person aged 65 or older. The average household size was 2.66 and the average family size was 3.22.
The age distribution was 24.10% under the age of 18, 9.90% from 18 to 24, 31.00% from 25 to 44, 23.00% from 45 to 64, and 12.00% 65 or older. The median age was 36 years. For every 100 females, there were 114.60 males. For every 100 females age 18 and over, there were 118.20 males.
The median household income was $22,003 and the median family income was $27,232. Males had a median income of $26,062 versus $19,328 for females. The per capita income for the county was $10,916. About 26.10% of families and 29.40% of the population were below the poverty line, including 45.40% of those under age 18 and 25.30% of those age 65 or over.
2010 census
As of the 2010 United States Census, there were 9,429 people, 3,341 households, and 2,183 families living in the county.[17] The population density was 20.0 inhabitants per square mile (7.7/km2). There were 5,360 housing units at an average density of 11.4 per square mile (4.4/km2).[18] The racial makeup of the county was 74.1% black or African American, 24.4% white, 0.5% Asian, 0.4% American Indian, 0.1% from other races, and 0.6% from two or more races. Those of Hispanic or Latino origin made up 1.5% of the population.[17] In terms of ancestry, and 25.1% were American.[19]
Of the 3,341 households, 28.1% had children under the age of 18 living with them, 36.8% were married couples living together, 23.7% had a female householder with no husband present, 34.7% were non-families, and 31.3% of households were made up of individuals. The average household size was 2.38 and the average family size was 2.98. The median age was 43.0 years.[17]
The median income for a household in the county was $22,283 and the median family income was $27,168. Males had a median income of $26,837 versus $21,223 for females. The per capita income for the county was $10,925. About 26.7% of families and 26.8% of the population were below the poverty line, including 37.3% of those under age 18 and 21.7% of those age 65 or over.[20]
Politics
Hancock County has arguably been the most consistent Democratic county in the entire nation since the Civil War. It has voted for the Democratic presidential nominee in every election since 1852 except that of 1972, when George McGovern lost every county in Georgia – and even then it was easily McGovern's best county in the state and he lost by only 93 votes. Apart from Richard Nixon in that election, Barry Goldwater is the only Republican since at least 1912 to reach 30 percent of the county's vote,[21] and Goldwater did so when the enfranchisement of the county's African-American majority was highly incomplete and the white minority's traditional Democratic loyalties were being broken. In 1980 it was Georgia "favorite son" Jimmy Carter's second best county in the nation,[22] whilst in 1984 Walter Mondale, who went within 3,819 votes of losing all fifty states, won over 76.6 percent of Hancock County ballots to make it his fourth-best county outside the District of Columbia.[23]
| Year | Republican | Democratic | Third parties |
|---|---|---|---|
| 2016 | 23.6% 843 | 75.5% 2,701 | 1.0% 36 |
| 2012 | 18.8% 769 | 80.9% 3,308 | 0.3% 13 |
| 2008 | 18.3% 795 | 81.3% 3,535 | 0.4% 18 |
| 2004 | 23.1% 822 | 76.4% 2,715 | 0.5% 18 |
| 2000 | 21.5% 662 | 78.2% 2,414 | 0.3% 10 |
| 1996 | 16.6% 438 | 80.7% 2,135 | 2.8% 73 |
| 1992 | 16.0% 506 | 78.0% 2,461 | 6.0% 190 |
| 1988 | 24.0% 621 | 75.2% 1,947 | 0.8% 21 |
| 1984 | 23.4% 644 | 76.6% 2,109 | |
| 1980 | 20.4% 573 | 78.5% 2,205 | 1.1% 31 |
| 1976 | 23.5% 651 | 76.5% 2,117 | |
| 1972 | 51.5% 1,595 | 48.5% 1,502 | |
| 1968 | 10.4% 381 | 59.3% 2,165 | 30.3% 1,104 |
| 1964 | 46.3% 925 | 53.7% 1,074 | |
| 1960 | 26.8% 286 | 73.2% 780 | |
| 1956 | 29.2% 354 | 70.8% 860 | |
| 1952 | 17.7% 267 | 82.3% 1,245 | |
| 1948 | 28.4% 219 | 57.1% 441 | 14.5% 112 |
| 1944 | 22.3% 109 | 77.7% 380 | |
| 1940 | 23.4% 153 | 76.5% 501 | 0.2% 1 |
| 1936 | 10.0% 57 | 88.4% 504 | 1.6% 9 |
| 1932 | 3.3% 18 | 96.0% 529 | 0.7% 4 |
| 1928 | 17.6% 118 | 82.4% 552 | |
| 1924 | 7.1% 22 | 88.3% 272 | 4.6% 14 |
| 1920 | 9.6% 53 | 90.4% 498 | |
| 1916 | 3.6% 22 | 91.5% 562 | 4.9% 30 |
| 1912 | 6.5% 39 | 91.4% 549 | 2.2% 13 |
Notable people
- James Abercrombie, (1795–1861), born in Hancock County, later member of the United States House of Representatives from Alabama.
- Charles Lincoln Harper, (1877-1855), born in Hancock County.
- William Henry Harrison, also known as Bill Thomas before emancipation, member of the Georgia House of Representatives state legislator elected during Reconstruction, formerly enslaved of Judge James Thomas.
- Horace Grant, twin brother of Harvey Grant and a former NBA basketball player who won four championships with the Chicago Bulls and Los Angeles Lakers. Grant was a graduate of Hancock Central High School.
- Harvey Grant, twin brother of Horace Grant and a former NBA basketball player with the Washington Bullets, Portland Trail Blazers, and Philadelphia 76ers. Grant was a graduate of Hancock Central High School.
- Biddy Mason, (August 15, 1818 – January 16, 1891), a slave, she won her freedom when she challenged the constitutionality of her slave status in California, a free state. She went on to become a landowner, humanitarian and philanthropist. A founding member of the First African Methodist Episcopal Church, 1872, Los Angeles, California.[25]
- Hiram George Runnels, (December 15, 1796 – December 17, 1857) born in Hancock County, Ga., later Governor of Mississippi.
- William Terrell, (1778 – July 4, 1855), member of Georgia House of Representatives, his house still stands in Sparta today.[26]
See also
References
- "State & County QuickFacts". United States Census Bureau. Archived from the original on June 7, 2011. Retrieved June 23, 2014.
- "Find a County". National Association of Counties. Retrieved June 7, 2011.
- "Hancock County". Georgia.gov. Archived from the original on August 27, 2008. Retrieved March 20, 2018.
- Gannett, Henry (1905). The Origin of Certain Place Names in the United States. Govt. Print. Off. pp. 148.
- "Census of 1850" (PDF). U.S. Census Bureau. Retrieved August 1, 2016.
- Joslyn, Mauriel (2003). "Hancock County". New Georgia Encyclopedia. Georgia Humanities Council.
- "Annual Estimates of the Resident Population for Incorporated Places: April 1, 2010 to July 1, 2015". Archived from the original on June 2, 2016. Retrieved July 2, 2016.
- "Critics See Efforts by Counties and Towns to Purge Minority Voters From Rolls". The New York Times. July 31, 2016. Retrieved August 1, 2016.
- "US Gazetteer files: 2010, 2000, and 1990". United States Census Bureau. February 12, 2011. Retrieved April 23, 2011.
- "Georgia Soil and Water Conservation Commission Interactive Mapping Experience". Georgia Soil and Water Conservation Commission. Retrieved November 20, 2015.
- "Population and Housing Unit Estimates". Retrieved July 31, 2019.
- "U.S. Decennial Census". United States Census Bureau. Retrieved June 23, 2014.
- "Historical Census Browser". University of Virginia Library. Retrieved June 23, 2014.
- "Population of Counties by Decennial Census: 1900 to 1990". United States Census Bureau. Retrieved June 23, 2014.
- "Census 2000 PHC-T-4. Ranking Tables for Counties: 1990 and 2000" (PDF). United States Census Bureau. Retrieved June 23, 2014.
- "U.S. Census website". United States Census Bureau. Retrieved May 14, 2011.
- "DP-1 Profile of General Population and Housing Characteristics: 2010 Demographic Profile Data". United States Census Bureau. Archived from the original on February 13, 2020. Retrieved December 29, 2015.
- "Population, Housing Units, Area, and Density: 2010 - County". United States Census Bureau. Archived from the original on February 13, 2020. Retrieved December 29, 2015.
- "DP02 SELECTED SOCIAL CHARACTERISTICS IN THE UNITED STATES – 2006-2010 American Community Survey 5-Year Estimates". United States Census Bureau. Archived from the original on February 13, 2020. Retrieved December 29, 2015.
- "DP03 SELECTED ECONOMIC CHARACTERISTICS – 2006-2010 American Community Survey 5-Year Estimates". United States Census Bureau. Archived from the original on February 13, 2020. Retrieved December 29, 2015.
- Scammon, Richard M. (compiler); America at the Polls: A Handbook of Presidential Election statistics 1920-1964, pp. 97, 100, 103, 106, 109 ISBN 0405077114
- Dave Leip's U.S. Election Atlas; 1980 Presidential Election Statistics
- Dave Leip's U.S. Election Atlas; 1984 Presidential Election Statistics
- Leip, David. "Dave Leip's Atlas of U.S. Presidential Elections". uselectionatlas.org. Retrieved March 20, 2018.
- Beneath Los Angeles. Biddy Mason Archived September 23, 2015, at the Wayback Machine Verified 2011-02-03.
- "New Georgia Encyclopedia entry for William Terrell". Retrieved December 25, 2006.
External links
- New Georgia Encyclopedia. Hancock County
- Hancock County historical marker
- Powelton Baptist Church historical marker
| Wikimedia Commons has media related to Hancock County, Georgia. |
Places adjacent to Hancock County, Georgia | ||||||||||
|---|---|---|---|---|---|---|---|---|---|---|
| ||||||||||
Municipalities and communities of Hancock County, Georgia, United States | ||
|---|---|---|
| City | Map of Georgia highlighting Hancock County | |
| Unincorporated communities | ||