Muscogee County, Georgia
Muscogee County is a county located on the central western border of the U.S. state of Georgia; its western border with the state of Alabama is formed by the Chattahoochee River. As of the 2010 census, the population was 189,885.[1] Its county seat and only city is Columbus,[2] with which it has been a consolidated city-county since the beginning of 1971.
Muscogee County | |
|---|---|
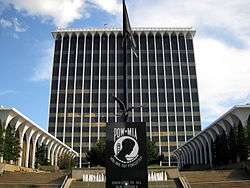 Columbus Consolidated Government Center | |
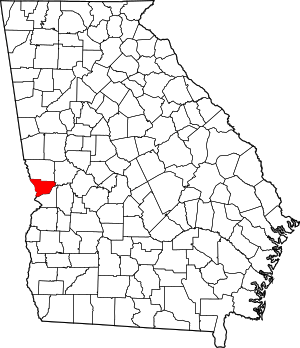 Location within the U.S. state of Georgia | |
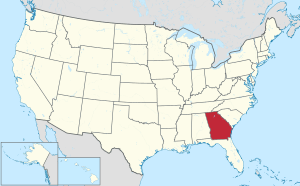 Georgia's location within the U.S. | |
| Coordinates: 32°31′N 84°52′W | |
| Country | |
| State | |
| Founded | June 9, 1826 |
| Named for | Muscogee people |
| Seat | Columbus |
| Largest city | Columbus |
| Area | |
| • Total | 221 sq mi (570 km2) |
| • Land | 216 sq mi (560 km2) |
| • Water | 4.6 sq mi (12 km2) 2.1%% |
| Population | |
| • Estimate (2019) | 195,769 |
| • Density | 878/sq mi (339/km2) |
| Time zone | UTC−5 (Eastern) |
| • Summer (DST) | UTC−4 (EDT) |
| Congressional districts | 2nd, 3rd |
| Website | www |
Muscogee County is part of Columbus, GA-AL Metropolitan Statistical Area.
The only other city in the county was Bibb City, a company town that disincorporated in December 2000, two years after its mill closed permanently. Fort Benning, a large Army installation, takes up nearly one quarter of the county and extends into Chattahoochee County; it generates considerable economic power in the region.
History
Inhabited for thousands of years by varying cultures of indigenous peoples, this area was territory of the historic Creek people at the time of European encounter.
The land for Lee, Muscogee, Troup, Coweta, and Carroll counties was ceded by a certain eight chiefs among the Creek people in the 1825 Treaty of Indian Springs. The Creek Nation declared the land cession illegal, because it did not represent the will of the majority of the people. The United States Senate did not ratify it. The following year, the US government negotiated another treaty with the Creek, by which they ceded nearly as much territory under continued pressure from the state of Georgia and US land commissioners.
The counties' boundaries were created by the Georgia General Assembly on June 9, but they were not named until December 14 of 1826. The county was originally developed by European Americans for cotton plantations, with labor accomplished by enslaved African Americans. A total of one million African Americans were brought into the Deep South through the domestic slave trade from the Upper South, breaking up countless families and creating a massive demographic shift. In many areas of what became known as the Black Belt for the fertility of soil and development of plantations, African Americans made up the majority of population in many counties.
This county was named by European Americans for the native Muscogee or Creek people. Parts of the then-large county (which extended east to the Flint River) were later taken to create every other neighboring Georgia county, including Harris County to the north in 1827.[3]
Geography
According to the U.S. Census Bureau, the county has a total area of 221 square miles (570 km2), of which 216 square miles (560 km2) is land and 4.6 square miles (12 km2) (2.1%) is water.[4]
The county is located on the fall line between the Atlantic coastal plain to the south and the Piedmont to the north. As such, the newly constructed Fall Line Freeway runs across the northern portion of the county along JR Allen Parkway, and areas across the northern part of the county are hillier compared to the southern part of the county.
The majority of Muscogee County, from north of Columbus running northeast in the direction of Ellerslie, is located in the Middle Chattahoochee River-Walter F. George Lake subbasin of the ACF River Basin (Apalachicola-Chattahoochee-Flint River Basin). The northwestern corner of the county, south of Fortson, is located in the Middle Chattahoochee River-Lake Harding subbasin of the same ACF River Basin.[5]
Major highways
.svg.png)


Adjacent counties
- Harris County (north)
- Talbot County (northeast)
- Chattahoochee County (south)
- Russell County, Alabama (southwest/CST Border except for Phenix City as the city is jointed by the Columbus Metropolitan Area)
- Lee County, Alabama (west/CST Border)
Demographics
| Historical population | |||
|---|---|---|---|
| Census | Pop. | %± | |
| 1830 | 3,508 | — | |
| 1840 | 11,699 | 233.5% | |
| 1850 | 18,578 | 58.8% | |
| 1860 | 16,584 | −10.7% | |
| 1870 | 16,663 | 0.5% | |
| 1880 | 19,322 | 16.0% | |
| 1890 | 27,761 | 43.7% | |
| 1900 | 29,836 | 7.5% | |
| 1910 | 36,227 | 21.4% | |
| 1920 | 44,195 | 22.0% | |
| 1930 | 57,558 | 30.2% | |
| 1940 | 75,494 | 31.2% | |
| 1950 | 118,028 | 56.3% | |
| 1960 | 158,623 | 34.4% | |
| 1970 | 167,377 | 5.5% | |
| 1980 | 170,108 | 1.6% | |
| 1990 | 179,278 | 5.4% | |
| 2000 | 186,291 | 3.9% | |
| 2010 | 189,885 | 1.9% | |
| Est. 2019 | 195,769 | [6] | 3.1% |
| U.S. Decennial Census[7] 1790-1960[8] 1900-1990[9] 1990-2000[10] 2010-2019[1] | |||
2000 census
As of the census[11] of 2000, there were 186,291 people, 69,819 households, and 47,686 families living in the county. The population density was 861 people per square mile (333/km2). There were 76,182 housing units at an average density of 352 per square mile (136/km2). The racial makeup of the county was 50.42% White, 43.74% Black or African American, 0.38% Native American, 1.54% Asian, 0.14% Pacific Islander, 1.90% from other races, and 1.87% from two or more races. 4.49% of the population were Hispanic or Latino of any race.
There were 69,819 households, out of which 34.60% had children under the age of 18 living with them, 44.70% were married couples living together, 19.60% had a female householder with no husband present, and 31.70% were non-families. 26.70% of all households were made up of individuals, and 9.40% had someone living alone who was 65 years of age or older. The average household size was 2.54 and the average family size was 3.08.
In the county, the population was spread out, with 26.80% under the age of 18, 11.90% from 18 to 24, 29.80% from 25 to 44, 19.70% from 45 to 64, and 11.70% who were 65 years of age or older. The median age was 33 years. For every 100 females, there were 94.70 males. For every 100 females age 18 and over, there were 91.60 males.
The median income for a household in the county was $34,798, and the median income for a family was $41,244. Males had a median income of $30,238 versus $24,336 for females. The per capita income for the county was $18,262. 15.70% of the population and 12.80% of families were below the poverty line. Out of the total population, 22.00% of those under the age of 18 and 12.10% of those 65 and older were living below the poverty line.
2010 census
As of the 2010 United States Census, there were 189,885 people, 74,081 households, and 47,742 families living in the county.[12] The population density was 877.5 inhabitants per square mile (338.8/km2). There were 82,690 housing units at an average density of 382.1 per square mile (147.5/km2).[13] The racial makeup of the county was 46.3% white, 45.5% black or African American, 2.2% Asian, 0.4% American Indian, 0.2% Pacific islander, 2.4% from other races, and 3.0% from two or more races. Those of Hispanic or Latino origin made up 6.4% of the population.[12] In terms of ancestry, 8.7% were Irish, 8.4% were German, 6.7% were English, and 6.3% were American.[14]
Of the 74,081 households, 35.0% had children under the age of 18 living with them, 38.3% were married couples living together, 21.3% had a female householder with no husband present, 35.6% were non-families, and 29.9% of all households were made up of individuals. The average household size was 2.47 and the average family size was 3.08. The median age was 33.5 years.[12]
The median income for a household in the county was $41,331 and the median income for a family was $50,771. Males had a median income of $37,618 versus $31,430 for females. The per capita income for the county was $22,514. About 14.8% of families and 18.2% of the population were below the poverty line, including 26.3% of those under age 18 and 13.0% of those age 65 or over.[15]
Education
Higher education
Public
Private
Primary and secondary education
Public schools
Columbus is home to 65 public schools,[22] all operated by the Muscogee County School District.
Private and religion-based schools
- Brookstone School (K-12)
- Calvary Christian School (Christian, K-12)
- Edgewood Christian School (Baptist, K-12)
- Grace Christian School (Christian, K-12)
- Hallie Turner Private School (9-12)
- Kip Christian Academy (Christian, K-8)
- New Bethel Christian Academy (Seventh-day Adventist, K-8)
- Our Lady of Lourdes School (Catholic, K-8)
- Our Redeemer Christian Academy (Christian, K-12)
- Pinehurst Christian School (Baptist, K-8)
- St. Anne‒Pacelli Catholic School (Catholic, K-12)
- St. Luke School (Christian, K-8)
- Victory Academy (K-8)
- Westminster Christian School (Christian, K-8)
- Wynnbrook Christian School (Baptist, K-12)
Homeschooling
In regards to homeschooling, the Official Code of Georgia Annotated states the following:
Required Subjects: A basic academic educational program that includes, but is not limited to, reading, language arts, math, social studies, and science. [Ga. Code Ann. § 20-2-690(c)(4).]
Government and politics
Muscogee County has voted for Democratic candidates by increasing margins since 1992, although partisan leanings have become increasingly stratified by race, class, and in-county migration after 1965. The county has not supported a Republican for president since 1988, but broke free of Solid South voting patterns earlier than most counties in Georgia.
Presidential
| Year | Republican | Democratic | Third parties |
|---|---|---|---|
| 2016 | 38.8% 26,976 | 57.3% 39,851 | 3.9% 2,698 |
| 2012 | 38.9% 27,510 | 60.2% 42,573 | 0.9% 632 |
| 2008 | 39.9% 29,568 | 59.5% 44,158 | 0.6% 436 |
| 2004 | 48.2% 30,850 | 51.3% 32,867 | 0.5% 335 |
| 2000 | 45.0% 23,479 | 54.1% 28,193 | 0.9% 491 |
| 1996 | 41.9% 19,360 | 53.8% 24,867 | 4.4% 2021 |
| 1992 | 41.7% 21,386 | 49.7% 25,476 | 8.6% 4418 |
| 1988 | 54.9% 23,058 | 44.7% 18,772 | 0.4% 170 |
| 1984 | 53.3% 23,816 | 46.7% 20,835 | |
| 1980 | 38.4% 15,203 | 58.8% 23,272 | 2.8% 1091 |
| 1976 | 35.9% 13,496 | 64.1% 24,092 | |
| 1972 | 77.6% 28,449 | 22.5% 8,234 | |
| 1968 | 32.4% 11,193 | 22.0% 7593 | 45.7% 15,804 |
| 1964 | 62.8% 21,025 | 37.2% 12,446 | 0.0% 3 |
| 1960 | 52.8% 9,578 | 47.2% 8,553 | |
| 1956 | 50.0% 8,176 | 50.0% 8,160 | |
| 1952 | 41.1% 7,814 | 59.0% 11,220 | |
| 1948 | 17.7% 1,802 | 58.0% 5,920 | 24.3% 2481 |
| 1944 | 17.1% 1,344 | 82.9% 6,498 | |
| 1940 | 11.5% 702 | 88.4% 5,392 | 0.1% 7 |
| 1936 | 8.3% 455 | 91.6% 5,009 | 0.1% 7 |
| 1932 | 6.3% 230 | 93.1% 3,413 | 0.7% 24 |
| 1928 | 42.9% 1,574 | 57.1% 2,098 | |
| 1924 | 9.0% 218 | 85.6% 2,067 | 5.4% 130 |
| 1920 | 6.9% 101 | 93.1% 1,372 | |
| 1916 | 2.2% 44 | 92.3% 1,833 | 5.5% 110 |
| 1912 | 5.2% 102 | 92.2% 1,817 | 2.6% 51 |
United States Congress
| Senators | Name | Party | Assumed Office | Level | |
|---|---|---|---|---|---|
| Senate Class 2 | David Perdue | Republican | 2015 | Junior Senator | |
| Senate Class 3 | Johnny Isakson | Republican | 2005 | Senior Senator | |
| Representatives | Name | Party | Assumed Office | ||
| District 2 | Sanford Bishop | Democratic | 1993 | ||
| District 9 | Drew Ferguson | Republican | 2015 | ||
Georgia General Assembly
Georgia State Senate
| District | Name | Party | Assumed Office | |
|---|---|---|---|---|
| 15 | Ed Harbison | Democratic | 2013 | |
| 29 | Joshua McKoon | Republican | 2011 | |
Georgia House of Representatives
| District | Name | Party | Assumed Office | |
|---|---|---|---|---|
| 133 | John Pezold | Republican | 2013 | |
| 134 | Richard H. Smith | Republican | 2005 | |
| 135 | Calvin Smyre | Democratic | 1975 | |
| 136 | Carolyn Hugley | Democratic | 1993 | |
| 137 | Debbie Buckner | Democratic | 2003 | |
References
- "State & County QuickFacts". United States Census Bureau. Archived from the original on July 3, 2011. Retrieved June 24, 2014.
- "Find a County". National Association of Counties. Retrieved June 7, 2011.
- "Muscogee County History" Archived 2005-04-02 at the Wayback Machine, University of Georgia
- "US Gazetteer files: 2010, 2000, and 1990". United States Census Bureau. February 12, 2011. Retrieved April 23, 2011.
- "Georgia Soil and Water Conservation Commission Interactive Mapping Experience". Georgia Soil and Water Conservation Commission. Retrieved November 22, 2015.
- "Population and Housing Unit Estimates". Retrieved May 21, 2020.
- "U.S. Decennial Census". United States Census Bureau. Retrieved June 24, 2014.
- "Historical Census Browser". University of Virginia Library. Retrieved June 24, 2014.
- "Population of Counties by Decennial Census: 1900 to 1990". United States Census Bureau. Retrieved June 24, 2014.
- "Census 2000 PHC-T-4. Ranking Tables for Counties: 1990 and 2000" (PDF). United States Census Bureau. Retrieved June 24, 2014.
- "U.S. Census website". United States Census Bureau. Retrieved May 14, 2011.
- "DP-1 Profile of General Population and Housing Characteristics: 2010 Demographic Profile Data". United States Census Bureau. Archived from the original on February 13, 2020. Retrieved December 30, 2015.
- "Population, Housing Units, Area, and Density: 2010 - County". United States Census Bureau. Archived from the original on February 13, 2020. Retrieved December 30, 2015.
- "DP02 SELECTED SOCIAL CHARACTERISTICS IN THE UNITED STATES – 2006-2010 American Community Survey 5-Year Estimates". United States Census Bureau. Archived from the original on February 13, 2020. Retrieved December 30, 2015.
- "DP03 SELECTED ECONOMIC CHARACTERISTICS – 2006-2010 American Community Survey 5-Year Estimates". United States Census Bureau. Archived from the original on February 13, 2020. Retrieved December 30, 2015.
- www.thirdwavedigital.com, Third Wave Digital -. "Home - Columbus Technical College". www.columbustech.edu. Retrieved August 9, 2018.
- Troy University at Columbus Archived 2010-01-31 at the Wayback Machine
- Beacon University Archived 2009-06-13 at the Wayback Machine
- "Rivertown School of Beauty". www.rivertownschoolofbeauty.com. Retrieved August 9, 2018.
- "Southeastern Beauty School". Archived from the original on June 1, 2013. Retrieved September 21, 2009.
- "Archived copy". Archived from the original on August 5, 2012. Retrieved September 21, 2009.CS1 maint: archived copy as title (link)
- List of schools in Columbus Archived 2010-01-24 at the Wayback Machine, Retrieved Sept. 2009
- Leip, David. "Dave Leip's Atlas of U.S. Presidential Elections". uselectionatlas.org. Retrieved March 22, 2018.
- "House Members List". Retrieved June 2, 2016.
- "Senate Members List". Retrieved June 2, 2016.
- "Georgia Counties by 2012 Legislative and Congressional District" (PDF). Retrieved June 2, 2016.
External links
Places adjacent to Muscogee County, Georgia | ||||||||||
|---|---|---|---|---|---|---|---|---|---|---|
| ||||||||||
Municipalities and communities of Muscogee County, Georgia, United States | ||
|---|---|---|
| Cities | Map of Georgia highlighting Muscogee County | |
| Neighborhoods |
| |
| Military base | ||
| Footnotes | ‡ This symbol represents that the indicated city is part of two or more counties. | |
Greater Columbus, Georgia | ||
|---|---|---|
| Central cities/Largest cities | 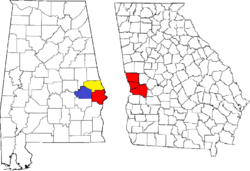 Location of the Columbus, Georgia-Auburn, Alabama CSA and its counties:
Columbus, Georgia Metropolitan Statistical Area
Auburn, Alabama Metropolitan Statistical Area
Tuskegee, Alabama Micropolitan Statistical Area (defunct) | |
| Cities in Georgia | ||
| Cities in Alabama | ||
| Counties in Georgia | ||
| Counties in Alabama | ||
| Authority control |
|
|---|