Floyd County, Georgia
Floyd County is a county located in the northwestern part of the U.S. state of Georgia. As of the 2010 United States Census, the population was 96,317.[1] The county seat is Rome.[2]
Floyd County | |
|---|---|
 | |
 Location within the U.S. state of Georgia | |
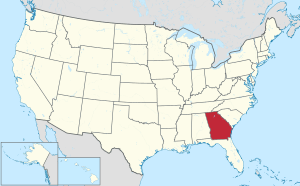 Georgia's location within the U.S. | |
| Coordinates: 34°16′N 85°13′W | |
| Country | |
| State | |
| Founded | December 3, 1832 |
| Named for | John Floyd |
| Seat | Rome |
| Largest city | Rome |
| Area | |
| • Total | 518 sq mi (1,340 km2) |
| • Land | 510 sq mi (1,300 km2) |
| • Water | 8.6 sq mi (22 km2) 1.7%% |
| Population | |
| • Estimate (2019) | 98,498 |
| • Density | 189/sq mi (73/km2) |
| Time zone | UTC−5 (Eastern) |
| • Summer (DST) | UTC−4 (EDT) |
| Congressional district | 14th |
| Website | www |
Floyd County comprises the Rome, GA metropolitan statistical area.
History
The county was established on December 3, 1832, by an act of the Georgia General Assembly, and was created from land that was part of Cherokee County at the time.[3] The county is named after United States Congressman John Floyd.[4][5]
Geography
According to the U.S. Census Bureau, the county has a total area of 518 square miles (1,340 km2), of which 510 sq mi (1,300 km2) are land and 8.6 sq mi (22 km2) (1.7%) are covered by water.[6]
The northern third of Floyd County is located in the Oostanaula River sub-basin of the ACT River Basin (Coosa-Tallapoosa River Basin). The eastern third of the county is located in the Etowah River sub-basin of the larger ACT River Basin, while the western third of Floyd County is located in the Upper Coosa River sub-basin of the same ACT River Basin.[7]
Lakes and reservoirs
_2.jpg)
Adjacent counties
- Walker County – north
- Gordon County – northeast
- Bartow County – east
- Polk County – south
- Cherokee County, Alabama – west (CST)
- Chattooga County – northwest
National protected area
- Chattahoochee National Forest (part)
Transportation
Major highways


Pedestrians and cycling
- Heritage Trail System
- Kingfisher Trail
- Silver Creek Trail
- Simms Mountain Trail
- Snow Loop
- The Goat
- Thornwood Trail
- Viking Trail
Demographics
| Historical population | |||
|---|---|---|---|
| Census | Pop. | %± | |
| 1840 | 4,441 | — | |
| 1850 | 8,205 | 84.8% | |
| 1860 | 15,195 | 85.2% | |
| 1870 | 17,230 | 13.4% | |
| 1880 | 24,418 | 41.7% | |
| 1890 | 28,391 | 16.3% | |
| 1900 | 33,113 | 16.6% | |
| 1910 | 36,736 | 10.9% | |
| 1920 | 39,841 | 8.5% | |
| 1930 | 48,667 | 22.2% | |
| 1940 | 56,141 | 15.4% | |
| 1950 | 62,899 | 12.0% | |
| 1960 | 69,130 | 9.9% | |
| 1970 | 73,742 | 6.7% | |
| 1980 | 79,800 | 8.2% | |
| 1990 | 81,251 | 1.8% | |
| 2000 | 90,565 | 11.5% | |
| 2010 | 96,317 | 6.4% | |
| Est. 2019 | 98,498 | [8] | 2.3% |
| U.S. Decennial Census[9] 1790-1960[10] 1900-1990[11] 1990-2000[12] 2010-2019[1] | |||
2000 census
As of the 2000 United States Census, 90,565 people, 34,028 households, and 24,227 were families living in the county. The population density was 176 people per square mile (68/km²). The 36,615 housing units averaged 71 per square mile (28/km²). The racial makeup of the county was 81.34% White, 13.31% African American, 0.31% Native American, 0.93% Asian, 0.09% Pacific Islander, 2.88% from other races, and 1.14% from two or more races. About 5.50% of the population was Hispanic or Latino of any race.
Of the 34,028 households, 32.10% had children under the age of 18 living with them, 53.60% were married couples living together, 13.00% had a female householder with no husband present, and 28.80% were non-families. 24.50% of all households were made up of individuals and 10.80% had someone living alone who was 65 years of age or older. The average household size was 2.55, and the average family size was 3.02.
In the county, the population was distributed as 24.60% under the age of 18, 10.80% from 18 to 24, 28.50% from 25 to 44, 22.20% from 45 to 64, and 13.90% who were 65 years of age or older. The median age was 36 years. For every 100 females, there were 93.80 males. For every 100 females age 18 and over, there were 90.30 males.
The median income for a household in the county was $35,615, and for a family was $42,302. Males had a median income of $31,659 versus $23,244 for females. The per capita income for the county was $17,808. About 10.80% of families and 14.40% of the population were below the poverty line, including 19.40% of those under age 18 and 13.80% of those age 65 or over.
2010 census
As of the 2010 United States Census, 96,317 people, 35,930 households, and 24,916 families were living in the county.[13] The population density was 188.9 inhabitants per square mile (72.9/km2). The 40,551 housing units had an average density of 79.5 per square mile (30.7/km2).[14] The racial makeup of the county was 76.9% White, 14.2% African American, 1.3% Asian, 0.4% American Indian, 0.1% Pacific Islander, 5.3% from other races, and 1.9% from two or more races. Those of Hispanic or Latino origin made up 9.3% of the population.[13] In terms of ancestry, 16.2% were English, 13.3% were American, 12.4% were Irish, and 6.8% were German.[15]
Of the 35,930 households, 34.4% had children under the age of 18 living with them, 49.4% were married couples living together, 14.8% had a female householder with no husband present, 30.7% were not families; 26.0% of all households were made up of individuals. The average household size was 2.58, and the average family size was 3.09. The median age was 37.6 years.[13]
The median income for a household in the county was $41,066, and for a family was $49,310. Males had a median income of $40,269 versus $29,587 for females. The per capita income for the county was $20,640. About 13.3% of families and 18.7% of the population were below the poverty line, including 26.5% of those under age 18 and 11.0% of those age 65 or over.[16]
Government
The county government is housed in the Floyd County Administration Building in Rome, Georgia, the county seat. This was the former US Post Office and Courthouse.
The county has a council-manager form of government, with five county council members elected at-large. Two members are elected as representatives of the city of Rome and must reside there; the other three are elected from the county as residents outside the city limits. The at-large voting tends to reward candidates who can muster majority votes from across the whole county, which requires more money and organization for campaigns. The council hires a professional county manager to manage daily operations.
| Year | Republican | Democratic | Third parties |
|---|---|---|---|
| 2016 | 69.2% 24,114 | 26.3% 9,159 | 4.6% 1,587 |
| 2012 | 69.0% 22,733 | 29.3% 9,640 | 1.7% 554 |
| 2008 | 67.4% 23,132 | 31.2% 10,691 | 1.5% 499 |
| 2004 | 67.6% 21,400 | 31.7% 10,038 | 0.8% 238 |
| 2000 | 60.4% 16,194 | 38.3% 10,282 | 1.3% 349 |
| 1996 | 49.0% 12,426 | 41.2% 10,464 | 9.8% 2,488 |
| 1992 | 44.4% 12,378 | 41.7% 11,614 | 13.9% 3,868 |
| 1988 | 62.9% 14,697 | 36.6% 8,548 | 0.6% 141 |
| 1984 | 63.5% 15,437 | 36.5% 8,873 | |
| 1980 | 39.1% 9,220 | 58.1% 13,710 | 2.8% 666 |
| 1976 | 33.7% 7,713 | 66.3% 15,151 | |
| 1972 | 82.1% 15,485 | 17.9% 3,372 | |
| 1968 | 34.7% 7,470 | 18.8% 4041 | 46.5% 10,001 |
| 1964 | 52.9% 9,849 | 47.0% 8,750 | 0.2% 37 |
| 1960 | 45.4% 6,108 | 54.6% 7,350 | |
| 1956 | 47.3% 5,955 | 52.7% 6,633 | |
| 1952 | 34.8% 4,532 | 65.2% 8,477 | |
| 1948 | 8.6% 653 | 68.9% 5,247 | 22.5% 1711 |
| 1944 | 19.1% 1,123 | 80.9% 4,764 | |
| 1940 | 14.1% 912 | 85.6% 5,528 | 0.3% 21 |
| 1936 | 10.0% 612 | 89.9% 5,499 | 0.1% 8 |
| 1932 | 6.4% 300 | 92.9% 4,342 | 0.6% 30 |
| 1928 | 53.7% 1,730 | 46.3% 1,494 | |
| 1924 | 18.1% 470 | 73.8% 1,922 | 8.1% 212 |
| 1920 | 25.8% 667 | 74.3% 1,923 | |
| 1916 | 15.0% 386 | 83.1% 2,137 | 1.9% 50 |
| 1912 | 16.4% 374 | 80.8% 1,838 | 2.8% 63 |
Education
Floyd County schools
High schools
- Armuchee High School
- Coosa High School
- Model High School
- Pepperell High School
Middle schools
- Armuchee Middle School
- Coosa Middle School
- Model Middle School
- Pepperell Middle School
Elementary schools
- Armuchee Elementary School
- Alto Park Elementary School
- Garden Lakes Elementary School
- Cave Spring Elementary School
- Johnson Elementary School
- Model Elementary School
- Pepperell Elementary School
Primary schools
- Glenwood Primary
- McHenry Primary
- Pepperell Primary
System programs
- Floyd County College and Career Academy
Rome City schools
High schools
Middle schools
- Rome Middle School
Elementary schools
- Anna K. Davie Elementary School
- East Central Elementary School
- Elm Street Elementary School
- North Heights Elementary School
- West Central Elementary School
- West End Elementary School
Private schools
- Darlington School
- Unity Christian School
- St. Mary's Catholic School
- Berry College Elementary & Middle School
- Montessori School of Rome
State facility
- Bob Richards Youth Detention Center
Communities
Cities
Other unincorporated communities
- Armuchee
- Coosa
- Floyd Springs
- Livingston
- Mount Berry
- Rosedale
- Silver Creek
References
- "State & County QuickFacts". United States Census Bureau. Archived from the original on July 3, 2011. Retrieved June 22, 2014.
- "Find a County". National Association of Counties. Archived from the original on May 31, 2011. Retrieved June 7, 2011.
- Historical Atlas of Georgia Counties accessed June 10, 2012
- Gannett, Henry (1905). The Origin of Certain Place Names in the United States. Govt. Print. Off. pp. 127.
- Krakow, Kenneth K. (1975). Georgia Place-Names: Their History and Origins (PDF). Macon, GA: Winship Press. p. 79. ISBN 0-915430-00-2.
- "US Gazetteer files: 2010, 2000, and 1990". United States Census Bureau. February 12, 2011. Retrieved April 23, 2011.
- "Georgia Soil and Water Conservation Commission Interactive Mapping Experience". Georgia Soil and Water Conservation Commission. Retrieved November 19, 2015.
- "Population and Housing Unit Estimates". Retrieved May 21, 2020.
- "U.S. Decennial Census". United States Census Bureau. Retrieved June 22, 2014.
- "Historical Census Browser". University of Virginia Library. Retrieved June 22, 2014.
- "Population of Counties by Decennial Census: 1900 to 1990". United States Census Bureau. Retrieved June 22, 2014.
- "Census 2000 PHC-T-4. Ranking Tables for Counties: 1990 and 2000" (PDF). United States Census Bureau. Retrieved June 22, 2014.
- "DP-1 Profile of General Population and Housing Characteristics: 2010 Demographic Profile Data". United States Census Bureau. Archived from the original on February 13, 2020. Retrieved December 29, 2015.
- "Population, Housing Units, Area, and Density: 2010 - County". United States Census Bureau. Archived from the original on February 13, 2020. Retrieved December 29, 2015.
- "DP02 SELECTED SOCIAL CHARACTERISTICS IN THE UNITED STATES – 2006-2010 American Community Survey 5-Year Estimates". United States Census Bureau. Archived from the original on February 13, 2020. Retrieved December 29, 2015.
- "DP03 SELECTED ECONOMIC CHARACTERISTICS – 2006-2010 American Community Survey 5-Year Estimates". United States Census Bureau. Archived from the original on February 13, 2020. Retrieved December 29, 2015.
- Leip, David. "Dave Leip's Atlas of U.S. Presidential Elections". uselectionatlas.org. Retrieved March 19, 2018.
External links
- Floyd County Government Online
- Floyd County historical marker
Places adjacent to Floyd County, Georgia | ||||||||||
|---|---|---|---|---|---|---|---|---|---|---|
| ||||||||||
Municipalities and communities of Floyd County, Georgia, United States | ||
|---|---|---|
| Cities | Map of Georgia highlighting Floyd County | |
| CDPs | ||
| Unincorporated communities | ||
| Authority control |
|
|---|