Economy of the Netherlands
The economy of the Netherlands is the 17th largest in the world in 2019 (in terms of Gross domestic product; GDP) according to the World Bank and International Monetary Fund. Its GDP per capita was estimated at roughly $48,860 in the fiscal year 2017/18 which makes it one of highest-earning nations in the world (see list of countries by GDP (PPP) per capita). Between 1996 and 2000, annual economic growth (GDP) averaged over 4%, well above the European average of 2.5% at the time. Growth slowed considerably in 2001–05 as part of the global economic slowdown. 2006 and 2007 however showed economic growth of 3-4% per annum. The Dutch economy was hit considerably by the financial crisis of 2007–2008 and the ensuing European sovereign-debt crisis.
 | |
| Currency | Euro (EUR, €) |
|---|---|
Trade organisations | EU, WTO and OECD |
Country group | |
| Statistics | |
| Population | |
| GDP | |
| GDP rank | |
GDP growth |
|
GDP per capita | |
GDP per capita rank | |
GDP by sector |
|
Population below poverty line | |
Labour force | |
Labour force by occupation |
|
| Unemployment | |
Average gross salary | €2,855 monthly (2017) |
Average net salary | €2,152 monthly (2017) |
Main industries | agriculture-related industries, oil and natural gas, metal and engineering products, electronic machinery and equipment, chemicals, petroleum, construction, microelectronics, fishing |
| External | |
| Exports | |
Export goods | machinery and transport equipment, chemicals, mineral fuels; food and livestock, manufactured goods |
Main export partners | |
| Imports | |
Import goods | machinery and transport equipment, chemicals, fuels, foodstuffs, clothing |
Main import partners |
|
FDI stock | |
Gross external debt | |
| Public finances | |
| Revenues | 43.6% of GDP (2019)[17] |
| Expenses | 41.9% of GDP (2019)[17] |
| Economic aid | €4 bn (As of 2005) |
Foreign reserves | |
| Life in the Netherlands |
|---|
 |
|
Society
|
|
Government |
The Netherlands has had a steady natural gas resources since 1959 when a wellspring was discovered. Today the Netherlands accounts for more than 25% of all natural gas reserves in the European Union. The sale of natural gas generated a significant rise in revenue for the Netherlands for following decades.[21] However, the unforeseen consequences of the country's energy wealth originally impacted the competitiveness of other sectors of the economy, leading to the theory of Dutch disease, after the discovery of the vast Groningen gas field.[21]
The Netherlands has a prosperous and open economy, which depends heavily on foreign trade. The economy is noted for stable industrial relations, fairly low unemployment and inflation, a sizable current account surplus (compared to the size of the country even more than Germany) and an important role as a European transportation hub, with Rotterdam as by far the biggest port in Europe and Amsterdam with one of the biggest airports in Europe. Industrial activity is predominantly in food processing, chemicals, petroleum refining, hightech, financial services, creative sector and electrical machinery. A highly mechanised agricultural sector employs no more than 2% of the labour force but provides large surpluses for the food-processing industry and for exports. The Netherlands, along with 11 of its EU partners, began circulating the euro currency on 1 January 2002.
The stern financial policy has been abandoned in 2009 because of the current credit crises. The relatively large banking sector was partly nationalised and bailed out through government interventions. The unemployment rate dropped to 5.0% in the summer of 2011, but increased with a sharp rate since then to 7.3% in May 2013, 6.8% in 2015 but dropped again to 3.9% in March 2018.[22][23] The state budget deficit is about 2.2% in 2015 well below the norm of 3.0% in the EU.[24] In 2016 the state budget showed a surplus of 0.4% and this is expected to grow to a surplus of over 1.0% in 2017.[25] Historically, the Dutch introduced and invented the stock market[26] by the merchandise trading through Dutch East India Company. The Netherlands is a founding member of the European Union, the OECD and the World Trade Organization.
History
After declaring its independence from the empire of Philip II of Spain in 1581, the Netherlands experienced almost a century of explosive economic growth. A technological revolution in shipbuilding and trade knowledge and capital, due to Protestant traders of Flanders who fled to the Netherlands, helped the young Republic become the dominant trade power by the mid-17th century. In 1670 the Dutch merchant marine totalled 568,000 tons of shipping—about half the European total. The main reasons for this were the dominance of the Amsterdam Entrepot in European trade, and that of the Dutch East India Company (or Vereenigde Oost-Indische Companie – VOC) and West India Companies in intercontinental trade. Unique was that the V.O.C. was the first multinational, while its shares were traded at the Amsterdam stock exchange, one of the first in the world. Beside trade, an early "industrial revolution" (powered by wind, water and peat), land reclamation from the sea, and agricultural revolution, helped the Dutch economy achieve the highest standard of living in Europe (and presumably the world) by the middle of the 17th century. Affluence facilitated what is known as the Dutch Golden Age. This economic boom abruptly came to an end by a combination of political-military upheavals and adverse economic developments around 1670. Still the Netherlands kept a high level of prosperity, due to trade and agriculture.
Towards the 1800s, the Netherlands did not industrialize as rapidly as some other countries in Europe. One explanation for this is that the Netherlands were struggling to come to terms with having lost their dominant economical (based mainly on trade and agriculture) and political position in the world. Griffiths argues that government policies made possible a unified Dutch national economy in the 19th century. They included the abolition of internal tariffs and guilds; a unified coinage system; modern methods of tax collection; standardized weights and measures; and the building of many roads, canals, and railroads.
As in the rest of Europe, the 19th century saw the gradual transformation of the Netherlands into a modern middle-class industrial society. The number of people employed in agriculture decreased while the country made a heroic effort to revive its stake in the highly competitive industrial and trade business. The Netherlands lagged behind Belgium until the late 19th century in industrialization, then caught up by about 1920. Major industries included textiles and (later) the great Philips industrial conglomerate. Rotterdam became a major shipping and manufacturing center.[27] Poverty slowly declined and begging largely disappeared along with steadily improving working conditions for the population.
Since 1959, the Netherlands discovered large natural gas fields. The export of natural gas led to large windfall profits. However, as an unforeseen consequence, these were believed to have led to a decline in the manufacturing sector in the Netherlands.[28]
Government
While the private sector is the cornerstone of the Dutch economy, governments at different levels have a large part to play. Public spending, excluding social security transfer payments, was at 28% of GDP in 2011.[29] Total tax revenue was 38.7% of GDP in 2010,[30] which was below the EU average.[31] In addition to its own spending, the government plays a significant role through the permit requirements and regulations pertaining to almost every aspect of economic activity. The government combines a rigorous and stable microeconomic policy with wide-ranging structural and regulatory reforms. The government has gradually reduced its role in the economy since the 1980s. Privatisation and deregulation is still continuing. With regards to social and economic policy, the government cooperates with its so called social partners (trade unions and employers' organizations). The three parties come together in the Social-Economic Council (‘Sociaal Economische Raad’), the main platform for social dialogue.
Social security system
The Dutch social security is very comprehensive, covering Dutch residents in an encompassing manner and is divided into the national security (Volksverzekeringen) and the employee insurance (Werknemersverzekeringen). Whereas the first covers all living in the Netherlands and the social benefits provided, the latter provides employment-related benefits.[32] All living in the Netherlands are required to pay into the social security system, including residents from outside the Netherlands, with a few exceptions.[33]
The Volksverzekeringen is compulsory for all and covers the residents under different forms of national insurance:[34][35]
- Long term care under the Long-Term Care Act (Wet Langdurige Zorg (WLZ)) (formerly known as The Exceptional Medical Expenses Act (Algemen Wet Bijzondere Ziektekosten (AWBZ)))
- Pension care under the General Old Age Pensions Act (Algemene Ouderdomswet (AOW))
- Survivor benefits under the General Surviving Relatives Act (Algemene nabestaandenwet( ANW)) (formerly known as The General Widow's and Orphans’ Act (Algemene Weduwen-en Wezenwet (AWW)))
- Child benefits under the General Family Allowances Act (Algemene Kinderbijslagwet (AKW))
It is overseen by the Social Insurance Bank (Sociale Verzekeringsbank (SVB)) and financed through earning-related contributions of employers and employees up until a maximum income-ceiling. Whilst employed persons get their contribution deducted automatically from their wage, the unemployed pay by themselves. The AKW is financed by employers, whereas the AOW is financed by the employees. The AOW, additionally, is financed by a small government subsidy.
The Werknemersverzekeringen is compulsory for all employed people within the Netherlands. It includes the coverage of employees in the following areas:
- Unemployment benefits under the Unemployment Insurance Act (Werkloosheidswet (WW))
- Sick leave under the Sickness Benefits Act (Ziektewet (ZW))
- Disability benefits under the Disablement Insurance Act (Wet werk en inkomen naar arbeidsvermogen (WIA))
The financing for the Werknemersverkeringen is automatically deducted from the employee's income by the employer.[34][35]
Unemployment benefits
Coverage
The unemployment benefits in the Netherlands, as set out under the WW, covers almost all employees, that are employees based on a working-contract. Excluded from the WW are the following: self-employed, nationally employed, persons working less than four days a week, heads of stockholders and voluntary workers that earn up to €150 per year.[32][35]
Right to benefits
To profit from the benefit the unemployed has to submit an application to the Employee Insurance Agency (Uitvoeringsinstituut Werknemersverzekeringen (UWV)) within one week of becoming unemployed and additionally has to register as job-seeker. The WW only covers employees with a sufficient work history, meaning that an applicant has to have been working for at least 26 weeks in the past 36 weeks before becoming unemployed. If so, the working-weeks requirement is met. Moreover, the employee is only eligible to unemployment benefits if the unemployment has not been due to his own fault (e.g. own termination of the job contract).[32][35]
Benefits
The benefits received through the WW are earnings-related and amount to a sum of 75% percent of the previous earnings per day (which is based on 5 working days per week) for the duration of two months. After those two months the benefits amount to 70%. Part-time work is taken into account with a calculation of parts of the working hours. If this benefit is less than the minimum income, the unemployed has the possibility of supplementation through the Additional Allowances Act (Toeslagenwet) to sum up the amount. All jobs in the previous twelve months are counted in to the calculation of the benefits, if a change of work has taken place. To obtain the benefits for a continued time, the unemployed needs to be actively looking for work. Moreover, one needs to participate in e-coaching three and twelve months after the start of unemployment. After one year of unemployment one must register with an employment agency.[33][35][34]
Controversial issues
Labour market and social welfare
The Dutch labour market has relatively strict regulations for employers on firing employees, although by June 2014 the House of Representatives has agreed to loosen these regulations. Due to the costs of employees and costs of firing them, a big part of the working force (about 15% of the working force) is an independent one person company (ZZP). They are independent and get paid by delivery without higher social costs. Another big part of the workforce is hired as temporary workforce. State unemployment benefits in the form of a 70% benefit of the employee's last-earned salary for up to three years (with a maximum of roughly 2500 euros per month) are available for fired employees, provided that they have worked for a certain minimum time period, usually 26 weeks. Moreover, the self-employed individuals (zelfstandigen zonder personeel (ZZP)) are not automatically covered under the Werknemersverzekeringen, and are not obligated to enroll into unemployment, sickness or disabilities insurance. Self-employed individuals, hence, are required to enroll themselves with private insurance companies.[34][36]
Age of retirement
Every Dutch citizen gets the AOW, a state pension, from the age of 67. Married couples or those who live together receive 50% of minimum wage per person and a single person receives 70% of minimum wage. Most (about 70%) earn an extra pension from private pension funds. Employees are obliged to take part in the sector pension funds. In total the amount of pension funds are above 1400 billion in 2015 for less than 17 million people. Employees receive on average about 70% of their last salary. During the economic crisis and because of low interest rates, pensions funds have had difficulty keeping up with inflation. The Dutch pension system is regarded as one of the best in the world.[37][38]
Inequality and redistribution
With a Gini coefficient of 25.1 (2013) the income inequality is relatively low in the Netherlands. However, the inequality when measured in distributions of household wealth is high, where the top 1% owns 24% of all net wealth, and the top 10% own 60%. Moreover, rather large wealth disparities persist in the Netherlands in relation to age, where those under 35 years-of-age own 10% as much as older workers. This is a consequence from the low taxation of home ownership and a generous mortgage interest deductibility, which benefit the wealthier households.[39] Due to the generous pensions the pension-related savings are the most important part of wealth in the Netherlands, yet are not subject to capital income taxation, which increases the inequality.
Home mortgage interest deduction
The Netherlands was one of the few countries in the world where the interest paid on mortgages is almost fully deductible from income tax. Since 2013 big changes were made. The conditions allowing a borrowing of more that 116% of the value of the home ware reduced to 106% and are still continuously being reduced every year. The deduction is also capped to 50.5% and reducing every year.[40] Together with the after-effects of the financial crisis of 2007–2008 the result was a housing crisis, with a decrease of prices almost 25% percent in some areas. Recent years have shown a recovery of 10% to even 20% per year in the most popular cities.
The Service sector accounts for more than half of the national income, primarily in transportation, distribution and logistics, financial areas, software development and the creative industry. The breadth of service providers in financial services and a Protestant work ethic have contributed to the Netherlands achieving a DAW Index score of 5 in 2012. Industrial activity is dominated by the machinery, electronics/high tech industry, metalworking, oil refining, chemical, and food-processing industries. Construction amounts to about 6% of GDP. Agriculture and fishing, although visible and traditional Dutch activities, account for just 2%.
The Netherlands continues to be one of the leading European nations for attracting foreign direct investment and is one of the five largest investors in the United States. The economy experienced a slowdown in 2005, but in 2006 recovered to the fastest pace in six years on the back of increased exports and strong investment. The pace of job growth reached 10-year highs in 2007. The Netherlands is the fifth-most competitive economy in the world, according to the World Economic Forum's Global Competitiveness Report.[41]
Energy sector
Natural gas
The discovery of the large Groningen natural gas field in 1959 and the massive windfalls accrued over subsequent decades, were believed to have led to a decline in the manufacturing sector in the Netherlands,[28] leading to the theory of Dutch disease.[21]
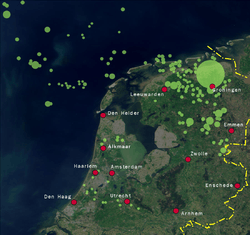
While its oil reserves in the North Sea are of little importance, in the Netherlands have an estimated 25% of natural gas reserves in the EU.[42] Natural gas reserves of the Netherlands are estimated (as of 2014) to be about 600 billion cubic feet,[43] or about 0.3% of the world total. In 2014–2015 the government decided to reduce the production of gas in the province Groningen significantly due to problems of sinking ground, differential settlement levels and tremors (small earth quakes) causing damages to properties, end 2018 the government decided to completely abandon the gas production in the province of Groningen by reducing the production slightly each year, the production is expected to disappear entirely in 2028[44]
To reduce its greenhouse emissions, the government of the Netherlands is subsidizing a transition away from natural gas for all homes in the country by 2050.[45]
Nuclear energy
Researchers in the Netherlands began studying nuclear energy in the 1930s and began construction of research reactor Dodewaard in 1955. Researchers’ goal was to introduce nuclear power technology by 1962 and replace fossil fuels. In 1968, a test nuclear reactor was attached to the power grid. This unit was shut down in 1997. In the 1970s, the Dutch chose a policy that required reprocessing all spent nuclear fuel. In 1984, the government decided to create a long-term (100 years) storage facility for all intermediate and low-level radioactive waste and research strategies for ultimate disposal. In September 2003, the Central Organization for Radioactive Waste created an interim storage facility for high-level waste. The Netherlands' only commercial nuclear reactor is Borssele, which became operational in 1973 and as of 2011 produces about 4% of the country's electricity.[46] The older Dodewaard nuclear power plant was a test reactor that later got attached to the national grid but was closed in 1997. A 2MW research reactor is located in Delft, as part of the physics department of Delft University of Technology. This reactor is not meant for energy provision, but used as a neutron and positron source for research.
In 1994, the States General of the Netherlands voted to phase out nuclear power after a discussion of nuclear waste management. In 1997, the power station at Dodewaard was shut down and the government decided it was planning to end Borssele's operating license in 2003. This has since been postponed to 2034, if it complied with the highest safety standards. After the 2010 election, the new government was open to expanding nuclear power. Both of the companies that share ownership of Borssele are proposing to build new reactors.[47][48] In January 2012, Delta announced it postpones any decision to start building a second nuclear power plant.
Tourism
In 2011 the Netherlands was visited by 11.3 million foreign tourists.[49] In 2012, the Dutch tourism industry contributed 5.4% in total to the country's GDP and 9.6% in total to its employment. With its global ranking of 147th and 83rd place for total contribution to respectively GDP and employment, tourism is a relatively small sector of the Dutch economy.[50] North Holland was by far the most popular province for foreign tourists in 2011. Out of all 11.3 million tourists, 6 million visited North Holland. South Holland took the second place with 1.4 million. Germans, Britons and Belgians made up the majority of foreign tourists, respectively 3, 1.5 and 1.4 million.[51] As of 2020, there are nine World Heritage Sites in the Netherlands. The Netherlands are well known for their art and rich historical heritage.
Data
The following table shows the main economic indicators in 1980–2018. Inflation under 2% is in green.[52][53]
| Year | GDP (in Bil. Euro) |
GDP per capita (in Euro) |
GDP growth (real) |
Inflation rate (in Percent) |
Unemployment (in Percent) |
Government debt (in % of GDP) |
|---|---|---|---|---|---|---|
| 1980 | 170.7 | 12,066 | n/a | n/a | 3.4 % | 44.6 % |
| 1981 | ||||||
| 1982 | ||||||
| 1983 | ||||||
| 1984 | ||||||
| 1985 | ||||||
| 1986 | n/a | |||||
| 1987 | ||||||
| 1988 | ||||||
| 1989 | ||||||
| 1990 | ||||||
| 1991 | ||||||
| 1992 | ||||||
| 1993 | ||||||
| 1994 | ||||||
| 1995 | ||||||
| 1996 | ||||||
| 1997 | ||||||
| 1998 | ||||||
| 1999 | ||||||
| 2000 | ||||||
| 2001 | ||||||
| 2002 | ||||||
| 2003 | ||||||
| 2004 | ||||||
| 2005 | ||||||
| 2006 | ||||||
| 2007 | ||||||
| 2008 | ||||||
| 2009 | ||||||
| 2010 | ||||||
| 2011 | ||||||
| 2012 | ||||||
| 2013 | ||||||
| 2014 | ||||||
| 2015 | ||||||
| 2016 | ||||||
| 2017 | ||||||
| 2018 |
Largest companies
The Netherlands is home to several large multinationals. Royal Dutch Shell is the largest company of the Netherlands by revenue and the largest in the world until 2009,[54] but it has fallen since to 7th place. Other well-known multinationals are Heineken, Ahold, Philips, TomTom, Unilever, Randstad and ING, all of which have their headquarters in Amsterdam except Unilever which is located in Rotterdam. Thousands of companies of non-Dutch origin have their headquarters in the Netherlands, like EADS, LyondellBasell and IKEA, because of attractive Corporate tax levels.
The Netherlands' biggest companies as of 2011 are as following:
| Rank[55] | Name | Headquarters | Revenue (Mil. €) | Profit (Mil. €) | Employees (World) |
|---|---|---|---|---|---|
| 1. | Royal Dutch Shell | The Hague | 378,152 | 20,127 | 97,000 |
| 2. | ING Group | Amsterdam | 147,052 | 3,678 | 106,139 |
| 3. | Aegon | The Hague | 65,136 | 2,330 | 27,474 |
| 4. | Airbus | Leiden | 60,597 | 732 | 121,691 |
| 5. | LyondellBasell Industries | Rotterdam | 41,151 | N.A. | 14,000 |
| 6. | Royal Ahold | Amsterdam | 39,111 | 1,130 | 122,027 |
| 7. | Royal Philips Electronics | Amsterdam | 33,667 | 1,915 | 119,001 |
| 8. | Rabobank Group | Utrecht | 32,672 | 3,552 | 58,714 |
| 9. | GasTerra | Groningen | 24,313 | 48 | 188 |
| 10. | Heineken Holding | Amsterdam | 21,684 | 954 | 65,730 |
| — | SHV Holdings | Utrecht | 21,202 | 799 | 50,300 |
| — | Akzo Nobel | Amsterdam | 20,419 | 999 | 55,590 |
Mergers and acquisitions
In the Netherlands 22,484 deals were conducted between 1985 and 2018. This sums to an overall value of 2,226.6 billion USD. The year with the most deals has been 2000 with 1,169 deals. However, the most value added up in 2007 with almost 394.9 followed by a drastic slump during the world financial crisis.[56]
Here is a list of the most important deals in, into out of the Netherlands.
| Date announced | Acquiror name | Acquiror mid-industry | Acquiror nation | Target name | Target mid-industry | Target nation | Value of transaction ($mil) |
| 25 April 2007 | RFS Holdings BV | Other Financials | Netherlands | ABN-AMRO Holding NV | Banks | Netherlands | 98,189.19 |
| 19 March 2007 | Barclays PLC | Banks | United Kingdom | ABN-AMRO Holding NV | Banks | Netherlands | 92,606.80 |
| 28 October 2004 | Royal Dutch Petroleum Co | Oil & Gas | Netherlands | Shell Transport & Trading Co | Oil & Gas | United Kingdom | 74,558.58 |
| 4 August 2015 | Royal Dutch Shell PLC | Petrochemicals | Netherlands | BG Group PLC | Oil & Gas | United Kingdom | 69,445.02 |
| 2 March 2016 | CNAC Saturn (NL) BV | Chemicals | Netherlands | Syngenta AG | Chemicals | Switzerland | 41,840.11 |
| 27 January 2006 | Mittal Steel Co NV | Metals & Mining | Netherlands | Arcelor SA | Metals & Mining | Luxembourg | 32,240.47 |
| 3 September 2017 | PPG Industries Inc | Chemicals | United States | Akzo Nobel NV | Chemicals | Netherlands | 26,560.76 |
| 4 August 2015 | Royal Dutch Shell PLC | Petrochemicals | Netherlands | Royal Dutch Shell PLC | Petrochemicals | Netherlands | 25,000.00 |
| 29 September 2008 | The Netherlands | National Government | Netherlands | Fortis Bank Nederland(Holding) | Banks | Netherlands | 23,137.31 |
| 10 April 2010 | VimpelCom Ltd | Wireless | Netherlands | Weather Investments Srl | Telecommunications Services | Italy | 22,382.31 |
Covid-19
Statistica predicts that in 2020, the Dutch economy could face a recession due to the Covid-19 pandemic.[57]
See also
- Bureau for Economic Policy Analysis
- De Nederlandsche Bank (Central Bank of The Netherlands)
- Dutch disease
- Port of Rotterdam
- List of companies of the Netherlands
- Ministry of Finance
- Polder Model (Dutch version of consensus policy in economics)
- Social-Economic Council (economic advisory council of the Dutch government)
- Taxation in the Netherlands
- VNO-NCW (Confederation of Netherlands Industry and Employers)
- BrabantStad
- Randstad
Sources
External links
- World Bank Summary Trade Statistics Netherlands
- Useful information about the financial institutions in the Netherlands
- Tariffs applied by the Netherlands as provided by ITC's Market Access Map, an online database of customs tariffs and market requirements
Further reading
- van Riel, Arthur. "Review: Rethinking the Economic History of the Dutch Republic: The Rise and Decline of Economic Modernity Before the Advent of Industrialized Growth," The Journal of Economic History, Vol. 56, No. 1 (Mar. 1996), pp. 223–229 in JSTOR
- de Vries, Johan. "Benelux, 1920–1970," in C. M. Cipolla, ed. The Fontana Economic History of Europe: Contemporary Economics Part One (1976) pp 1–71
- Vlekke, Bernard H. M. Evolution of the Dutch Nation (1945) 382 pp. online edition
- Wintle, Michael P. An Economic and Social History of the Netherlands, 1800–1920: Demographic, Economic, and Social Transition (Cambridge University Press, 2000) online edition
- van Zanden, J. L. The Economic History of The Netherlands 1914–1995: A Small Open Economy in the 'Long' Twentieth Century (Routledge, 1997) excerpt and text search
References
- "World Economic Outlook Database, April 2019". IMF.org. International Monetary Fund. Retrieved 29 September 2019.
- "World Bank Country and Lending Groups". datahelpdesk.worldbank.org. World Bank. Retrieved 29 September 2019.
- "Population on 1 January". ec.europa.eu/eurostat. Eurostat. Retrieved 13 July 2020.
- "World Economic Outlook Database, October 2019". IMF.org. International Monetary Fund. Retrieved 16 October 2019.
- "World Economic Outlook Database, April 2020". IMF.org. International Monetary Fund. Retrieved 17 April 2020.
- "The World Factbook". CIA.gov. Central Intelligence Agency. Retrieved 16 October 2019.
- Marie, Wildeboer Schut, Jean; Stella, Hoff (2 March 2017). "Verwachte armoede in 2015–2017". Armoede in Kaart. 2016 (2016). Retrieved 4 January 2018.
- "People at risk of poverty or social exclusion". ec.europa.eu/eurostat. Eurostat. Retrieved 9 July 2020.
- "Gini coefficient of equivalised disposable income - EU-SILC survey". ec.europa.eu/eurostat. Eurostat. Retrieved 9 July 2020.
- "Human Development Index (HDI)". hdr.undp.org. HDRO (Human Development Report Office) United Nations Development Programme. Retrieved 11 December 2019.
- "Inequality-adjusted HDI (IHDI)". hdr.undp.org. UNDP. Retrieved 22 May 2020.
- "Labor force, total - Netherlands". data.worldbank.org. World Bank. Retrieved 1 November 2019.
- "Employment rate by sex, age group 20-64". ec.europa.eu/eurostat. Eurostat. Retrieved 16 October 2019.
- "Unemployment by sex and age - monthly average". appsso.eurostat.ec.europa.eu. Eurostat. Retrieved 18 July 2020.
- "Youth unemployment rate". data.oecd.org. OECD. Retrieved 20 March 2020.
- "Ease of Doing Business in Netherlands". Doingbusiness.org. Retrieved 21 November 2017.
- "Euro area and EU27 government deficit both at 0.6% of GDP" (PDF). ec.europa.eu/eurostat. Eurostat. Retrieved 28 April 2020.
- "Sovereigns rating list". Standard & Poor's.
- Rogers, Simon; Sedghi, Ami (15 April 2011). "How Fitch, Moody's and S&P rate each country's credit rating". The Guardian. Retrieved 31 May 2011.
- "Scope affirms the Kingdom of the Netherlands' long-term credit rating at AAA with Stable Outlook". Scope Ratings. Retrieved 12 April 2019.
- Banning, Cees (17 June 2009). "The Dutch curse: how billions from natural gas went up in smoke". NRC Handelsblad. Archived from the original on 21 December 2016.
- "Kerncijfers - arbeid". Centraal Bureau voor de Statistiek. Retrieved 14 April 2012.
- "Unemployment falls below 4 percent". CBS. Retrieved 19 April 2018.
- "Begrotingstekort 2011 valt hoger uit". z24. 17 February 2012. Retrieved 14 April 2012.
- "CBS StatLine - Overheid; Overheidssaldo en overheidsschuld". Statline.cbs.nl. Retrieved 4 January 2018.
- "Missing File" (PDF). 1.worldbank.org. Archived from the original (PDF) on 26 January 2013. Retrieved 4 January 2018.
- Loyen, Reginald; et al. (2003). Struggling for Leadership: Antwerp-Rotterdam Port. Competition 1870–2000. Springer. ISBN 978-3-7908-1524-5.
- "The Dutch Disease" (26 November 1977). The Economist, pp. 82–83.
- "General government final consumption expenditure (% of GDP)". World Bank. Retrieved 7 April 2013.
- "Total tax revenue as percent of GDP". OECD. Retrieved 7 April 2013.
- "Main national accounts tax aggregates". Eurostat. Retrieved 7 April 2013.
- "Your social security rights in the Netherlands" (PDF). Ec.europa.eu. 2013. Retrieved 4 January 2018.
- Verzekeringsbank, Sociale. "SVB home - SVB". Svb.nl. Retrieved 5 December 2017.
- "Social security in the Netherlands: Your Dutch social security benefits". Retrieved 5 December 2017.
- Roebroek, Joop M. (2016). Dixon Scheurell, John Robert P. (ed.). Social Welfare in Developed Market Countries. Routledge. pp. 147–189. ISBN 9781317366775.
- "OECD - Social Policy Division - Directorate of Employment, Labour and Social Affairs : Country chapter - Benefits and Wages : The Netherlands" (PDF). Oecd.org. 2002. Retrieved 4 January 2018.
- "Belangrijkste punten uit het Lente-akkoord". Trouw.nl (in Dutch). Retrieved 4 January 2018.
- "KINGDOM OF THE NETHERLANDS—NETHERLANDS" (PDF). Imf.org. 2016. Retrieved 4 January 2018.
- "In It Together Why Less Inequality Benefits All... in the Netherlands" (PDF). Oecd.org. 2015. Retrieved 4 January 2018.
- "Tariefsaanpassing aftrek kosten eigen woning". Belastingdienst. Archived from the original on 31 January 2017. Retrieved 15 May 2017.
- "Global Competitiveness Report 2012–2013". World Economic Forum. 5 September 2012. Archived from the original on 10 December 2014. Retrieved 11 June 2013.
- "The hunt for gas and oil reserves that are more difficult to extract". EBN. Archived from the original on 7 September 2015.
- Focus on Dutch Oil and Gas 2015 (PDF) (Report). EBN. 2015. p. 10.
- https://www.theguardian.com/environment/2018/jan/23/gas-field-earthquakes-put-netherlands-biggest-firms-on-extraction-notice
- "Van der Pekbuurt gaat als eerste Amsterdamse wijk van het aardgas af" (in Dutch). 1 October 2018.
- "Nuclear Power in the Netherlands". World Nuclear Association (WNA). January 2011. Retrieved 21 February 2011.
- Orlowski, Andrew (10 February 2011). "Holland slashes carbon targets, shuns wind for nuclear". The Register. Retrieved 21 February 2011.
- Gassmann, Michael (8 February 2011). "Energiepolitik: Holland plant strahlende Zukunft". Financial Times Deutschland (in German). Archived from the original on 11 February 2011. Retrieved 21 February 2011.
- "UNWTO Tourism Highlights, 2013 Edition". United Nations World Tourism Organization. Retrieved 25 August 2013.
- "Netherlands Economic Impact Report". World Travel & Tourism Council. Retrieved 25 August 2013.
- "Toerisme en recreatie in cijfers 2012" (in Dutch). Statistics Netherlands. Retrieved 25 August 2013.
- "Report for Selected Countries and Subjects". www.imf.org. Retrieved 10 September 2018.
- "Report for Selected Countries and Subjects". www.imf.org. Retrieved 12 April 2019.
- "Global 500 2009". Fortune. 15 May 2014. Retrieved 27 September 2017.
- "Global 500 - Fortune". Fortune. Retrieved 3 March 2015.
- "M&A Statistics by Countries - Institute for Mergers, Acquisitions and Alliances (IMAA)". Institute for Mergers, Acquisitions and Alliances (IMAA). Retrieved 26 February 2018.
- Raynor de Best (2 April 2020). "Coronavirus impact on GDP growth rate in the Netherlands 2000-2021".
Netherlands articles | |||
|---|---|---|---|
Part of the Kingdom of the Netherlands | |||
| History |
|  | |
| Geography | |||
| Politics | |||
| Economy | |||
| Culture |
| ||
| |||
| Denmark | |
|---|---|
| France |
|
| Netherlands | |