Economy of Brazil
Brazil has a developing mixed economy[26] that is the ninth largest in the world by nominal Gross Domestic Product (GDP) and eighth largest by purchasing power parity in 2019. According to International Monetary Fund (IMF), Brazils 2019 nominal GDP was R$6.826 trillion or US$1.868 trillion. Brazil is the 73rd country in the world in GDP per capita, with a value of US$8,967 per inhabitant.[4] The country has an estimated at Int$20.18 trillion worth of [27] natural resources which includes vast amounts of gold, uranium, iron, and timber.[28][29]
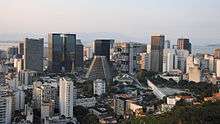
 São Paulo, the financial capital of Brazil | |
| Currency | Brazilian real (BRL, R$) |
|---|---|
| 1 January – 31 December | |
Trade organizations | WTO, BRICS, Mercosur, G-20 and others |
Country group |
|
| Statistics | |
| Population | |
| GDP | |
| GDP rank | |
GDP growth |
|
GDP per capita | |
GDP per capita rank | |
GDP by sector |
|
Population below poverty line | |
Labor force | |
Labor force by occupation |
|
| Unemployment | |
Main industries | |
| External | |
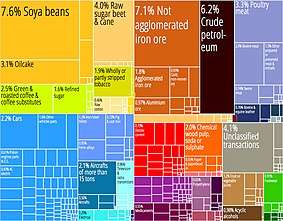
| Exports | $217.7 billion (2017)[19] |
Export goods | aircraft, steel, machinery, transport equipment, iron ore, soybeans, footwear, coffee, automobiles |
Main export partners |
|
| Imports | $150.72 billion (2017)[19] |
Import goods | machinery, electrical and transport equipment, chemical products, oil, automotive parts, electronics |
Main import partners |
|
FDI stock | |
Gross external debt | $684.6 billion (January 2018)[20] |
| Public finances | |
| −1.1% (of GDP) (2017 est.)[16] | |
| Revenues | 733.7 billion (2017 est.)[16] |
| Expenses | 756.3 billion (2017 est.)[16] |
Foreign reserves | $373.9 billion (2017 est.)[24][25] |
As of late 2010, Brazil's economy is the largest in Latin America[30] and the second largest in the Americas. From 2000 to 2012, Brazil was one of the fastest-growing major economies in the world, with an average annual GDP growth rate of over 5%. Its GDP surpassed that of the United Kingdom in 2012, temporarily making Brazil the world's sixth-largest economy. However, Brazil's economic growth decelerated in 2013[31] and the country entered a recession in 2014. The economy started to recover in 2017, with a 1% growth in the first quarter followed by a 0.3% growth in second quarter compared to the same period of the previous year, and officially exited the recession. Brazil has remained stuck in the "middle income trap" and also faces high unemployment.[32][17]
According to the World Economic Forum, Brazil was the top country in upward evolution of competitiveness in 2009, gaining eight positions among other countries, overcoming Russia for the first time, and partially closing the competitiveness gap with India and China among the BRIC economies. Important steps taken since the 1990s toward fiscal sustainability, as well as measures taken to liberalize and open the economy, have significantly boosted the country's competitiveness fundamentals, providing a better environment for private-sector development.[33] In 2020, Forbes ranked Brazil as having the 7th largest number of billionaires in the world.[34] Brazil is a member of diverse economic organizations, such as Mercosur, Unasul, G8+5, G20, WTO, Paris Club and the Cairns Group.
From a colony whose aim was to export primary goods (sugar, gold and cottom), Brazil has managed to create a diversified industrial base in the XX century. The steel industry is a prime example of that, with Brazil being the 9th largest steel producer in 2018, and the 5th largest steel net exporter in 2018[35] Gerdau is the largest producer of long steel in the Americas, owning 337 industrial and commercial units and more than 45,000 employees across 14 countries.
Income inequality in Brazil is also a marked feature of the Brazilian economy, an aspect which is frequently highlighted abroad.[36] According to data from the Brazilian Institute of Geography and Statistics, extreme poverty had increased by 11 per cent in 2017, while inequalities also increased again (the Gini index rose from 0.555 to 0.567). The increase of informal work would be the leading cause, according to economists.[37]
History
When the Portuguese explorers arrived in the 16th century, the native tribes of current-day Brazil totaled about 2.5 million people and had lived virtually unchanged since the Stone Age. From Portugal's colonization of Brazil (1500–1822) until the late 1930s, the Brazilian economy relied on the production of primary products for exports. In the Portuguese Empire, Brazil was a colony subjected to an imperial mercantile policy, which had three main large-scale economic production cycles – sugar, gold and from the early 19th century on, coffee. The economy of Brazil was heavily dependent on African slave labor until the late 19th century (about 3 million imported African slaves in total). In that period Brazil was also the colony with the largest amount of European settlers, most of them Portuguese (including Azoreans and Madeirans) but also some Dutch (see Dutch Brazil), Spaniards, English, French, Germans, Flemish, Danish, Scottish and Sephardic Jews.
Subsequently, Brazil experienced a period of strong economic and demographic growth accompanied by mass immigration from Europe, mainly from Portugal (including the Azores and Madeira), Italy, Spain, Germany, Poland, Ukraine, Switzerland, Austria and Russia. Smaller numbers of immigrants also came from the Netherlands, France, Finland, Iceland to and the Scandinavian countries, Lithuania, Belgium, Bulgaria, Hungary, Greece, Latvia, England, Ireland, Scotland, Croatia, Czech Republic, Malta, North Macedonia and Luxembourg, the Middle East (mainly from Lebanon, Syria and Armenia), Japan, the United States and South Africa, until the 1930s. In the New World, the United States, Argentina, Brazil, Canada, Australia, Uruguay, New Zealand, Chile, Mexico, Cuba, Venezuela, Paraguay, Puerto Rico and Peru (in descending order) were the countries that received most immigrants. In Brazil's case, statistics showed that 4.5 million people emigrated to the country between 1882 and 1934.
In 2007, with a population of over 209 million and abundant natural resources, Brazil is one of the ten largest markets in the world, producing tens of millions of tons of steel, 26 million tons of cement, 3.5 million television sets, and 3 million refrigerators. In addition, about 70 million cubic meters of petroleum were being processed annually into fuels, lubricants, propane gas, and a wide range of hundreds of petrochemicals.[29][38]
Brazil has at least 161,500 kilometers of paved roads, more than 150 Gigawatts of installed electric power capacity[39] and its real per capita GDP surpassed US$9,800 in 2017.[29][40] Its industrial sector accounts for three-fifths of the Latin American economy's industrial production.[41] The country's scientific and technological development is argued to be attractive to foreign direct investment, which has averaged US$30 billion per year in recent years.[41] The agricultural sector, locally called the agronegócio (agro-business), has also been dynamic: for two decades this sector has kept Brazil among the most highly productive countries in areas related to the rural sector.[41] The agricultural sector and the mining sector also supported trade surpluses which allowed for massive currency gains (rebound) and external debt paydown. Due to a downturn in Western economies, Brazil found itself in 2010 trying to halt the appreciation of the real.[42]
Data from the Asian Development Bank and the Tax Justice Network show the untaxed "shadow" economy of Brazil is 39% of GDP.[43]
One of the most important corruption cases in Brazil concerns the company Odebrecht. Since the 1980s, Odebrecht has spent several billion dollars in the form of bribes to bribe parliamentarians to vote in favour of the group. At the municipal level, Odebrecht's corruption was aimed at "stimulating privatisations", particularly in water and sewer management.[44]
Data
The following table shows the main economic indicators in 1980–2018. Inflation under 5% is in green.[45][46]
| Year | GDP (in bn. US$ PPP) |
GDP per capita (in US$ PPP) |
GDP growth (real) |
Inflation rate (in Percent) |
Unemployment (in Percent) |
Government debt (in % of GDP) |
|---|---|---|---|---|---|---|
| 1980 | 567.7 | 4,787 | n/a | n/a | ||
| 1981 | n/a | n/a | ||||
| 1982 | n/a | n/a | ||||
| 1983 | n/a | n/a | ||||
| 1984 | n/a | n/a | ||||
| 1985 | n/a | n/a | ||||
| 1986 | n/a | n/a | ||||
| 1987 | n/a | n/a | ||||
| 1988 | n/a | n/a | ||||
| 1989 | n/a | n/a | ||||
| 1990 | n/a | n/a | ||||
| 1991 | 10.1 % | n/a | ||||
| 1992 | n/a | |||||
| 1993 | n/a | |||||
| 1994 | n/a | |||||
| 1995 | n/a | |||||
| 1996 | n/a | |||||
| 1997 | n/a | |||||
| 1998 | n/a | |||||
| 1999 | n/a | |||||
| 2000 | 65.6 % | |||||
| 2001 | ||||||
| 2002 | ||||||
| 2003 | ||||||
| 2004 | ||||||
| 2005 | ||||||
| 2006 | ||||||
| 2007 | ||||||
| 2008 | ||||||
| 2009 | ||||||
| 2010 | ||||||
| 2011 | ||||||
| 2012 | ||||||
| 2013 | ||||||
| 2014 | ||||||
| 2015 | ||||||
| 2016 | ||||||
| 2017 | ||||||
| 2018 |
Components
The service sector is the largest component of the gross domestic product (GDP) at 67.0 percent, followed by the industrial sector at 27.5 percent. Agriculture represents 5.5 percent of GDP (2011).[47] The Brazilian labor force is estimated at 100.77 million of which 10 percent is occupied in agriculture, 19 percent in the industry sector and 71 percent in the service sector.
Agricultural Sector
| Agriculture production | ||
|---|---|---|
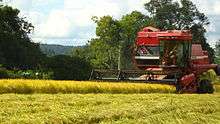 | ||
| Combine harvester on a plantation | ||
| Main products | coffee, soybeans, wheat, rice, corn, sugarcane, cocoa, citrus; beef | |
| Labor force | 15.7% of total labor force | |
| GDP of sector | 5.9% of total GDP | |
Agribusiness contributes to Brazil's trade balance, in spite of trade barriers and subsidizing policies adopted by the developed countries.[48]
In the space of fifty five years (1950 to 2005), the population of Brazil grew from 51 million to approximately 187 million inhabitants,[49] an increase of over 2 percent per year. Brazil created and expanded a complex agribusiness sector.[48] However, some of this is at the expense of the environment, including the Amazon.
The importance given to the rural producer takes place in the shape of the agricultural and cattle-raising plan and through another specific subsidy program geared towards family agriculture (Programa de Fortalecimento da Agricultura Familiar (Pronaf)), which guarantees financing for equipment and cultivation and encourages the use of new technology. With regards to family agriculture, over 800 thousand rural inhabitants are assisted by credit, research and extension programs. A special line of credit is available for women and young farmers.[48]
With The Land Reform Program, on the other hand, the country's objective is to provide suitable living and working conditions for over one million families who live in areas allotted by the State, an initiative capable of generating two million jobs. Through partnerships, public policies and international partnerships, the government is working towards guaranteeing infrastructure for the settlements, following the examples of schools and health outlets. The idea is that access to land represents just the first step towards the implementation of a quality land reform program.[48]
Over 600,000 km² of land are divided into approximately five thousand areas of rural property; an agricultural area currently with three borders: the Central-western region (savannah), the northern region (area of transition) and parts of the northeastern region (semi-arid). At the forefront of grain crops, which produce over 110 million tonnes/year, is the soybean, yielding 50 million tonnes.[48]
In the cattle-raising sector, the "green ox," which is raised in pastures, on a diet of hay and mineral salts, conquered markets in Asia, Europe and the Americas, particularly after the "mad cow disease" scare period. Brazil has the largest cattle herd in the world, with 198 million heads,[50] responsible for exports of more than US$1 billion/year.[48]
A pioneer and leader in the manufacture of short-fiber timber cellulose, Brazil has also achieved positive results within the packaging sector, in which it is the fifth largest world producer. In the foreign markets, it answers for 25 percent of global exports of raw cane and refined sugar; it is the world leader in soybean exports and is responsible for 80 percent of the planet's orange juice, and since 2003, has had the highest sales figures for beef and chicken.[48]
Industry
| Industrial production | ||
|---|---|---|
_Embraer_EMB-135BJ_Legacy_D-AVIB_(5024079232).jpg) | ||
| Embraer Legacy 600 jet manufactured by Embraer | ||
| Main industries | textiles, shoes, chemicals, cement, lumber, iron ore, tin, steel, aircraft, motor vehicles and parts, other machinery and equipment | |
| Industrial growth rate | −5% (2015 est.) | |
| Labor force | 13.3% of total labor force | |
| GDP of sector | 22.2% of total GDP | |
Brazil has the second-largest manufacturing sector in the Americas. Accounting for 28.5 percent of GDP, Brazil's industries range from automobiles, steel and petrochemicals to computers, aircraft, and consumer durables. With increased economic stability provided by the Plano Real, Brazilian and multinational businesses have invested heavily in new equipment and technology, a large proportion of which has been purchased from US firms.
Brazil has a diverse and sophisticated services industry as well. During the early 1990s, the banking sector accounted for as much as 16 percent of the GDP. Although undergoing a major overhaul, Brazil's financial services industry provides local businesses with a wide range of products and is attracting numerous new entrants, including U.S. financial firms. On 8 May 2008, the São Paulo Stock Exchange (Bovespa) and the São Paulo-based Brazilian Mercantile and Futures Exchange (BM&F) merged, creating BM&F Bovespa, one of the largest stock exchanges in the world. Also, the previously monopolistic reinsurance sector is being opened up to third party companies.[51]
As of 31 December 2007, there were an estimated 21,304,000 broadband lines in Brazil. Over 75 percent of the broadband lines were via DSL and 10 percent via cable modems.
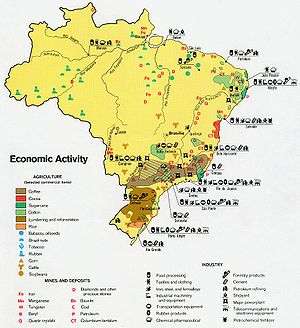
Proven mineral resources are extensive. Large iron and manganese reserves are important sources of industrial raw materials and export earnings. Deposits of nickel, tin, chromite, uranium, bauxite, beryllium, copper, lead, tungsten, zinc, gold, and other minerals are exploited. High-quality coking-grade coal required in the steel industry is in short supply.
Largest companies
In 2017, 20 Brazilian companies were listed in the Forbes Global 2000 list – an annual ranking of the top 2000 public companies in the world by Forbes magazine based on a combination of sales, assets, profit, and market value.[52] The 20 companies listed were:
| World Rank | Company | Industry | Revenue (billion $) | Profits (billion $) | Assets (billion $) | Market Value (billion $) | Headquarters |
|---|---|---|---|---|---|---|---|
| 38 | Banco Itaú Unibanco | Banking | 61.3 | 6.7 | 419.9 | 79.2 | São Paulo |
| 62 | Banco Bradesco | Banking | 70.2 | 4.3 | 362.4 | 53.5 | Osasco, SP |
| 132 | Banco do Brasil | Banking | 57.3 | 2.3 | 430.6 | 29 | Brasilia |
| 156 | Vale | Mining | 27.1 | 3.8 | 99.1 | 45.4 | Rio de Janeiro |
| 399 | Petrobras | Oil & Gas | 81.1 | - 4.3 | 247.3 | 61.3 | Rio de Janeiro |
| 610 | Eletrobras | Utilities | 17.4 | 0.983 | 52.4 | 7.2 | Rio de Janeiro |
| 791 | Itaúsa | Conglomerate | 1.3 | 2.4 | 18.1 | 23 | São Paulo |
| 895 | JBS | Food Processing | 48.9 | 0.108 | 31.6 | 8.2 | São Paulo |
| 981 | Ultrapar | Conglomerate | 22.2 | 0.448 | 7.4 | 12.5 | São Paulo |
| 1103 | Cielo | Financial services | 3.5 | 1.1 | 9.4 | 20.9 | Barueri, SP |
| 1233 | Braskem | Chemicals | 13.8 | - 0.136 | 15.9 | 7.9 | São Paulo |
| 1325 | BRF | Food processing | 9.7 | - 0.107 | 13.8 | 9.3 | Itajaí, SC |
| 1436 | Sabesp | Waste Management | 4 | 0.846 | 11.6 | 7.4 | São Paulo |
| 1503 | Oi | Telecommunications | 7.5 | - 2 | 25.2 | 0.952 | Rio de Janeiro |
| 1515 | Gerdau | Iron & Steel | 10.8 | - 0.395 | 16.8 | 1.4 | Porto Alegre, RS |
| 1545 | CBD | Retail | 12 | 0.139 | 13.9 | 5.9 | São Paulo |
| 1572 | CCR | Transportation | 2.9 | 0.429 | 7.5 | 11.5 | São Paulo |
| 1597 | Bovespa | Stock Exchange | 0.666 | 0.415 | 9.7 | 12.8 | São Paulo |
| 1735 | CPFL Energia | Electricity | 5.4 | 0.258 | 13 | 8.4 | Campinas, SP |
| 1895 | Kroton Educacional | Higher Education | 1.5 | 0.535 | 5.4 | 7.1 | Belo Horizonte, MG |
Energy
The Brazilian government has undertaken an ambitious program to reduce dependence on imported petroleum. Imports previously accounted for more than 70% of the country's oil needs but Brazil became self-sufficient in oil in 2006–2007. Brazil is one of the world's leading producers of hydroelectric power, with a current capacity of about 260,000 megawatts. Existing hydroelectric power provides 90% of the nation's electricity. Two large hydroelectric projects, the 19,900 megawatt Itaipu Dam on the Paraná River (the world's largest dam) and the Tucurui Dam in Pará in northern Brazil, are in operation. Brazil's first commercial nuclear reactor, Angra I, located near Rio de Janeiro, has been in operation for more than 10 years. Angra II was completed in 2002 and is in operation too. An Angra III had a planned inauguration scheduled for 2014. The three reactors would have a combined capacity of 9,000 megawatts when completed. The government also plans to build 19 more nuclear plants by the year 2020.
Economic status
| Statistical Table | |
|---|---|
| Inflation (IPCA) | |
| 2002 | 12.53% |
| 2003 | 9.30% |
| 2004 | 7.60% |
| 2005 | 5.69% |
| 2006 | 3.14% |
| 2007 | 4.46% |
| 2008 | 5.91% |
| 2009 | 4.31% |
| 2010 | 5.90% |
| 2011 | 6.50% |
| 2012 | 5.84% |
| 2013 | 5.91% |
| 2014 | 6.41% |
| 2015 | 10.67% |
| 2016 | 6.29% |
| 2017 | 2.95% |
| 2018 | 3.75% |
| Source:[53] | |
| Average GDP growth rate 1950–2013 | |
| 1950–59 | 7.1% |
| 1960–69 | 6.1% |
| 1970–79 | 8.9% |
| 1980–89 | 3.0% |
| 1990–99 | 1.7% |
| 2000–09 | 3.3% |
| 2010–17 | 1.4% |
| Source:[54] | |
Sustainable growth
Portuguese explorers arrived in 1500, but it was only in 1808 that Brazil obtained a permit from the Portuguese colonial government to set up its first factories and manufacturers. In the 21st century, Brazil became the eighth largest economy in the world. Originally, its exports were basic raw and primary goods, such as sugar, rubber and gold. Today, 84% of exports are of manufactured and semi-manufactured products.
The period of great economic transformation and growth occurred between 1875 and 1975.[55]
In the last decade, domestic production increased by 32.3%. Agribusiness (agriculture and cattle-raising), which grew by 47% or 3.6% per year, was the most dynamic sector – even after having weathered international crises that demanded constant adjustments to the Brazilian economy.[56] The Brazilian government also launched a program for economic development acceleration called Programa de Aceleração do Crescimento, aiming to spur growth.[57]
Brazil's transparency rank in the international world is 75th according to Transparency International.[58]
Control and reform
Among measures recently adopted to balance the economy, Brazil carried out reforms to its social security (state and retirement pensions) and tax systems. These changes brought with them a noteworthy addition: a Law of Fiscal Responsibility which controls public expenditure by the executive branches at federal, state and municipal levels. At the same time, investments were made towards administration efficiency and policies were created to encourage exports, industry and trade, thus creating "windows of opportunity" for local and international investors and producers.
With these alterations in place, Brazil has reduced its vulnerability: it doesn't import the oil it consumes; it has halved its domestic debt through exchange rate-linked certificates and has seen exports grow, on average, by 20% a year. The exchange rate does not put pressure on the industrial sector or inflation (at 4% a year), and does away with the possibility of a liquidity crisis. As a result, the country, after 12 years, has achieved a positive balance in the accounts which measure exports/imports, plus interest payments, services and overseas payment. Thus, respected economists say that the country won't be deeply affected by the current world economic crisis.[59]
In 2017, President Michel Temer refused to make public the list of companies accused of "modern slavery". The list, made public yearly since the presidency of Lula Da Silva in 2003, was intended to persuade companies to settle their fines and conform to labor regulations, in a country where corruption of the political class risked compromising respect for the law. The relations of the president-in-office with the "landowner lobby" were denounced by dismissed President Dilma Rousseff on this occasion.[60]
Trade with the UK for Brazil can mean more investment, access to better skilled labour, sales of natural resources, tax exporting and access to Britains goods and services.
Consistent policies
Support for the productive sector has been simplified at all levels; active and independent, Congress and the Judiciary Branch carry out the evaluation of rules and regulations. Among the main measures taken to stimulate the economy are the reduction of up to 30 percent on manufactured products tax (IPI), and the investment of $8 billion on road cargo transportation fleets, thus improving distribution logistics. Further resources guarantee the propagation of business and information telecenters.
The policy for industry, technology and foreign trade, at the forefront of this sector, for its part, invests $19.5 billion in specific sectors, following the example of the software and semiconductor, pharmaceutical and medicine product, and capital goods sectors.[61]
Mergers and acquisitions
Between 1985 and 2017, 11,563 mergers & acquisitions with a total known value of US$1,185 billion with the involvement of Brazilian firms were announced.[62] The year 2010 was a new record in terms of value with $115 billion of transactions. It is worth noticing, that in the top 100 deals by value there are only four cases of Brazilian companies acquiring a foreign company. This reflects the strong interest in the country from a direct investment perspective.
Here is a list of the largest deals where Brazilian companies took on either the role of the acquiror or the target:
| Date Announced | Acquiror Name | Acquiror Mid Industry | Acquiror Nation | Target Name | Target Mid Industry | Target Nation | Value of Transaction ($mil) |
| 09/01/2010 | Petrobras | Oil & Gas | Brazil | Brazil-Oil & Gas Blocks | Oil & Gas | Brazil | 42,877.03 |
| 02/20/2017 | Vale SA | Metals & Mining | Brazil | Valepar SA | Metals & Mining | Brazil | 20,956.66 |
| 08/11/2006 | Cia Vale do Rio Doce SA | Metals & Mining | Brazil | Inco Ltd | Metals & Mining | Canada | 17,150.30 |
| 02/20/2008 | BM&F | Brokerage | Brazil | Bovespa Holding SA | Brokerage | Brazil | 10,309.09 |
| 01/13/2000 | Telefónica SA | Telecommunications Services | Spain | Telecommunicacoes de São Paulo | Telecommunications Services | Brazil | 10,213.31 |
| 07/31/2014 | Telefónica Brasil SA | Telecommunications Services | Brazil | GVT Participacoes SA | Telecommunications Services | Brazil | 9,823.31 |
| 05/10/2010 | Telefónica SA | Telecommunications Services | Spain | Brasilcel NV | Telecommunications Services | Brazil | 9,742.79 |
| 11/03/2008 | Banco Itaú Holding Financeira | Banks | Brazil | Unibanco Holdings SA | Other Financials | Brazil | 8,464.77 |
| 03/03/2004 | Ambev | Food and Beverage | Brazil | John Labatt Ltd | Food and Beverage | Canada | 7,758.01 |
| 10/01/2010 | China Petrochemical Corporation | Oil & Gas | China | Repsol YPF Brasil SA | Oil & Gas | Brazil | 7,111.00 |
| 02/07/2012 | Banestado Participacoes | Other Financials | Brazil | Redecard SA | Computers & Peripherals | Brazil | 6,821.71 |
Entrepreneurship
According to a search of Global Entrepreneurship Monitor in 2011 Brazil had 27 million adults aged between 18 and 64 either starting or owning a business, meaning that more than one in four Brazilian adults were entrepreneurs. In comparison to the other 54 countries studied, Brazil was the third-highest in total number of entrepreneurs. The Institute of Applied Economic Research (Ipea), a government agency, found that 37 million jobs in Brazil were associated with businesses with less than 10 employees.[63]
Even though Brazil ranks internationally as one of the hardest countries in the region to do business due to its complicated bureaucracy, there is a healthy number of entrepreneurs, thanks to the huge internal consumer market and various government programs.
The most recent research of Global Entrepreneurship Monitor revealed in 2013 that 50.4% of Brazilian new entrepreneurs are men, 33.8% are in the 35–44 age group, 36.9% completed high school and 47.9% earn 3–6 times the Brazilian minimum wage. In contrast, 49.6% of entrepreneurs are female, only 7% are in the 55–64 age group, 1% have postgraduate education and 1.7% earn more than 9 times the minimum wage.[64]
See also
- Brazil and the World Bank
- Economic history of Brazil
- Brazilian Packaging Market
- Economy of São Paulo
- List of Brazilian federative units by gross domestic product
- 2015–2017 Brazilian economic crisis
- List of Latin American and Caribbean countries by GDP growth
- List of Latin American and Caribbean countries by GDP (nominal)
- List of Latin American and Caribbean countries by GDP (PPP)
References
- "World Economic Outlook Database, April 2019". IMF.org. International Monetary Fund. Retrieved 29 September 2019.
- "World Bank Country and Lending Groups". datahelpdesk.worldbank.org. World Bank. Retrieved 29 September 2019.
- "Population, total - Brazil". data.worldbank.org. World Bank. Retrieved 19 October 2019.
- "World Economic Outlook Database, October 2019". IMF.org. International Monetary Fund. Retrieved 12 February 2020.
- "World Economic Outlook Database, April 2020". IMF.org. International Monetary Fund. Retrieved 18 May 2020.
- "World Economic Outlook Update, June 2020". IMF.org. International Monetary Fund. Retrieved 10 August 2020.
- Table 3 - Cumulative Rate in the Year IBGE. Retrieved on 30 March 2016.
- "Inflação oficial fecha 2018 em 3,75%". G1 (in Portuguese). IBGE and Central Bank of Brazil. Retrieved 11 January 2019.
- Machado, Ana P. (26 November 2018). "Desigualdade de renda para de cair e pobreza cresce no Brasil, diz Oxfam" (in Portuguese). EXAME. Retrieved 3 July 2019.
- "Poverty headcount ratio at $5.50 a day (2011 PPP) (% of population) - Brazil". data.worldbank.org. World Bank. Retrieved 22 March 2020.
- "GINI index (World Bank estimate) - Brazil". data.worldbank.org. World Bank. Retrieved 22 March 2020.
- "Human Development Index (HDI)". hdr.undp.org. HDRO (Human Development Report Office) United Nations Development Programme. Retrieved 11 December 2019.
- "Inequality-adjusted HDI (IHDI)". hdr.undp.org. UNDP. Retrieved 22 May 2020.
- "Labor force, total - Brazil". data.worldbank.org. World Bank. Retrieved 18 May 2020.
- "Employment to population ratio, 15+, total (%) (national estimate) - Brazil". data.worldbank.org. World Bank. Retrieved 5 October 2019.
- "CIA World Factbook". CIA.gov. Central Intelligence Agency. Retrieved 5 January 2019.
- "Desemprego fica em 11,0% em dezembro, mas ainda atinge 11,6 milhões, diz IBGE". G1. Retrieved 30 August 2019.
- https://www1.folha.uol.com.br/mercado/2018/10/brasil-sobe-16-posicoes-em-ranking-que-avalia-facilidade-de-fazer-negocios.shtml
- "Brasil - Estatisticas de Comercio Exterior". Retrieved 6 March 2018.
- "Banco Central do Brasil". BCB. Retrieved 6 March 2018.
- DeFotis, Dimitra (17 February 2016). "Blame Oil: S&P Cuts Brazil & Saudi Ratings, Affirms Dire Russia Outlook". Barron's. Retrieved 17 March 2016.
- "Moody's downgrades Brazil's issuer and bond ratings to Ba2 with a negative outlook". Moody's. Retrieved 17 March 2016.
- Pacheco, Felipe; Sambo, Paula. "Brazil Gets Second Junk Rating as Fitch Cites Economic Slump". Bloomberg Business. Retrieved 17 March 2016.
- Banco Central do Brasil
- IMF - Brazil
- Trebat, Thomas J. (1983). Brazil's State-Owned Enterprises: A Case Study of the State as Entrepreneur. Cambridge University Press. pp. 10-15. ISBN 978-0-521-23716-1.
brazil free market economy.
- Anthony, Craig (12 September 2016). "10 Countries with the Most Natural Resources". Investopedia.
- "Report for Selected Countries and Subjects". www.imf.org. Retrieved 12 October 2018.
- "Why Invest in Brazil". M&A Advisors Brazil. 23 August 2018. Retrieved 12 October 2018.
- Is Brazil’s Economy Getting Too Hot? Forbes. Retrieved on 24 October 2011.
- http://america.aljazeera.com/articles/2015/8/17/despite-protests-wont-lead-to-radical-change-in-brazil.html
- "How can Brazil escape the middle-income trap?". World Economic Forum. 23 August 2018. Retrieved 12 October 2018.
- Global Competitiveness Report 2009-2010 Archived 1 October 2009 at the Wayback Machine World Economic Forum. Retrieved on 24 October 2011.
- Forbes billionaires https://www.forbes.com/billionaires/ Forbes billionaires Check
|url=value (help). Missing or empty|title=(help) - https://www.worldsteel.org/en/dam/jcr:dcd93336-2756-486e-aa7f-64f6be8e6b1e/2018%2520global%2520crude%2520steel%2520production.pdf
- Rossi, Mariana (25 September 2017). "Seis brasileiros concentram a mesma riqueza que a metade da população mais pobre". EL PAÍS Brasil. Retrieved 1 July 2019.
- https://www.brasildefato.com.br/2018/04/12/pobreza-extrema-aumenta-11-no-ultimo-ano-economistas-culpam-trabalho-informal/
- "Brazil - Population 2017". countryeconomy.com. Retrieved 12 October 2018.
- http://www2.aneel.gov.br/aplicacoes/capacidadebrasil/capacidadebrasil.cfm
- "Brazil GDP per capita, 1980-2017 - knoema.com". Knoema. Retrieved 12 October 2018.
- About Brazil Brazilian government. Retrieved on 24 October 2011.
- Brazil's Currency Wars – A "Real" Problem Sounds and Colours. Retrieved on 24 October 2011.
- The Secret Strength of Pakistan's Economy – Businessweek, 2017
- https://mondediplo.com/2017/10/08brazil
- "Report for Selected Countries and Subjects". www.imf.org. Retrieved 14 September 2018.
- "Report for Selected Countries and Subjects". www.imf.org. Retrieved 25 December 2019.
- http://www.worlddiplomacy.org/Countries/Brazil/InfoBra.html
- Agriculture Brazilian Government. Retrieved on 24 October 2011.
- Popclock Archived 30 April 2007 at the Wayback Machine IBGE
- Indicators Brazilian Government. Retrieved on 24 October 2011.
- "Government breaks reinsurance monopoly, discards privatization (in Portuguese)". Retrieved 29 April 2008.
- "Forbes Global 2000: Brazil". 5 June 2017.
- Inflation Ipea
- Average Exchange Rate Ipea
- Fagoyinbo, Joseph Babatunde. The Armed Forces: Instrument of Peace, Strength, Development and Prosperity. Author House. p. 209. ISBN 9781477218440.
- Sustainable growth Brazilian Government. Retrieved on 24 October 2011.
- "From crisis to crisis in Brazil". The Economist. 24 July 2007.
- Transparency by country 2009 Transparency International. Retrieved on 24 October 2011.
- Control and reform Brazilian Government. Retrieved on 24 October 2011.
- Au Brésil, Temer protège les esclavagistes
- Consistent policies Brazilian government. Retrieved on 24 October 2011.
- "M&A Statistics by Countries - Institute for Mergers, Acquisitions and Alliances (IMAA)". Institute for Mergers, Acquisitions and Alliances (IMAA). Retrieved 23 February 2018.
- "Archived copy". Archived from the original on 26 April 2014. Retrieved 13 July 2013.CS1 maint: archived copy as title (link) A spirit for entreprise, Finantial Times Online, May 8th,2013
- "Archived copy". Archived from the original on 23 June 2013. Retrieved 13 July 2013.CS1 maint: archived copy as title (link) GEM 2012 Global Report
- Rousseff Losing Bond Investors as Downgrade to Junk Looms – Bloomberg Bloomberg
- "S&P cuts Brazil credit rating as pension reform doubts grow". Reuters. 11 January 2018. Retrieved 6 January 2020.
Further reading
External links
- Ministry of Finance (Brazil)
- IBGE : Brazilian Institute of Geography and Statistics
- World Bank Summary Trade Statistics Brazil
- Brazil profile at the CIA World Factbook
- Brazil profile at The World Bank
| Members |
|  Emblem of UNASUR | ||||
|---|---|---|---|---|---|---|
| Summits | ||||||
| Topics | ||||||
(Southern Common Market) | |||||
| Politics |  | ||||
| Members |
| ||||
| Observers | |||||
| Institutions | |||||
| Currencies | |||||
| Integration | |||||
| Relations | |||||