Economy of Austria
The economy of Austria is a well-developed social market economy, with the country being one of the fourteen richest in the world in terms of GDP (gross domestic product) per capita.[18] Until the 1980s, many of Austria's largest industry firms were nationalised; in recent years, however, privatisation has reduced state holdings to a level comparable to other European economies. Labour movements are particularly strong in Austria and have large influence on labour politics. Next to a highly developed industry, international tourism is the most important part of the national economy.
 | |
| Currency | Euro (EUR, €) |
|---|---|
| Calendar year | |
Trade organisations | EU, WTO, OECD |
Country group | |
| Statistics | |
| Population | |
| GDP | |
| GDP rank | |
GDP growth |
|
GDP per capita | |
GDP per capita rank | |
GDP by sector |
|
Population below poverty line | |
Labour force | |
Labour force by occupation |
|
| Unemployment | |
Average gross salary | €4,163 / $4,604 monthly (2017) |
Average net salary | €2,761 / $3,053 monthly (2017) |
Main industries | construction, machinery, vehicles and parts, food, metals, chemicals, lumber and paper, electronics, tourism |
| External | |
| Exports | |
Export goods | machinery and equipment, motor vehicles and parts, manufactured goods, chemicals, iron and steel, foodstuffs |
Main export partners |
|
| Imports | |
Import goods | machinery and equipment, motor vehicles, chemicals, metal goods, oil and oil products, natural gas; foodstuffs |
Main import partners |
|
FDI stock | |
Gross external debt | |
| Public finances | |
| Revenues | 49.0% of GDP (2019)[16] |
| Expenses | 48.2% of GDP (2019)[16] |
| |
Foreign reserves | |
Germany has historically been the main trading partner of Austria, making it vulnerable to rapid changes in the German economy. However, since Austria became a member state of the European Union it has gained closer ties to other European Union economies, reducing its economic dependence on Germany. In addition, membership in the EU has drawn an influx of foreign investors attracted by Austria's access to the single European market and proximity to the aspiring economies of the European Union. Growth in GDP accelerated in recent years and reached 3.3% in 2006.[19]
In 2004 Austria was the fourth richest country within the European Union, having a GDP (PPP) per capita of approximately €27,666, with Luxembourg, Ireland, and Netherlands leading the list.[20]
Vienna was ranked the fifth richest NUTS-2 region within Europe (see Economy of the European Union) with GDP reaching €38,632 per capita, just behind Inner London, Luxembourg, Brussels-Capital Region and Hamburg.[20]
Growth has been steady between 2002–2006 varying between 1 and 3.3%.[21] After hitting 0% in 2013, growth has picked up a little and as of 2016 sits at 1.5%.[22]
History
Ever since the end of the World War II, Austria has achieved sustained economic growth. In the soaring 1950s, the rebuilding efforts for Austria lead to an average annual growth rate of more than 5% in real terms and averaged about four-point five percent through most of the 1960s. Following moderate real GDP growth of 1.7%, 2% and 1.2%, respectively, in 1995, 1996, and 1997, the economy rebounded and with real GDP expansion of 2.9 percent in 1998 and 2.2% in 1999.
Austria became a member of the EU on 1 January 1995.[23] Membership brought economic benefits and challenges and has drawn an influx of foreign investors attracted by Austria's access to the single European market. Austria also has made progress in generally increasing its international competitiveness. As a member of the economic and monetary union of the European Union (EMU), Austria's economy is closely integrated with other EU member countries, especially with Germany. On 1 January 1999, Austria introduced the new Euro currency for accounting purposes. In January 2002, Euro notes and coins were introduced, replacing those of the Austrian schilling.
Currency
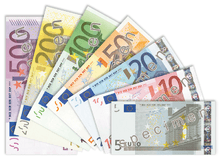
In Austria, Euros appear as 1999, however all Austrian euro coins introduced in 2002 have this year on it; unlike other countries of the Eurozone where mint year is minted in the coin. Eight different designs, one per face value, were selected for the Austrian coins. In 2007, in order to adopt the new common map like the rest of the Eurozone countries, Austria changed the common side of its coins.
Before adopting the Euro in 2002 Austria had maintained use of the Austrian schilling which was first established in December 1924. The Schilling was abolished in the wake of the Anschluss in 1938 and has been reintroduced after the end of the World War II in November 1945.
Austria has one of the richest collection of collectors' coins in the Eurozone, with face value ranging from 10 to 100 euro (although a 100,000 euro coin was exceptionally minted in 2004). These coins are a legacy of an old national practice of minting of silver and gold coins. Unlike normal issues, these coins are not legal tender in all the eurozone. For instance, a €5 Austrian commemorative coin cannot be used in any other country.
Privatisation, state participation and labour movements
Many of the country's largest firms were nationalised in the early post-war period to protect them from Soviet takeover as war reparations. For many years, the government and its state-owned industries conglomerate played a very important role in the Austrian economy. However, starting in the early 1990s, the group was broken apart, state-owned firms started to operate largely as private businesses, and a great number of these firms were wholly or partially privatised. Although the government's privatisation work in past years has been very successful, it still operates some firms, state monopolies, utilities, and services. The new government has presented an ambitious privatisation programme, which, if implemented, will considerably reduce government participation in the economy. Austria enjoys well-developed industry, banking, transportation, services, and commercial facilities.
Austria has a strong labour movement. The Austrian Trade Union Federation (ÖGB) comprises constituent unions with a total membership of about 1.5 million—more than half the country's wage and salary earners. Since 1945, the ÖGB has pursued a moderate, consensus-oriented wage policy, cooperating with industry, agriculture, and the government on a broad range of social and economic issues in what is known as Austria's "social partnership". The ÖGB has often opposed the Schüssel government's programme for budget consolidation, social reform, and improving the business climate, and indications are rising that Austria's peaceful social climate could become more confrontational.
Agriculture, industry and services
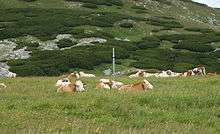
Austrian farms, like those of other west European mountainous countries, are small and fragmented, and production is relatively expensive. Since Austria's becoming a member of the EU in 1995, the Austrian agricultural sector has been undergoing substantial reform under the EU's Common Agricultural Policy (CAP). Although Austrian farmers provide about 80% of domestic food requirements, the agricultural contribution to gross domestic product (GDP) has declined since 1950 to less than 3%.
Although some industries are global competitors, such as several iron and steel works, chemical plants and oil corporations that are large industrial enterprises employing thousands of people, most industrial and commercial enterprises in Austria are relatively small on an international scale.
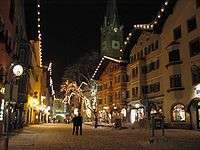
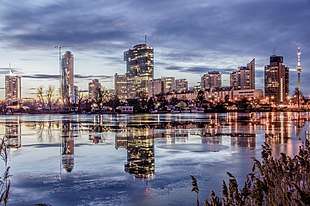
Most important for Austria is the service sector generating the vast majority of Austria's GDP. Vienna has grown into a finance and consulting metropole and has established itself as the door to the East within the last decades. Viennese law firms and banks are among the leading corporations in business with the new EU member states. Tourism is very important for Austria's economy, accounting for around 10 percent of Austria's GDP.[24] In 2001, Austria was the tenth most visited country in the world with over 18.2 million tourists. Previously, dependency on German guests made this sector of the Austrian economy very dependent on German economy. However recent developments have brought a change, especially since winter ski resorts such as Arlberg or Kitzbühel are now more and more frequented by Eastern Europeans, Russians and Americans.
Health care services
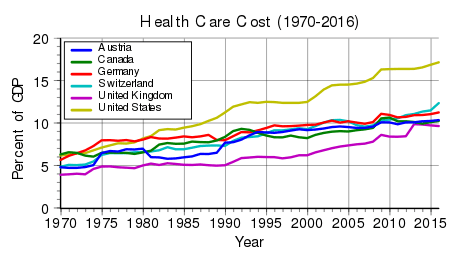
Austria's health care system was developed alongside other social welfare programmes by the social democrats in Vienna initially.[25]
Trade position
Trade with other EU countries accounts for almost 66% of Austrian imports and exports. Expanding trade and investment in the emerging markets of central and eastern Europe is a major element of Austrian economic activity. Trade with these countries accounts for almost 14% of Austrian imports and exports, and Austrian firms have sizable investments in and continue to move labour-intensive, low-tech production to these countries. Although the big investment boom has waned, Austria still has the potential to attract EU firms seeking convenient access to these developing markets.
Mergers and acquisitions
Companies and investors from Austria are active in mergers and acquisitions (M&A). Since 1991, more than 7,183 mergers & acquisitions transactions have been announced with a known total value of 261.6 bil. EUR. In 2017, over 245 deals with a total value of over 12.9 bil. EUR have taken place.[26] They are not only active in national deals, but also as important investors in cross-border M&A abroad, with Germany being the most important partner. 854 German companies have been acquired by Austrian parant companies (outbound) so far.[27]
The industry with the largest M&A activity in Austria in terms of transaction value has been the financial sector, whereas the industry with the largest number of transactions has been Industrials - representing 19.2%.
Data
The following table shows the main economic indicators in 1980–2018. Inflation under 2% is in green.[28][29]
| Year | GDP (in bil. Euro) |
GDP per capita (in Euro) |
GDP growth (real) |
Inflation rate (in Percent) |
Unemployment (in Percent) |
Government debt (in % of GDP) |
|---|---|---|---|---|---|---|
| 1980 | 76.0 | 10.076 | 1.6% | n/a | ||
| 1981 | n/a | |||||
| 1982 | n/a | |||||
| 1983 | n/a | |||||
| 1984 | n/a | |||||
| 1985 | n/a | |||||
| 1986 | n/a | |||||
| 1987 | n/a | |||||
| 1988 | 57.5% | |||||
| 1989 | ||||||
| 1990 | ||||||
| 1991 | ||||||
| 1992 | ||||||
| 1993 | ||||||
| 1994 | ||||||
| 1995 | ||||||
| 1996 | ||||||
| 1997 | ||||||
| 1998 | ||||||
| 1999 | ||||||
| 2000 | ||||||
| 2001 | ||||||
| 2002 | ||||||
| 2003 | ||||||
| 2004 | ||||||
| 2005 | ||||||
| 2006 | ||||||
| 2007 | ||||||
| 2008 | ||||||
| 2009 | ||||||
| 2010 | ||||||
| 2011 | ||||||
| 2012 | ||||||
| 2013 | ||||||
| 2014 | ||||||
| 2015 | ||||||
| 2016 | ||||||
| 2017 | ||||||
| 2018 |
See also
References
- "World Economic Outlook Database, April 2019". IMF.org. International Monetary Fund. Retrieved 29 September 2019.
- "World Bank Country and Lending Groups". datahelpdesk.worldbank.org. World Bank. Retrieved 29 September 2019.
- "Population on 1 January". ec.europa.eu/eurostat. Eurostat. Retrieved 13 July 2020.
- "World Economic Outlook Database, October 2019". IMF.org. International Monetary Fund. Retrieved 16 October 2019.
- "World Economic Outlook Database, April 2020". IMF.org. International Monetary Fund. Retrieved 17 April 2020.
- "The World Factbook". CIA.gov. Central Intelligence Agency. Retrieved 25 March 2019.
- "People at risk of poverty or social exclusion". ec.europa.eu. Eurostat. Retrieved 19 June 2020.
- "Gini coefficient of equivalised disposable income - EU-SILC survey". ec.europa.eu. Eurostat. Retrieved 19 June 2020.
- "Human Development Index (HDI)". hdr.undp.org. HDRO (Human Development Report Office) United Nations Development Programme. Retrieved 11 December 2019.
- "Inequality-adjusted HDI (IHDI)". hdr.undp.org. UNDP. Retrieved 22 May 2020.
- "Labor force, total - Austria". data.worldbank.org. World Bank. Retrieved 1 November 2019.
- "Employment rate by sex, age group 20-64". ec.europa.eu/eurostat. Eurostat. Retrieved 19 June 2019.
- "Unemployment by sex and age - monthly average". appsso.eurostat.ec.europa.eu. Eurostat. Retrieved 2 July 2020.
- "Youth unemployment rate". data.oecd.org. OECD. Retrieved 3 April 2020.
- "Ease of Doing Business in Austria". Doingbusiness.org. Retrieved 21 November 2017.
- "Euro area and EU27 government deficit both at 0.6% of GDP" (PDF). ec.europa.eu/eurostat. Eurostat. Retrieved 28 April 2020.
- "Scope affirms Austria's long-term credit rating at AAA with Stable Outlook". Scope Ratings. Retrieved 8 March 2019.
- "Austria". International Monetary Fund. Retrieved 22 April 2009.
- Real GDP Growth – Expenditure Side, provided by the Austrian National Bank (in German)
- (in English) Regional GDP per inhabitant in the EU27 Archived 26 March 2009 at the Wayback Machine, provided by Eurostat
- (in English) Real GDP Growth3 – Expenditure Side, provided by the Austrian National Bank
- Austrian Economic Chamber (July 2018). "GDP Growth in Austria" (PDF). Retrieved 14 August 2018.
- "Austria in the EU". Austrian Embassy Washington. Retrieved 8 October 2018.
- "Trade and Industry in Austria, Exports, Tourism". austria.info. 2007. Archived from the original on 27 November 2007. Retrieved 20 December 2007.
- Austria. European Observatory on Health Care Systems
- "M&A Statistics by Countries - Institute for Mergers, Acquisitions and Alliances (IMAA)". Institute for Mergers, Acquisitions and Alliances (IMAA). Retrieved 1 March 2018.
- "Mergers & Acquisitions in Austria". Institute for Mergers, Acquisitions and Alliances (IMAA). Retrieved 1 March 2018.
- "Report for Selected Countries and Subjects". Retrieved 1 September 2018.
- "Report for Selected Countries and Subjects". www.imf.org. Retrieved 12 April 2019.
External links
- ATX-INDEX VIENNA (%5EATX)
- Article by Nicholas Vardy, Global Investment Expert, on Austria's Economic Growth into 2006
- Comprehensive current and historical economic data
- World Bank Summary Trade Statistics Austria
- Tariffs applied by Austria as provided by ITC's Market Access Map, an online database of customs tariffs and market requirements

| Members | ||
|---|---|---|
| Past members | ||
Future enlargement of the European Union | ||