Economy of Egypt
The economy of Egypt was a highly centralized economy focused on import substitution under president Gamal Abdel Nasser ( 1954-1970 ). In the 1990s, a series of International Monetary Fund arrangements, coupled with massive external debt relief resulting from Egypt's participation in the Gulf War coalition, helped Egypt improve its macroeconomic performance.
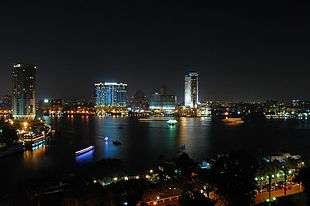 Cairo, the financial centre of Egypt | |
| Currency | Egyptian pound (EGP, E£) |
|---|---|
| 1 July – 30 June | |
Trade organisations | WTO, AU, AfCFTA, CAEU and COMESA |
Country group |
|
| Statistics | |
| Population | |
| GDP | |
| GDP rank | |
GDP growth |
|
GDP per capita | |
GDP per capita rank | |
GDP by sector |
|
| 5.9% (2020 est.)[5] | |
Population below poverty line | |
| 31.8 medium (2015, World Bank)[10] | |
Labour force | |
Labour force by occupation |
|
| Unemployment | |
Main industries | textiles, food processing, tourism, chemicals, pharmaceuticals, hydrocarbons, construction, cement, metals, light manufactures |
| External | |
| Exports | |
Export goods | crude oil and petroleum products, cotton, textiles, metal products, chemicals, agricultural goods |
Main export partners |
|
| Imports | |
Import goods | machinery and equipment, foodstuffs, chemicals, wood products, fuels |
Main import partners |
|
FDI stock | |
| Public finances | |
| −8.6% (of GDP) (2019 est.)[8] | |
| Revenues | $58 billion (2018 est.)[21][22] |
| Expenses | $95.8 billion (2019 est.)[21][22] |
Foreign reserves | $38 billion (June 2020)[24] |
Since 2000, the pace of structural reforms, including fiscal, monetary policies, taxation, privatisation and new business legislations, helped Egypt move towards a more market-oriented economy and prompted increased foreign investment. The reforms and policies have strengthened macroeconomic annual growth results which averaged 8% annually between 2004 and 2009 but the government largely failed to equitably share the wealth and the benefits of growth have failed to trickle down to improve economic conditions for the broader population, especially with the growing problem of unemployment and underemployment.
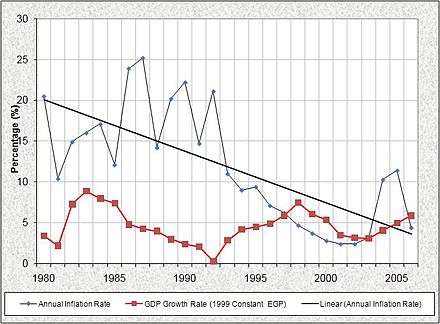
Macroeconomic trend
Egypt in the past and today has a rather stable mixed economy with average growth, averaging 3–5% in the past quarter century. The economy embarked on various stages of development during which the public and private sectors played roles varying in relative importance as follows:
- Import Substitution and Nationalization (1952–1966): during which the first programme of industrialization in 1957 was established and led by the public sector in heavy industries such as iron and steel, chemical industries, and heavy machinery. Nationalization reduced the relative importance of the private sector. There was no stock trading to speak of, all banks and financial institutions were under the public sector, and foreign direct investment was almost banned.
- Inter-War (1967–1973): adversely affected the performance of the economy and public sector role in import substitution.
- Openness Euphoria (1974–1985): during which policies were introduced to encourage Arab and foreign investment through a series of incentives and liberalizing trade and payment; heavy emphasis was put on developing the tourism and textile manufacturing industry as drivers of growth, the economy expanded but this proved unsustainable and growth consequently scaled Back.
- External Debt Crisis (1985–1990): the external debt crisis and Paris Club rescheduling and debt reduction.
- Economic Reform (1991–2007): reform policies were introduced to meet the terms of international institutions, lenders and donors, including wider incentives to the role of the private sector in all economic activities.
- The Post Global Financial Crisis (2008–2011): soaring food prices, especially for grains, led to calls for the government to provide more immediate assistance to the population of more than 40% in the "poverty tunnel" and to strike a "new deal" on agriculture policy and reform. Egypt faced the long-term supply- and demand-side repercussions of the global financial crisis on the national economy.
- Post-Revolution (2012–2016): the Egyptian economy suffered from a severe downturn following the 2011 revolution and the government faced numerous challenges to restore growth, market and investor confidence.[25] Egypt's foreign exchange reserves fell from $36 billion in December 2010 to only $16.3 billion in January 2012 as a result of propping up the Egyptian pound against the dollar. Concerns about social unrest and the country's ability to meet its financial targets provoked rating agencies to lower the country's credit rating on several occasions.[26] In 2016 Egypt floated its currency and embarked on a homegrown economic reform program supported by a $12 billion IMF loan in a bid to restore macroeconomic stability and growth.[27] By early, 2019, Egypt had received 10 of the 12 billion requested.[28]
Reform era
Under comprehensive economic reforms initiated in 1991, Egypt has relaxed many price controls, reduced subsidies, reduced inflation, cut taxes, and partially liberalized trade and investment. Manufacturing had become less dominated by the public sector, especially in heavy industries. A process of public sector reform and privatization has begun to enhance opportunities for the private sector.
Agriculture, mainly in private hands, has been largely deregulated, with the exception of cotton and sugar production. Construction, non-financial services, and domestic wholesale and retail trades are largely private. This has promoted a steady increase of GDP and the annual growth rate. The Government of Egypt tamed inflation bringing it down from double-digit to a single digit. Currently, GDP is rising smartly by 7% per annum due to successful diversification.
Gross domestic product (GDP) per capita based on purchasing-power-parity (PPP) increased fourfold between 1981 and 2006, from US$1355 in 1981, to US$2525 in 1991, to US$3686 in 2001 and to an estimated US$4535 in 2006. Based on national currency, GDP per capita at constant 1999 prices increased from EGP 411 in 1981, to EGP 2098 in 1991, to EGP 5493 in 2001 and to EGP 8708 in 2006.[29]
Based on the current US$ prices, GDP per capita increased from US$587 in 1981, to US$869 in 1991, to US$1461 in 2001 and to an estimated US$1518 (which translates to less than US$130 per month) in 2006. According to the World Bank Country Classification, Egypt has been promoted from the low income category to lower middle income category. As of 2013, the average weekly salaries in Egypt reached LE641 (approx. $92), which grew by 20% from the previous year.[29]
| Indicator[30] | 1980 | 1990 | 2000 | 2005 | 2010 | 2017 |
| GDP per capita at constant prices, (EGP) | 9,548.57 | 12,507.81 | 15,437.06 | 16,680.25 | 20,226.91 | 21,079.11 |
| GDP per capita at current prices, (EGP) | 406.03 | 1,967.41 | 5,607.67 | 8,003.33 | 16,115.11 | 36,603.38 |
| GDP per capita at current prices, (US$) | 580.04 | 1,870.85 | 1,642.63 | 1,330.46 | 2,921.76 | 2,495.02 |
| GDP (PPP) per capita, (US$) | 2,252.47 | 4,444.05 | 6,725.83 | 8,137.14 | 10,848.16 | 12,697.64 |
The reform programme is a work in progress. Noteworthy that the reform record has substantially improved since Nazif government came to power. Egypt has made substantial progress in developing its legal, tax and investment infrastructure.[31] Indeed, over the past five years, Egypt has passed, amended and admitted over 15 legislative pieces. The economy is expected to grow by about 4% to 6% in 2009/2010.
Surging domestic inflationary pressures from both economic growth and elevated international food prices led the Central Bank of Egypt to increase the overnight lending and deposit rates in sequential moves since February 2008. The rates stood at 11.5% and 13.5%, respectively, since 18 September 2008.
The rise of the World Global Financial Crisis led to a set of fiscal-monetary policy measures to face its repercussions on the national economy, including reducing the overnight lending and deposit rates by 1% on 12 February 2009. The rates currently stand at 10.5% and 12.5%, respectively.[32]
Reform of energy and food subsidies, privatization of the state-owned Bank of Cairo, and inflation targeting are perhaps the most controversial economic issues in 2007/2008 and 2008/2009.
External trade and remittances
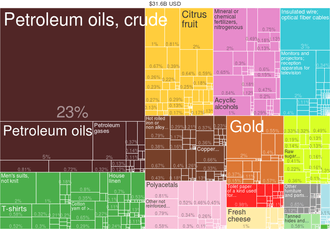
Egypt's trade balance marked US$10.36 billion in FY2005 compared to US$7.5 billion. Egypt's main exports consist of natural gas, and non-petroleum products such as ready-made clothes, cotton textiles, medical and petrochemical products, citrus fruits, rice and dried onion, and more recently cement, steel, and ceramics.
Egypt's main imports consist of pharmaceuticals and non-petroleum products such as wheat, maize, cars and car spare parts. The current account grew from 0.7% of GDP in FY2002 to 3.3% at FY2005. Egypt's Current Account made a surplus of US$4478 million in FY2005 compared to a deficit of US$158 million in FY2004. Italy and the USA are the top export markets for Egyptian goods and services. In the Arab world, Egypt has the largest non-oil GDP as of 2018.
According to the International Organization for Migration, an estimated 2.7 million Egyptians abroad contribute actively to the development of their country through remittance inflows, circulation of human and social capital, as well as investment. In 2009 Egypt was the biggest recipient of remittances in the Middle East; an estimated US$7.8 bn was received in 2009, representing approximately 5% of national GDP, with a decline of 10% from 2008, due mostly to the effect of the financial crisis. According to data from Egypt's Central Bank, the United States was the top sending country of remittances (23%), followed by Kuwait (15%), the United Arab Emirates (14%) and Saudi Arabia (9%).[33]
Public finances
On the revenues side, total revenues of the government were EGP 89.1 billion in FY2002 and are projected to reach EGP184.7 bn in FY2008. Much of the increase came from a rise in customs, excise and tax revenues, particularly personal income and sales, entertainment, and vice taxes which constituted the bulk of total domestic taxes, due to recent tax reforms. This trend is likely to gradually widen the tax base in the forthcoming years. Revenues, however, have remained more or less constant (about 21% ) as a percentage of the GDP over the past few years.
On the expenditures side, strong expenditure growth has remained a main feature of the budget. This is mainly a result of continued strong expansion of (1) the public-sector wages driven by government pledges. Wages and Compensations increased from EGP30.5 bn in FY2002 to EGP59.6 bn in FY2008; (2) high interest payments on the public debt stock. Interest payments rose from EGP21.8 bn in FY2002 to EGP52.0 bn in FY2008. Importantly, dramatic increase in domestic debt which is projected to be roughly 62% of GDP in FY2008 up from 58.4% in FY2002; and (3) the costs of food and energy subsidies, which rose from EGP18.0 bn in FY2002 to EGP64.5 bn in FY2008.
The overall deficit, after adjusting for net acquisition of financial assets, remains almost unchanged from the cash deficit. The budget's overall deficit of EGP 43.8 bn or −10.2% of GDP for FY2002 has become 49.2 bn in FY2007, so that is narrowed to −6.7% of GDP. Deficit is financed largely by domestic borrowing and revenue from divestment sales, which became a standard accounting practice in budget Egypt. The government aims at more sales of State assets in FY2008.
Recently, the fiscal conduct of the government was under strong criticism and heated debate and discussions in the Egyptian Parliament. The reference was made to weak governance and management, loose implementation of tax collection procedures and penalties for offenders, and improper accounting of the overall system of basic subsidies and domestic debt, leading to domestic market disruptions, high inflation, increased inefficiencies and waste in the domestic economy.[lower-alpha 1]
| Item[34] | 2002 | 2003 | 2004 | 2005 | 2006 | 2007 | 2008 | 2009 | 2010 | 2011 | 2012 | 2013 | 2014 | 2015 |
|---|---|---|---|---|---|---|---|---|---|---|---|---|---|---|
| Revenues | 78,318 | 89,146 | 101,878 | 110,864 | 151,266 | 172,153 | 184,729 | 275,700 | 224,986 | 303,622 | 350,322 | 456,788 | 548,632 | 622,000 |
| ... Taxes | 50,801 | 55,736 | 67,157 | 75,759 | 97,779 | 108,609 | 120,075 | 166,500 | 145,544 | 207,410 | 251,119 | 260,289 | 364,290 | |
| ... Grants | 4,264 | 3,289 | 5049 | 2,853 | 2,379 | 3,657 | 3,166 | 4,600 | 7,700 | 10.104 | 5,208 | 95,856 | 23,492 | 2,208 |
| ... Other resources | 93,288 | 70,927 | 86,108 | 93,996 | 100,642 | 160,850 | ||||||||
| Expenditures | 115,541 | 127,319 | 145,987 | 161,611 | 207,811 | 212,104 | 241,552 | 340,370 | 319,137 | 470,992 | 583,789 | 692,421 | 789,431 | 864,000 |
| ... Wages and Compensations | 30,515 | 33,816 | 37,265 | 41,546 | 46,719 | 51,270 | 59,574 | 82,000 | 86,100 | 122,818 | 142,629 | 178,589 | 207,243 | 218,108 |
| ... Interest | 21,751 | 25,851 | 30,703 | 32,780 | 36,815 | 50,448 | 51,979 | 52,900 | 71,066 | 104,441 | 146,995 | 173,150 | 199,011 | 244,044 |
| ... Subsidies and Social Benefits | 18,050 | 20,649 | 24,751 | 29,706 | 68,897 | 51,844 | 64,465 | 133,600 | 73,400 | 150,193 | 182,383 | 212,540 | 223,000 | 227,000 |
| Cash Deficit | −37,223 | −38,173 | −44,109 | −50,747 | −56,545 | −39,951 | −56,823 | −64,670 | −94,151 | −167,370 | −190,309 | −195,276 | −240,799 | −242,287 |
| Net Acquisition of Financial Assets | −1,261 | −5,586 | −1,951 | −896 | 6,160 | −9,209 | −1,946 | −2,674 | 730 | 665 | 5,314 | 2,218 | ||
| Overall Deficit | −38,485 | −43,759 | −46,060 | −51,643 | −50,385 | −49,160 | −58,769 | −67,344 | −93,421 | −166,705 | −184,995 | −197,494 | −239,972 | −251,093 |
| ... Net Borrowing | 38,066 | 43,720 | 46,043 | 50,631 | 50,259 | 48,660 | 57,769 | 66,792 | 94,880 | 166,705 | 184,705 | 197,244 | 269,000 | |
| ... Proceeds from Privatization | 418.8 | 39.2 | 17 | 1012 | 126.0 | 500 | 1000 | 10,000 | 500 | 500 | ||||
| Deficit as % of GDP | −10.2% | −10.5% | −9.5% | −9.6% | −8.2% | −6.7% | −6.9% | −6.4% | −7.97% | −10.6% | −10.7% | −9.6% | −9.9% | −8.6% |
Treasury bonds and notes issued to the Central Bank of Egypt constitute the bulk of the government domestic debt. Since FY2001, net government domestic debt (i.e. after excluding budget sector deposits) has been rising at a fluctuating but increasing rate. In 2014, it reached 77% up from 54.3% of GDP in 2001.
| Item[34][35] | 2001 | 2002 | 2003 | 2004 | 2005 | 2006 | 2007 | 2008 | 2009 | 2010 | 2011 | 2012 | 2013 | 2014 |
| Government domestic debt (EGP bn) | 194 | 221 | 252 | 292 | 349 | 387 | 478 | 562 | 663 | 808 | 990 | 1,113 | 1,410 | 1, 648 |
| Net Government domestic debt (% GDP) | 54.3% | 58.4% | 60.4% | 60.3% | 64.8% | 62.8% | 65.4% | 54.1% | 55.0% | 55.0% | 58.9% | 62.9% | 71.9% | 77.0% |
Opportunity cost of conflict
A report[36] by Strategic Foresight Group has calculated the opportunity cost of conflict for Egypt since 1991 is almost $800 billion. In other words, had there been peace since 1991, an average Egyptian citizen would be earning over $3000 instead of $1700 he or she may earn next year.
The financial sector
The Central Bank of Egypt is the national reserve bank and controls and regulates the financial market and the Egyptian pound. There is a State regulatory authority for the Cairo Stock Exchange. State-owned or Nationalized banks still account for 85% of bank accounts in Egypt and around 60% of the total savings. The penetration of banking is low in rural areas at only 57% of households.
Monetary policy
Up until 2007, there have been several favorable conditions that allowed the Central Bank of Egypt to accumulate net international reserves, which increased from US$20 billion in FY2005, to US$23 billion in FY2006, and to US$30 billion FY2007 contributing to growth in both reserve money and in broad money (M2). This declined to US$16.4 billion in Oct 2015, according to the Central Bank of Egypt.
Credit extended to the private sector in Egypt declined significantly reaching about EGP 5 billion in FY2005. This credit crunch is due to the non-performing loans extended by the banks to business tycoons and top government officials.
Lending criteria have been tightened following the passing of Money Laundry Law 80 in 2002 and Banking Law 88 in 2003. Interest rates are no longer the dominant factor in banks' lending decisions. In fact, both the inefficiency and absence of the role of the Central Bank of Egypt in qualitative and quantitative control as well as implementing banking procedures and standards was almost entirely responsible for the non-performing loans crisis. Banks steadily reduced credit from its peak of about EGP 30 billion in FY1999 and alternatively invested in more liquid no-risk securities such as treasury bills and government bonds. Improving private sector access to credit will critically depend on resolving the problem of non-performing loans with businesses and top government officials.
The era of inflation targeting—i.e. maintaining inflation within a band—has perhaps begun in Egypt more recently. Country experiences show that inflation targeting is a best-practice strategy for monetary policy. While the monetary policy appears more responsive to inflationary pressures recently in Egypt, it is noted that there is no core inflation measure and the Central Bank of Egypt takes targeting decisions based on the inflation rate released by the CAPMAS consumer price index off-the-shelf.[37]
.jpg)
Surging domestic inflationary pressures from both economic growth and elevated international food prices led the Central Bank of Egypt (CBE) to increase the overnight lending and deposit rates in sequential moves since 2008: it was raised by 0.25% on 10 February 2008, by 0.5% on 25 March 2008, by 0.5% on 8 May 2008, by 0.5% on 26 June 2008, by 0.5% on 7 August 2008 and most recently on 18 September 2008 for the sixth time in a year by 0.5% when it stood at 11.5% and 13.5%, respectively.
The rise of the World Global Financial Crisis led to a set of fiscal-monetary policy measures to face its repercussions on the national economy, including reducing the overnight lending and deposit rates by 1% on 12 February 2009. The rates currently stand at 10.5% and 12.5%, respectively. The CBE is expected to further cut on interest rates over 2009, with seemingly little fear on Egyptian Pound depreciation resulting from decreased interest rates.
Exchange rate policy
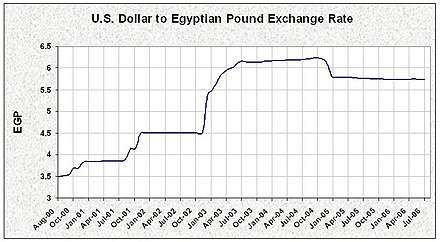
The exchange rate has been linked to the US dollar since the 1950s. Several regimes were adopted including initially the conventional peg in the sixties, regular crawling peg in the seventies and the eighties and crawling bands in the nineties. Over that time period, there were several exchange rate markets including black market, parallel market and the official market. With the turn of the new millennium, Egypt introduced a managed float regime and successfully unified the Pound exchange rate vis-à-vis foreign currencies.
The transition to the unified exchange rate regime was completed in December 2004. Shortly later, Egypt has notified the International Monetary Fund (IMF) that it has accepted the obligations of Article VIII, Section 2, 3, and 4 of the IMF Articles of Agreement, with effect from 2 January 2005. IMF members accepting the obligations of Article VIII undertake to refrain from imposing restrictions on the making of payments and transfers for current international transactions, or from engaging in discriminatory currency arrangements or multiple currency practices, except with IMF approval.
By accepting the obligations of Article VIII, Egypt gives assurance to the international community that it will pursue economic policies that will not impose restrictions on the making of payments and transfers for current international transactions unnecessary, and will contribute to a multilateral payments system free of restrictions.
In the fiscal year 2004 and over most of the fiscal year 2005, the pound depreciated against the US dollar. Since the second half of the fiscal year 2006 until the end of the fiscal year 2007, the pound gradually appreciated to EGP 5.69 per USD. While it was likely to continue appreciating in the short-term, given the skyrocketing oil prices and the weakening US economy, the advent of the global economic crisis of 2008, and resulting behavior of foreign investors exiting from the stock market in Egypt increased the dollar exchange rate against the Egyptian pound, which rose by more than 4% since Lehman Brothers declared bankruptcy. As the demand pressure from exiting foreign investors eases, the dollar exchange rate against the Egyptian pound is expected to decline. It stands at EGP 7.00 per USD as of 18 June 2013. Due to the rising power of the US dollar, as of January 2015 one dollar equals 7.83 Egyptian pounds.
On 3 November 2016, the Egyptian government announced that it would float the Egyptian pound in an effort to revive its economy, which had been suffering since 2011.[38]
Natural resources
Land, agriculture and crops
Warm weather and plentiful water have in the past produced several crops a year. However, since 2009 increasing desertification has become a problem. "Egypt loses an estimated 11,736 hectares of agricultural land every year, making the nation's 3.1 million hectares of agricultural land prone "to total destruction in the foreseeable future", said Abdel Rahman Attia, a professor of agriculture at Cairo University, to IRIN.[39] Scarcity of clean water is also a problem.[40]

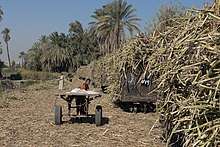
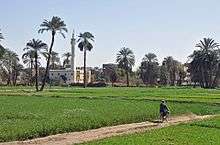
Cotton, rice, wheat, corn, sugarcane, sugar beets, onions, tobacco, and beans are the principal crops. Land is worked intensively and yields are high. Increasingly, a few modern techniques are applied to producing fruits, vegetables and flowers, in addition to cotton, for export. Further improvement is possible. The most common traditional farms occupy 0.40 hectares (1 acre) each, typically in a canal-irrigated area along the banks of the Nile. Many small farmers also own cows, water buffalos, and chickens. Between 1953 and 1971, some farms were collectivised, especially in Upper Egypt and parts of the Nile Delta.
Several researchers questioned the domestic (and import) policies for dealing with the so-called the "wheat game" since the former Minister of Agriculture Yousef Wali was in office ( 1982-2004 ).
In 2006, areas planted with wheat in Egypt exceeded 160,000 hectares (400,000 acres) producing approximately 6 million metric tons.[41] The domestic supply price farmers receive in Egypt is EGP 1200 ( US$211) per ton compared to approximately EGP 1940 ( US$340) per ton for import from the US, Egypt's main supplier of wheat and corn. Egypt is the U.S.'s largest market for wheat and corn sales, accounting for US$1 billion annually and about 46% of Egypt's needs from imported wheat. Other sources of imported wheat, include Kazakhstan, Canada, France, Syria, Argentina and Australia. There are plans to increase the areas planted with wheat up to nearly 1,200,000 hectares (3×10⁶ acres) by 2017 to narrow the gap between domestic food supply and demand.[42] However, the low amount of gluten in Egypt wheat means that foreign wheat must be mixed in to produce bread that people will want to eat.[43]

Egypt would be the first ever electronic Egyptian Commodities Exchange in the MENA region to facilitate the well being of its small farmers and supply of products at reasonable prices abolishing the monopoly of goods.[44][45]
| Item[46] | 2002 | 2003 | 2004 | 2005 | 2006 | 2007 | 2008 | 2009 | 2010 | 2011 | 2012 | 2013 | 2014 | 2015 |
| Wheat | ||||||||||||||
| Production | 6,130 | 6,300 | 6,443 | 7,177 | 8,184 | 8,200 | 7,977 | 8,523 | 7,200 | 8,400 | 8,500 | 8,700 | 8,300 | 8,300 |
| Imports | 6,944 | 6,327 | 7,295 | 8,150 | 7,700 | 7,000 | 9,900 | 10,500 | 10,600 | 11,650 | 8,300 | 10,170 | 11,063 | 11,500 |
| Imports from US | 3,547 | 860 | 3,985 | 1,765 | 1,181 | 1,300 | 1,636 | 366 | 3,866 | 989 | 0 | 0 | 120 | |
| Total Consumption | 12,750 | 12,800 | 13,300 | 14,200 | 14,800 | 15,600 | 17,200 | 18,100 | 17,700 | 18,600 | 18,400 | 17,700 | 19,100 | 19,600 |
| Corn | ||||||||||||||
| Production | 6,160 | 6,000 | 5,740 | 5,840 | 5,860 | 5,870 | 6,645 | 6,280 | 6,500 | 5,500 | 5,800 | 6,100 | ||
| Imports | 4,905 | 4,848 | 3,743 | 5,398 | 4,300 | 4,800 | 5,031 | 5,800 | 5,800 | 7,100 | 4,500 | 4,400 | ||
| Imports from US | 4,283 | 2,904 | 3,120 | 3,738 | 3,927 | 4,200 | 2,445 | 2,900 | 2,900 | 298 | 0 | 0 | ||
| Total Consumption | 11,200 | 10,900 | 9,200 | 11,300 | 10,300 | 10,600 | 11,100 | 12,000 | 12,500 | 11,700 | 11,200 | 10,900 | ||
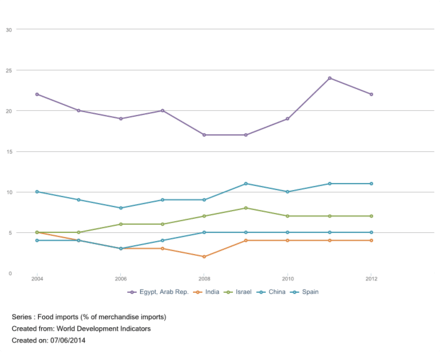
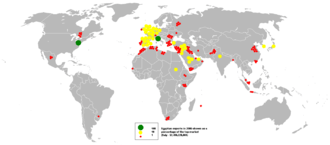
Food imports to Egypt compared to other countries
The Western Desert accounts for about two-thirds of the country's land area. For the most part, it is a massive sandy plateau marked by seven major depressions. One of these, Fayoum, was connected about 3,600 years ago to the Nile by canals. Today, it is an important irrigated agricultural area.
Practically all Egyptian agriculture takes place in some 25,000 km2 (6 million acres) of fertile soil in the Nile Valley and Delta.
Some desert lands are being developed for agriculture, including the controversial but ambitious Toshka project in Upper Egypt, but some other fertile lands in the Nile Valley and Delta are being lost to urbanization and erosion. Larger modern farms are becoming more important in the desert.
The agriculture objectives on the desert lands are often questioned; the desert farm lands which were offered regularly at different levels and prices were restricted to a limited group of elites selected very carefully, who later profiteered retailing the granted large desert farm land by pieces. This allegedly transforms the desert farms to tourist resorts, hits all government plans to develop and improve the conditions of the poor, and causes serious negative impact on agriculture and the overall national economy over time. One company, for example, bought over 70 hectares of large desert farm for a price as low as EGP 0.05 per square meter and now sells for EGP 300 per square meter. In numbers, 70 hectares bought for about US$6,000 in 2000 sells for over US$3.7 million in 2007. Currently, no clear solution exists to deal with these activities.
Agriculture biomass, including agricultural wastes and animal manure, produce approximately 30 million metric tons of dry material per year that could be massively and decisively used, inter alia, for generating bioenergy and improve the quality of life in rural Egypt. Despite plans of establishing waste-to-energy plants, this resource remains terribly underused.[lower-alpha 2]
Since early 2008, with the world food prices soaring, especially for grains, calls for striking a "new deal" on agriculture increased. Indeed, 2008 arguably marks the birth of a new national agriculture policy and reform.[48]
Acquisition and ownership of desert land in Egypt is governed by so-called "Egyptian Desert Land Law". It defines desert land as the land two kilometers outside the border of the city. Foreign partners and shareholders may be involved in ownership of the desert land, provided Egyptians own at least 51% of the capital.
Water resources
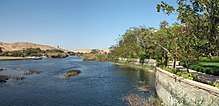
"Egypt", wrote the Greek historian Herodotus 25 centuries ago, "is the gift of the Nile." The land's seemingly inexhaustible resources of water and soil carried by this mighty river created in the Nile Valley and Delta the world's most extensive oasis. Without the Nile, Egypt would be little more than a desert wasteland.
The river carves a narrow, cultivated floodplain, never more than 20 kilometers wide, as it travels northward toward Cairo from Lake Nasser on the Sudanese border, behind the Aswan High Dam. Just north of Cairo, the Nile spreads out over what was once a broad estuary that has been filled by riverine deposits to form a fertile delta about 250 kilometers (160 mi) wide at the seaward base and about 160 kilometers (99 mi) from south to north.
Before the construction of dams on the Nile, particularly the Aswan High Dam (started in 1960, completed in 1970), the fertility of the Nile Valley was sustained by the water flow and the silt deposited by the annual flood. Sediment is now obstructed by the Aswan High Dam and retained in Lake Nasser. The interruption of yearly, natural fertilization and the increasing salinity of the soil has been a manageable problem resulting from the dam. The benefits remain impressive: more intensive farming on thousands of square kilometers of land made possible by improved irrigation, prevention of flood damage, and the generation of millions of gigajoules of electricity at low cost.
Groundwater
The rain falling on the coast of the southern regions are the main source of recharge of the main reservoir. There is a free-floating layer of the reservoir water on top of sea water up to a distance of 20 km south of the Mediterranean Sea. The majority of wells in the coastal plain depend on the water level in the main reservoir. The coastal water supply comes from water percolating through the coastal sand and water runoff from the south. This low salinity water is used for many purposes.
Mineral and energy resources
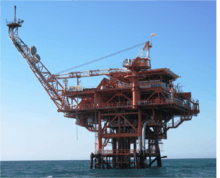
Egypt's mineral and energy resources include petroleum, natural gas, phosphates, gold and iron ore. Crude oil is found primarily in the Gulf of Suez and in the Western Desert. Natural gas is found mainly in the Nile Delta, off the Mediterranean shore, and in the Western Desert. Oil and gas accounted for approximately 7% of GDP in fiscal year 2000/01.
Export of petroleum and related products amounted to $2.6 billion in the year 2000. In late 2001, Egypt's benchmark "Suez Blend" was about $16.73 per barrel ($105/m³), the lowest price since 1999.
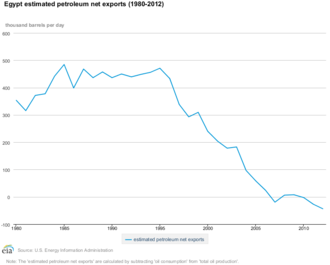
Crude oil production has been in decline for several years since its peak level in 1993, from 941,000 bbl/d (149,600 m3/d) in 1993 to 873,000 bbl/d (138,800 m3/d) in 1997 and to 696,000 bbl/d (110,700 m3/d) in 2005. (See Figure). At the same time, the domestic consumption of oil increased steadily (531,000 bbl/d (84,400 m3/d) and 525,000 bbl/d (83,500 m3/d) in 1997 and 2005 respectively), but in 2008, oil consumption reached to 697,000 bbl/d (110,800 m3/d). It is easy to see from the graph that a linear trend projects that domestic demand outpaced supply in (2008–2009), turning Egypt to a net importer of oil. To minimize this potential, the government of Egypt has been encouraging the exploration, production and domestic consumption of natural gas. Oil Production was 630 bbl/d (100 m3/d) in 2008, and natural gas output continued to increase and reached 48.3 billion cubic meters in 2008.[49]
Domestic resources meet only about 33% of Egypt's domestic demand, meaning large imports from Saudi Arabia, UAE and Iraq are necessary.
Over the last 15 years, more than 180 petroleum exploration agreements have been signed and multinational oil companies spent more than $27 billion in exploration companions. These activities led to the findings of about 18 crude oil fields and 16 natural gas fields in FY 2001. The total number of findings rose to 49 in FY 2005. As a result of these findings, crude oil reserves as of 2009 are estimated at 3.7 billion barrels (590,000,000 m3), and proven natural gas reserves are 1.656 trillion cubic meters with likely additional discoveries with more exploration campaigns.
In August 2007, it was announced that signs of oil reserves in Kom Ombo basin, about 28 miles (45 km) north of Aswan, was found and a concession agreement was signed with Centorion Energy International for drilling. The main natural gas producer in Egypt is the International Egyptian Oilfield Company (IEOC), a branch of Italian Eni. Other companies like BP, BG, Texas-based Apache Corp. and Shell carry out activities of exploration and production by means of concessions granted for a period of generally ample time (often 20 years) and in different geographic zones of oil and gas deposits in the country.
Gold mining is more recently a fast-growing industry with vast untapped gold reserves in the Eastern Desert. To develop this nascent sector the Egyptian government took a first step by awarding mineral concessions, in what was considered the first international bid round. Two miners who have produced encouraging technical results include AngloGold Ashanti and Alexander Nubia International.[51][52]
Gold production facilities are now reality from the Sukari Hills, located close to Marsa Alam in the Eastern Desert. The concession of the mine was granted to Centamin, an Australian joint stock company, with a gold exploitation lease for a 160-square-kilometer area. Sami El-Raghy, Centamin chairman, has repeatedly stated that he believes Egypt's yearly revenues from gold in the future could exceed the total revenues from the Suez Canal, tourism and the petroleum industry.[53]
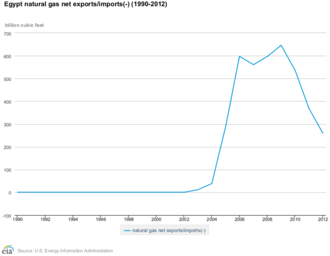
The Ministry of Petroleum and Mineral Resources has established expanding the Egyptian petrochemical industry and increasing exports of natural gas as its most significant strategic objectives and in 2009 about 38% of local gas production was exported.
As of 2009, most Egyptian gas exports (approximately 70%) are delivered in the form of liquefied natural gas (LNG) by ship to Europe and the United States. Egypt and Jordan agreed to construct the Arab Gas Pipeline from Al Arish to Aqaba to export natural gas to Jordan; with its completion in July 2003, Egypt began to export 1.1 billion cubic feet (31,000,000 m3) of gas per year via pipeline as well. Total investment in this project is about $220 million. In 2003, Egypt, Jordan and Syria reached an agreement to extend this pipeline to Syria, which paves the way for a future connection with Turkey, Lebanon and Cyprus by 2010. As of 2009, Egypt began to export to Syria 32.9 billion cubic feet (930,000,000 m3) of gas per year, accounting for 20% of total consumption in Syria.[54]
In addition, the East Mediterranean Gas (EMG), a joint company established in 2000 and owned by Egyptian General Petroleum Corporation (EGPC) (68.4%), the private Israeli company Merhav (25%) as well as Ampal-American Israel Corp. (6.6%), has been granted the rights to export natural gas from Egypt to Israel and other locations in the region via underwater pipelines from Al 'Arish to Ashkelon which will provide Israel Electric Corporation (IEC) 170 million cubic feet (4.8×10⁶ m3) of gas per day. Gas supply started experimentally in the second half of 2007. As of 2008, Egypt produces about 6.3 billion cubic feet (180×106 m3), from which Israel imports of 170 million cubic feet (4.8×10⁶ m3) account for about 2.7% of Egypt's total production of natural gas. According to a statement released on 24 March 2008, Merhav and Ampal's director, Nimrod Novik, said that the natural gas pipeline from Egypt to Israel can carry up to 9 billion cubic meters annually which sufficiently meet rising demand in Israel in the coming years.[55]
According to a memorandum of understanding, the commitment of Egypt is 680 million cubic feet (19×106 m3) contracted for 15 years at a price below $3 per million of British thermal unit, though this was renegotiated at a higher price in 2009 (to between $4 and $5 per million BTU), while the amounts of gas supplied were increased. Exporting natural gas to Israel faces broad popular opposition in Egypt.[56]
Agreements between Egypt and Israel allow for Israeli entities to purchase up to 7 billion cubic meters of Egyptian gas annually, making Israel one of Egypt's largest natural gas export markets. The decision to export of natural gas to Israel was passed in 1993 at the time when Dr. Hamdy Al-Bambi was Minister of Petroleum and when Mr. Amr Moussa was Minister of Foreign Affairs. The mandate to sign of the Memorandum of Understanding (MoU) to delegate to the Ministry of Petroleum represented by the Egyptian General Petroleum Company (EGPC) to contract with EMG Company was approved by the former Prime Minister Dr. Atef Ebeid in the Cabinet's meeting No. 68 on 5 July 2004 when he served as the acting "President of the Republic" when President Hosni Mubarak was receiving medical treatment in Germany.
A new report by Strategic Foresight Group on the Cost of Conflict in the Middle East[36] also details how in the event of peace an oil and gas pipeline from Port Said to Gaza to Lebanon would result in a transaction value for Egypt to the tune of $1–2 billion per year.
As of June 2009, it was reported that Cairo said Israelis will dig for oil in Sinai.[57] This report comes in the time in which the government is heavily criticized for exporting natural gas to Israel at an extremely low rate.[58]
Starting in 2014, the Egyptian government has been diverting gas supplies produced at home to its domestic market, reducing the volumes available for export in liquefied form.[59] According to the memorandum of understanding, the Leviathan field off Israel's Mediterranean coast would supply 7 billion cubic meters annually for 15 years via an underwater pipeline. This equates to average volumes of 685 million cubic feet a day, the equivalent of just over 70% of the BG-operated Idku plant's daily volumes.
In March 2015, BP Signed a $12 billion deal to develop natural gas in Egypt intended for sale in the domestic market starting in 2017. [60] BP said it would develop a large quantity of offshore gas, equivalent to about one-quarter of Egypt's output, and bring it onshore to be consumed by customers. Gas from the project, called West Nile Delta, is expected to begin flowing in 2017. BP said that additional exploration might lead to a doubling of the amount of gas available.
Main economic sectors
Agricultural sector
Irrigation
Irrigation plays a major role in a country the very livelihood of which depends upon a single river, the Nile. Most ambitious of all the irrigation projects is that of the Aswan High Dam, completed in 1971. A report published in March 1975 by the National Council for Production and Economic Affairs indicated that the dam had proved successful in controlling floodwaters and ensuring recurring water supply, but that water consumption had been more than needed and shall be controlled. Some precious land was lost below the dam because the flow of Nile silt was stopped, and increased salinity remains a major problem. Furthermore, five years of drought in the Ethiopia highlands—the source of the Nile River's water—caused the water level of Lake Nasser, the Aswan High Dam's reservoir, to drop to the lowest level in 1987.
In 1996, the level of water behind the High Dam and in Lake Nasser reached the maximum level since the completion of the dam. Despite this unusual abundance of water supply, Egypt can only use 55.5 billion cu m (1.96 trillion cu ft) every year, according to the Nile Basin Agreement signed in 1959 between Egypt and Sudan. Another major project designed to address the water scarcity problem is the New Valley Project (the "second Nile"), aimed at development of the large artesian water supplies underlying the oases of the Western Desert.
In 2010 Egypt's fertile area totaled about 3.6 million hectares (8.9 million acres), about one-quarter of which has been reclaimed from the desert after the construction of the Aswan High Dam.[61] The government aims to increase this number to 4.8 million hectares by 2030 through additional land reclamation.[61] Even though only 3 percent of the land is arable, it is extremely productive and can be cropped two or even three times annually. However, the reclaimed lands only add 7 percent to the total value of agricultural production. Surface irrigation is forbidden by law in reclaimed lands and is only used in the Nile Valley and the Delta, the use of pressurized irrigation and localized irrigation is compulsory in other parts of the country.[61] Most land is cropped at least twice a year, but agricultural productivity is limited by salinity which in 2011 affected 25% of irrigated agriculture to varying degrees.[61] This is mainly caused by insufficient drainage as well as seawater intrusion in aquifers as a result of over-extraction of groundwater, the latter primarily affects the Nile Delta.[61] Thanks to the installation of drainage systems a reduction in salinized areas from about 1.2 million hectares in 1972 to 900 000 hectares in 2010 was achieved.[61]
In the 1970s, despite significant investment in land reclamation, agriculture lost its position as the leading economic sector. Agricultural exports, which were 87% of all merchandise export by value in 1960, fell to 35% in 1974 and to 11% by 2001. In 2000, agriculture accounted for 17% of the country's GDP and employed 34% of the workforce.
Crops
According to 2016 statistics from the Food and Agriculture Organization of the United Nations, Egypt is the world's largest producer of dates; the second largest producer of figs; the third largest producer of onions and eggplants; the fourth largest producer of strawberries and buffalo milk as well as the fifth largest producer of tomatoes and watermelon.
Cotton has long been a primary exported cash crop, but it is no longer vital as an export. Production in 1999 was 243,000 tons. Egypt is also a substantial producer of wheat, corn, sugarcane, fruit and vegetables, fodder,[62] and rice; substantial quantities of wheat are also imported, especially from the United States and Russia, despite increases in yield since 1970, and significant quantities of rice are exported.
Citrus, dates, and grapes are the main fruits by cultivated area. Agricultural output in tons in 1999 included corn, 9,350,000; wheat, 6,347,000; rice, 5,816,000; potatoes, 1,900,000; and oranges, 1,525,000. The government exercises a strong degree of control over agriculture, not only to ensure the best use of irrigation water but also to confine the planting of cotton in favor of food grains. However, the government's ability to achieve this objective is limited by crop rotational constraints.
Land ownership
The agrarian reform law of 1952 provided that no one might hold more than 190 feddans, that is, 79.8 hectares (197 acres) (1 Egyptian feddan=0.42 hectares=1.038 acres), for farming, and that each landholder must either farm the land himself or rent it under specified conditions. Up to 95 additional feddans might be held if the owner had children, and additional land had to be sold to the government. In 1961, the upper limit of landholding was reduced to 100 feddans, and no person was allowed to lease more than 50 feddans. Compensation to the former owners was in bonds bearing a low rate of interest, redeemable within 40 years. A law enacted in 1969 reduced landholdings by one person to 50 feddans.
By the mid-1980s, 90% of all land titles were for holdings of less than five feddans (2.1 hectares (5.2 acres)), and about 300,000 families, or 8% of the rural population, had received land under the agrarian reform program. According to a 1990 agricultural census, there were some three million small land holdings, almost 96% of which were under five feddans. As these small landholdings restricted the ability of farmers to use modern machinery and agricultural techniques that improve and take advantage of economies of scale, there have since the late 1980s been many reforms attempting to deregulate agriculture by liberalizing input and output prices and eliminating crop area controls. As a result, the gap between world and domestic prices for Egyptian agricultural commodities has been closed.
Industrial sector
Automobiles manufacturing

El Nasr Automotive Manufacturing Company is Egypt's state owned automobile company, founded in 1960 in Helwan, Egypt. Established in 1962, the company manufactures various vehicles under license from Zastava Automobili, Daimler AG, Kia, and Peugeot. Their current lineup consists of the Jeep Cherokee; the open-top, Wrangler-based Jeep AAV TJL; the Kia Spectra; the Peugeot 405; and the Peugeot 406.
Other automobile manufacturers in Egypt include Arab American Vehicles, Egy-Tech Engineering, Ghabbour Group, WAMCO (Watania Automotive Manufacturing Company) and MCV. MCV was established in 1994 to represent Mercedes-Benz in the commercial vehicle sector in Egypt, producing a range of buses and trucks for domestic sale and for export throughout the Arab World, Africa, Latin America and Eastern Europe. The manufacturing plant in El Salheya employs c. 2500 people.[63]
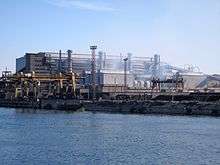
Chemicals
Abu Qir Fertilizers Company is one of the largest producers of nitrogen fertilizers in Egypt and the MENA region. It accounts for nearly 50% of all nitrogen fertilizer production in Egypt. The company was established in 1976 with the construction of its first ammonia urea production facility, located in Abu Qir, 20 kilometers east of Alexandria. Egypt Basic Industries Corporation (EBIC) is also one of the largest producers of ammonia in the country.
Consumer electronics and home appliances
Olympic Group is the largest Egyptian company in the field of domestic appliances. The company mainly manufactures washing machines, air conditioners, refrigerators, electric water heaters and gas cookers.
Bahgat Group is a leading company in the fields of electronics, home appliances, furniture and real estate. It also owns TV stations. The group is composed of the following companies: Egy Aircon, International Electronics Products, Electrical Home appliances, General Electronics and Trading, Goldi Trading, Goldi Servicing, Egy Medical, Egyptian Plastic Industry, Egy House, Egy Speakers, Egy Marble, Dreamland and Dream TV.
Steel industries
In 2018 Egypt was ranked the 21st largest steel producing country with a production of 7.8 million tons. EZDK is the largest steel company in Egypt and the Middle East, today part of Ezz Industries. It owns four steel plants in Alexandria, Sadat, Suez and 10th of Ramadan. It was ranked 87th on the list of the world's largest steel companies by the World Steel Association in 2015, with a production of 3.2 million tons.
Textiles and clothing
Textiles and clothing is one of the largest manufacturing and exporting processes in the country and a huge employment absorber. The Egyptian apparel industry is attractive for two reasons. Firstly, its proximity to European markets, whose rapidly changing fashions require quick replenishment. Egypt's geographical proximity to style-conscious Europe is a logistical advantage. Secondly, the production of garments is a low-capital and high-labor-intensive industry, and the local population of 66 million provides a ready workforce as well as a natural local consumer market that acts as a springboard for exports.[64]
The textile industry contributes with one quarter of Egypt's non-oil export proceeds, with Cotton textiles comprising the bulk of Egypt's TC export basket. The public sector accounts for 90% of cotton spinning, 60% of fabric production and 30% of apparel production in Egypt. Misr Fine Spinning and Weaving is the largest enterprise of its kind in Africa and the Middle East. The private sector apparel industry is one of the most dynamic manufacturing processes in Egypt.
The requirements of importers to Egypt of textiles and leather products were set out in the Egyptian Ministerial decrees 626/2011 and 660/2011. The Egyptian trade oversight agency, the General Organization for Export and Import Control (GOEIC), demanded in June 2012 that an inspection certificate accompany each shipment, unless the importer is pre-registered with the GOEIC. The Ministerial Decrees demand that imported goods certify their compliance with the mandatory quality and safety standards of Egypt.
Arafa Holding is a global apparel manufacturer and retailer, operating through a strong vertically integrated platform at the local & international levels.
Energy sector
On 29 October 2007, Egypt's president, Hosni Mubarak proudly gave the go-ahead for building several nuclear power plants. Egypt's nuclear route is purely peaceful and fully transparent, but faces technical and financing obstacles. Egypt is a member of the IAEA and has both signed and ratified the Nuclear Nonproliferation Treaty (NPT). Currently, a draft Law on Nuclear Energy is being reviewed by the IAEA and expected to be passed by the Egyptian Parliament. Many other countries in the region, including Libya, Jordan, UAE, Morocco, and Saudi Arabia aspire to build nuclear power plants.
Egypt and Cyprus are considering implementing the proposed EuroAfrica Interconnector project.[65][66][67][68][69] This consists of laying a 2000 MW HVDC undersea power cable between them and between Cyprus and Greece, thus connecting Egypt to the greater European power grid.[67] Interconnector will transform Egypt in electricity hub between Europe and Africa. President of Egypt Abdel Fattah el-Sisi, President of Cyprus Nicos Anastasiades and the Prime Minister of Greece Alexis Tsipras met in Nicosia on 21 November 2017 and showed their full support for the EuroAfrica Interconnector pointing out its importance for energy security of three countries.[70][71][72][73]
Construction and contracting sector
Orascom Construction Industries is a leading Egyptian EPC (engineering, procurement and construction) contractor, based in Cairo, Egypt and active in more than 20 countries. OCI was established in Egypt in 1938 and owned by Onsi Sawiris. It was nationalized in 1953 and then again de-nationalized in 1977. The company is the first multinational Egyptian corporation, and is one of the core Orascom Group companies. As a cement producer, OCI owned and operated cement plants in Egypt, Algeria, Turkey, Pakistan, northern Iraq and Spain, which had a combined annual production capacity of 21 million tons.
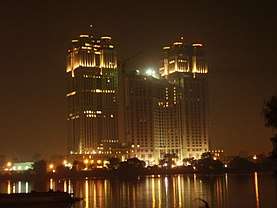
The Talaat Moustafa Group (TMG), one of the largest conglomerates in Egypt, was founded by the former Talaat Moustafa and is headed by his son, Hisham Talaat Moustafa.
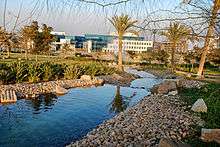
Egypt's smart new cities
The proposed new capital of Egypt is a large-scale project under construction since 2015, and was announced by then-Egyptian housing minister Moustafa Madbouly at the Egypt Economic Development Conference on 13 March 2015.
The new Alamien city is another smart city that Egypt is currently building in Egypt's north coast planned on an area of 48,000 feddans at a cost of LE 2 billion.The New Alamein city is one of the fourth generation cities being built in Egypt in some of the most up-to-date architectural styles, and is scheduled to be concluded in a year.
Services sector
Banking and insurance
The banking sector has gone through many stages since the establishment of the first bank in 1856, followed by the emergence of private sector and joint venture banks during the period of the Open Door Policy in the 1970s. Moreover, the Egyptian banking sector has been undergoing reforms, privatization, and mergers and acquisitions from 1991 up to today.
The banking system comprises 57 state-owned commercial banks. This includes 28 commercial banks, four of which are state-owned, 26 investment banks (11 joint venture banks and 15 branches of foreign banks), and three specialized banks. Although private and joint venture banks are growing, many remain relatively small with few branch networks.
Egypt's banking system has undergone major reforms since the 1990s and today consumers are faced with a liberalized and modernized system which is supervised and regulated according to internationally accepted standards. Although the mortgage market is underdeveloped in Egypt and as yet foreigners cannot yet obtain a mortgage for a property in Egypt. In the near future, a new mortgage law will enable purchasers to take out property loans. This will open up the market considerably and create a storm of development and real estate activity in the near future.
Communications
.jpg)
Egypt has long been the cultural and informational centre of the Arab world, and Cairo is the region's largest publishing and broadcasting centre.
The telecommunications liberalisation process started in 1998 and is still ongoing, but at a slow pace. Private sector companies operate in mobile telephony, and Internet access. There were 10 million fixed phone lines, 31 million mobile phones, and 8.1 million Internet users by the August 2007.
Transport

Transport in Egypt is centered around Cairo and largely follows the pattern of settlement along the Nile. The main line of the nation's 4,800-kilometer (3,000 mi) railway network runs from Alexandria to Aswan and is operated by Egyptian National Railways. The road network has expanded rapidly to over 21,000 miles (34,000 km), covering the Nile Valley and Nile Delta, Mediterranean and Red Sea coasts, the Sinai, and the Western oases.
In addition to overseas routes, Egypt Air provides reliable domestic air service to major tourist destinations from its Cairo hub. The Nile River system (about 1,600 km (990 mi).) and the principal canals (1,600 km.) are used for local transportation.
The Suez Canal is a major waterway for international commerce and navigation, linking the Mediterranean and Red Sea. It is run by the Suez Canal Authority, headquartered in Port Said. The ministry of transportation, along with other governmental bodies are responsible for transportation in Egypt. Major ports are Alexandria, Port Said, and Damietta on the Mediterranean, and Suez, Ain Sokhna and Safaga on the Red Sea.
Tourism sector
The Egyptian tourism industry is one of the most important sectors in the economy, in terms of high employment and incoming foreign currency.[74] It has many constituents of tourism, mainly historical attractions especially in Cairo, Luxor and Aswan, but also beach and other sea activities. The government actively promotes foreign tourism since it is a major source of currency and investment. The political instability since January 2011 caused a reduction in tourism,[75] but the next year it was rising.[76] In Upper Egypt, tourists that "provided one of the most important sources of income besides farming has dried out".[77]
Emerging sectors
ICT sector
The Egyptian information and communications technology sector has been growing significantly since it was separated from the transportation sector. The market for telecommunications market was officially deregulated since the beginning of 2006 according to the WTO agreement.
The government established ITIDA through Law 15 of the year 2004 as governmental entity. This agency aims at paving the way for the diffusion of the e-business services in Egypt capitalizing on different mandates of the authority as activating the Egyptian e-signature law and supporting an export-oriented IT sector in Egypt.
While the move could open the market for new entrants, add and improve the infrastructure for its network, and in general create a competitive market, the fixed line market is de facto monopolized by Telecom Egypt.
The cellular phone market was a duopoly with prices artificially high but witnessed in the past couple of years the traditional price war between the incumbents Mobinil and Vodafone. A 500 minutes outbound local and long-distance calling plan currently costs approximately US$30 as compared to approximately US$90 in 2005. While the current price is not so expensive, it is still above the international price as plans never allow "unlimited night & weekend minutes."
A third GSM 3.5G license was awarded in April 2006 for US$3 billion to a consortium led by the UAE company Eitesalat (66%), Egypt Post (20%), the National Bank of Egypt (NBE) (10%), and the NBE's Commercial International Bank (4%), thus moving the market from duopoly to oligopoly.
On 24 September 2006, the National Telecommunication Regulatory Authority (NTRA) announced a license award to Egyptian-Arab private sector consortium of companies to extend a maritime cable for international traffic. The US$120 million cable project will serve the Gulf region and south Europe. The construction of the cable should decrease the currently high international call costs and increase domestic demand on internet broadband services, in importantly increase exports of international telecommunication services of Egyptian companies, mostly in the Smart Village.
It is expected that NTRA will award two licenses for international gateways using open technology and deploy WiMax technology enabling the delivery of last-mile wireless broadband access as an alternative to ADSL.
The main barrier to growth for Egypt's ICT sector is the monopoly of telecommunication corporations and quarreling workforce.
Largest companies
In 2009, 3 Egyptian companies were listed in the Forbes Global 2000 list – an annual ranking of the top 2000 public companies in the world by Forbes magazine. These companies were:
| World Rank | Company | Industry | Revenue (billion $) | Profits (billion $) | Assets (billion $) | Market Value (billion $) |
|---|---|---|---|---|---|---|
| 785 | Orascom Construction Industries | Construction | 2.42 | 1.83 | 17.21 | 4.16 |
| 846 | Orascom Telecom | Telecommunications Services | 4.83 | 2.08 | 11.42 | 3.15 |
| 1384 | Telecom Egypt | Telecommunications Services | 1.80 | 0.43 | 6.19 | 4.51 |
Investment
The stock market capitalisation of listed companies in Egypt was valued at $79.672 billion in 2005 by the World Bank dropping to $58 billion in 2012.[78]
Investment climate
The Egyptian equity market is one of the most developed in the region with more than 633 listed companies. Market capitalization on the exchange doubled in 2005 from US$47.2 billion to US$93.5 billion in 2006, peaking at US$139 billion in 2007. Subsequently, it has fallen to US$58 billion in 2012, with turnover surging from US$1.16 billion in January 2005 to US$6 billion in January 2006.[79]
Private equity has not been widely used in Egypt in the past as a source of funding for businesses. The government, however, has instituted a number of policy changes and reforms specifically intended to develop internal private equity funds and to attract private equity funding from international sources.
The major industries include textiles, hydrocarbon and chemical production, and generic pharmaceutical production. Unemployment is high at about 10.5%.[80]
Until 2003, the Egyptian economy suffered from shortages in foreign currency and excessively elevated interest rates. A series of budget reforms were conducted to redress weaknesses in Egypt's economic environment and to boost private sector involvement and confidence in the economy.
Major fiscal reforms were introduced in 2005 to tackle the informal sector which according to estimates represents somewhere between 30% to 60% of GDP. Significant tax cuts for corporations were introduced for the first time in Egyptian history. The new Income tax Law No 91 for 2005 reduced the tax rate from 40% to 20%. According to government figures, tax filing by individuals and corporations increased by 100%.
Many changes were made to cut trade tariffs. Among the legislators' goals were tackling the Black Market, reducing bureaucracy and pushing through trade liberalization measures. Amendments to Investment and Company law were introduced to attract foreign investors. For example, the number of days required for establishing a company was dramatically reduced.
Significant improvement to the domestic economic environment increased investors' confidence in Egypt. The Cairo & Alexandria Stock Exchange is considered among the best ten emerging markets in the world. The changes to the policy also attracted increased levels of foreign direct investment in Egypt. According to the UN Conference on Trade and Development's World Investment Report, Egypt was ranked the second largest country in attracting foreign investment in Africa.
Given the large number of amendments to laws and regulations, Egypt has succeeded to a certain extent in conforming to international standards. Very recently the Cairo & Alexandria Stock Exchange (CASE) was welcomed with full membership into the World Federation of Exchanges (WFE)—the first Arab country to be invited.
Enforcement of these newly adopted regulatory frameworks remain, sometime problematic. Problems like corruption hamper economic development in Egypt. Many scandals involving bribery were reported during the past years. "In 2002 alone, as many as 48 high-ranking officials—including former cabinet ministers, provincial governors and MPs were convicted of influence peddling, profiteering and embezzlement. Maintaining good relations with politicians is sometimes a key to business success in Egypt. On a scale from 0 to 10 (with 0 being highly corrupt), Egypt scored a 3.3 .
According to a study by the International Organization for Migration, 20% of Egyptian remittance-receiving households interviewed channelled the remittances towards various forms of investment, while the large majority (80%) was more concerned about using remittances for meeting the daily needs of their families including spending on health care and education. Among the 20% of households that decided to invest, 39% invested in real estate, 22% invested in small businesses employing fewer than five people and the smallest proportions of investors (6%) invested in medium private business employing no more than 20 people. According to Egypt's Human Development Report 2008, despite representing approximately 5% of GDP, remittances provided the initial capital for only 1.4% of newly established small and medium enterprises in Egypt in 2003–2004.[33]
Response to the global financial crisis
The challenges of the global food crisis followed by challenges of the global financial crisis made room for more integrated policy reforms. Considering the massive economic measures that have been taken over the past 12 months or so, Egyptian economic policymakers score high based on the inside lag, i.e. the lapse of time between the moment that the shock began to affect the economy and the moment that economic (monetary and fiscal) policy as well as the regulatory policy are altered and put into effect in response to the shock to various markets: goods market (real GDP), the labor market (unemployment rate), money market (interest rate and inflation), and the financial (stock and bond) market. Indeed, moderate financial panic occurred driven—at least partially—by the fear that other investors are about to panic and sell. There were falls in stock and bond market prices, and rises in nominal interest rates.
Egypt has a population of about 97 million, with the population concentrated within a region 20 miles (32 km) on either side of the Nile River.[81] The majority of the population is employed in the services sector, followed by agriculture and industrial production. Approximately one-third of Egyptian labour is engaged directly in farming, and many others work in the processing or trading of agricultural products.
Unemployment rate increased from 10.3% in FY2004 to 11.2% in 2005. The average rate of growth of employment in the publicly owned enterprises sector was −2% per year between FY1998 and FY2005 as a result of aggressive privatization program. On the other hand, private sector employment grew at an average rate of 3% over that period. In addition, the government sector employment grew by almost double the rate of the private sector over the same period.
In general, the average weekly wage in the private sector is, in many instances, higher than that of the public sector. In some other instances, e.g. whole sale and retail trades, the weekly wage is lower by half of that in the public sector.
As a result of the weakness role of the Ministry of Manpower and Trade Unions to create a balance between the rights of workers and the interests of owners of companies in the private sector, privatization has led to worsening employment problems and deterioration in their working environment and health, and many workers have recently resorted to strike and picketing.
In an effort to quell discontent over rising food prices, Egypt offered government and public sector workers a pay rise of up to 30%, and urged the private sector to keep up with the pay rise. The offer came on the May day speech delivered by President Mubarak to the Egyptian General Federation of Trade Unions.
"We must go in dealing with the current global (food) crisis, on two basic tracks (1) we must strengthen the food security of our low-income people, (2) we must achieve a balance between wages and prices." President Mubarak said.
The pay rise originally proposed in the government budget ranged between 15%–20%, but the decision to double it was given on heightened worries that widespread anger over prices could lead to a social explosion. The pay rise is initiated immediately, rather than waiting for the start of the new fiscal year on 1 July 2008 and is to be financed from real resources.
While the headline CPI inflation rate was 15.8% (17.6% in rural areas, 14.4% in urban areas) in March 2008, the overall food price inflation rate was 23.7% (26.9% in rural areas, 20.5% in urban areas). Moreover, in April 2008 in urban areas, the headline CPI inflation rate reached 16.4% while food price inflation rate was 22.0%. This underlines the statement in (Nawar 2008) that "the inflation rate as measured by the headline CPI does not concern the poor and low-income people, who are the majority of people in rural and urban Egypt, since they spend most of their income on food." Approximately 55 million poor and low-income citizens, representing about 75% of the population, are currently enrolled in food ration cards.
In April 2009 it was reported that Egypt feared the return of 500,000 Egyptian laborers working in the Gulf states.[82]
In May 2019, CAPMAS reported that the annual urban consumer price inflation of Egypt has been eased to 13% in April from 14.2% in March.[83]
Poverty and income distribution
Even though there are spots with a facade of affluence, Egypt is actually facing high levels of unemployment and immense poverty. The majority of its younger population is struggling with unemployment and destitution, and heightening food prices in Cairo.[84]
According to an Associated Press report, nearly half of all Egyptians live under or just above the poverty line. More than 15 million Egyptians live on less than $1 a day, and the figure is steadily increasing.[84] The Minister of Economic Development, Othman Mohamed Othman, once mentioned that the poverty rate in Egypt had risen from 19 percent of the population in 2005 to 21 percent in 2009.[85] In 2010/2011, the poverty rate in Egypt had risen to 25% of the population.[86]
Various statistical databases show that Egypt has:[84]
- A population of 90 million, with 33 percent who are 14 years and below; and 20 percent of the population living below the poverty line.
- A labor force of 26 million, with 32 percent working in agriculture, 17 percent in industry, and 51 percent in the service sector.
- An unemployment rate of 9.7 percent.
- A literacy rate of above 71 percent, with males at 83 percent and females at 59.4 percent
According to the 2005 Household Income, Expenditure and Consumption Survey (HIECS), estimated per capita poverty lines vary across the regions. Data from a World Bank and Ministry of Economic Development poverty assessment based on comparisons between actual expenditures (and the cost of a consumption basket securing 2470 calories per day per person), shows that individual Egyptians who spent less than EGP 995 per year in 2005 are considered extreme poor, those who spent less than EGP 1423 per year are poor and those who spent less than EGP 1853 per year are near poor.
Overall about 44.4% of the Egyptian population are in the range of extreme poor to near poor:[87]
- 21% of the Egyptian population was near poor, meaning that about 14.6 million Egyptians can obtain their basic food requirements in addition to some basic services.
- 19.6% of the Egyptian population was poor, meaning that about 13.6 million Egyptians (one out of every five) had consumption expenditure below the poverty line and could not therefore obtain their basic food and non-food needs.
- 3.8% of the Egyptian population was extreme poor, meaning that about 2.6 million of the Egyptian poor could not obtain their basic food requirements even if they spent all their expenditure on food.
Poverty has a strong regional dimension in Egypt and concentrates in Upper Egypt, both urban (18.6%) and rural (39.1), while metropolitan areas are the least poor (5.7%). The government is currently employing recently completed poverty map as tool for geographic targeting of public resources.
According to a report published by the World Bank in April 2019, 60% population of the country is "either poor or vulnerable". Egypt's national poverty rate was 24.3% in 2010 and moved up to around 30% by 2015.[88]
Causes of poverty
High cost of doing business
According to Rapid Assessment surveys conducted by the World Bank Group in 2011 and 2012, business managers rank informal gifts or payments, anticompetitive practices and regulatory policy uncertainty high on the list of obstacles to creating and growing a business.[89] These impediments have a chilling effect on foreign investment in Egypt which means that local businesses cannot be competitive in the international economy because of the high costs of raising capital. In addition, the amount of paperwork required for construction, imports, and exports is burdensome and the time for the government to process this paperwork is lengthy. Traders need to submit 8 documents to export and 10 to import—as opposed to France, for example, where only 2 documents are needed both for imports and exports.[89] The high cost of doing business leads to fewer businesses operating within Egypt which causes unemployment. Egypt's unemployment rate reached 11.8 percent in the second quarter of 2011, down from 11.9 percent in the first quarter (although higher than last year's 8.96 percent).[90] Additionally, there is no Bankruptcy law in Egypt and entrepreneurs that fail to pay debts can face prison sentences.[91]
Corruption
Businesses having more informal connections within the government receive preferable treatment navigating through Egypt's cumbersome regulatory framework, providing a disincentive for competition. An inefficient and sporadically enforced legal system and a widespread culture of corruption leave businesses reliant on the use of middlemen (known as wasta) to operate, and well-connected businesses enjoy privileged treatment.[92] Facilitation payments are an established part of 'getting things done', despite irregular payments and gifts being criminalized. Egypt is the 117 least corrupt nation out of 175 countries, according to the 2017 Corruption Perceptions Index reported by Transparency International. Corruption Rank in Egypt averaged 86.48 from 1996 until 2017, reaching an all-time high of 118 in 2012 and a record low of 41 in 1996. Facilitation payments are regarded as bribery in many countries, which prevents many foreign entities from financial involvement with Egypt since they are a required part of doing business. Corruption makes the costs of both local goods as well as imports higher, decreasing the purchasing power of individuals which magnifies poverty. [93]
Ineffective policies
The country lacks sustainable pragmatic policies to combat poverty.[94][94] Although these policies were adopted in an attempt to reduce economic burdens on the poor, they benefited the rich more which caused more problems to the poor and increased the burdens of the government. In fact, 83 percent of food subsidy, 76 percent of electricity subsidy, 87 percent of petroleum subsidy and 76 percent of the social safety net subsidy went to the non-poor instead of the poor.[94]
High population growth
Egypt's high fertility rate gives rise to significant social and economic burdens – economic development is delayed and there is reduced access to jobs and education.[95] Fertility rates have declined since the 1960s but are still high[96][97] and Egypt's population grew from 44 million in 1981 to more than 97 million today. Egypt's youth experience massive unemployment, with an estimated 7.7 million youths (aged 15–24) jobless in 2010.[98]
See also
- Egypt
- Emerging markets
- List of companies of Egypt
- Next Eleven
- Qualifying Industrial Zone
- Waste Management in Egypt
- United Nations Economic Commission for: Africa & Western Asia
Notes
- These remarks on fiscal conduct and corruption were made in a recent report presented by the head of the Central Agency of Auditing, Gawdat El-Malat, and discussed by the Egyptian Parliament on 14–15 January 2008.
- It is noteworthy that this point is emphasized in the context of the production of natural gas from biogas in (Nawar 2005). Natural gas can be mainly produced with crude oil from the same reservoir, i.e. associated, or from a natural gas reservoir, i.e. non-associated.
References
- "World Economic Outlook Database, April 2019". IMF.org. International Monetary Fund. Retrieved 29 September 2019.
- "World Bank Country and Lending Groups". datahelpdesk.worldbank.org. World Bank. Retrieved 29 September 2019.
- "Population, total – Egypt, Arab Rep". data.worldbank.org. World Bank. Retrieved 3 November 2019.
- IIF forecast
- "World Economic Outlook Database, April 2020". IMF.org. International Monetary Fund. Retrieved 18 April 2020.
- Global-Economic-Prospects-June-2020-Analysis-MENA
- "World Economic Outlook Database, October 2019". IMF.org. International Monetary Fund. Retrieved 21 December 2019.
- "The World Factbook". CIA.gov. Central Intelligence Agency. Retrieved 6 April 2019.
- "Poverty headcount ratio at $3.20 a day (2011 PPP) (% of population) – Egypt, Arab Rep". data.worldbank.org. World Bank. Retrieved 3 February 2020.
- "GINI index (World Bank estimate)". data.worldbank.org. World Bank. Retrieved 6 April 2019.
- "Human Development Index (HDI)". hdr.undp.org. HDRO (Human Development Report Office) United Nations Development Programme. Retrieved 11 December 2019.
- "Inequality-adjusted HDI (IHDI)". hdr.undp.org. UNDP. Retrieved 22 May 2020.
- "Labor force, total – Egypt, Arab Rep". data.worldbank.org. World Bank. Retrieved 3 November 2019.
- "Employment to population ratio, 15+, total (%) (national estimate) – Egypt, Arab Rep". data.worldbank.org. World Bank. Retrieved 3 November 2019.
- "Egypt unemployment rate falls to 8.1 pct in Q1 – CAPMAS". Reuters. 25 July 2019. Retrieved 15 May 2019.
- "Ease of Doing Business in Egypt, Arab Rep". Doingbusiness.org. Retrieved 26 August 2018.
- www.fitchratings.com https://www.fitchratings.com/research/sovereigns/fitch-affirms-egypt-at-b-outlook-stable-27-07-2020. Retrieved 28 July 2020. Missing or empty
|title=(help) - "Cabinet approves budget for FY 2018/19, refers it to Parliament". Egypt Today. Retrieved 3 May 2018.
- "Egypt 2018/19 budget assumes rate of 17.25 Egyptian pounds to dollar – PM". Reuters. Retrieved 3 May 2018.
- "INDICATORS-Egypt – April 16". Reuters. 16 April 2020. Retrieved 18 April 2020.
- www.fitchratings.com https://www.fitchratings.com/research/sovereigns/fitch-affirms-egypt-at-b-outlook-stable-27-07-2020. Retrieved 28 July 2020. Missing or empty
|title=(help) - Egypt Overview worldbank.org, April 2013
- "S&P Downgrades Egypt's Credit Rating". Archived from the original on 5 October 2017. Retrieved 13 February 2012.
- "Egypt: Time to Entrench Growth and Make It More Inclusive". International Monetary Fund. Retrieved 30 June 2018.
- "Egypt receives 5th $2bn tranche of IMF loan". NYT. Associated Press. 6 February 2019. Retrieved 8 February 2019.
- Data from the Egypt's statistics body, CAPMAS.
- "Report for Selected Countries and Subjects". www.imf.org. Retrieved 9 December 2018.
- Nawar (2006).
- Central Bank of Egypt, MPC Press Releases
- "Migration and Development in Egypt" (PDF). International Organization for Migration Cairo. Retrieved 2 December 2015.
- "General Economic and Financial Outlook" (PDF). Ministry of Finance. Retrieved 2 December 2015.
- Source:, Ministry of Finance and Central Bank of Egypt, as analyzed in Nawar, Abdel-Hameed (2008). "Anti-Inflation Policy Array in Egypt". SSRN 1115642.
- , Strategic Foresight Group report: Cost of Conflict in the Middle East 2009
- Nawar (2008).
- https://www.bloomberg.com/news/articles/2016-11-03/egypt-free-floats-pound-raises-lending-rates-to-spur-economy
- http://www.irinnews.org/report/93193/egypt-desertification-threat-to-local-food-production
- http://www.irinnews.org/report/93045/egypt-sewage-fed-vegetable-plots-pose-health-risk
- Sowing the right seeds Archived 3 January 2010 at the Wayback MachineAl-Ahram Weekly, 6 August 2009
- EGYPT CLONES A NILE Archived 18 June 2010 at the Wayback MachineEGYPT CLONES A NILE, Source: U.S. News & World Report, 19 May 1997, Vol. 122 Issue 19, p33, 3p.
- Imported Wheat Stocks Dwindle Amid Egypt's Currency Crisis. Cnbc.com (3 July 2013). Retrieved on 29 July 2013.
- "Global consortium to inject $50m in Egypt commodity exchange". MUBASHER. 26 November 2015. Retrieved 28 November 2015.
- "Egypt signs protocol to establish commodities exchanges". The Cairo Post. 26 November 2015. Retrieved 30 November 2015.
- Source: USDA, Foreign Agricultural Service
- World Bank data portal http://databank.worldbank.org/data/views/reports/chart.aspx
- Hamdy El-Swalhy (29 October 2008). "Using what we have". Al-Ahram Weekly. Archived from the original on 6 August 2009.
- "The World Factbook". Retrieved 4 March 2015.
- http://www.eia.gov/countries/country-data.cfm?fips=eg#ng
- Mariaan, Webb (20 April 2011). "AngloGold and JV partner to accelerate exploration in Egypt". Mining Weekly. Retrieved 7 September 2012.
- Balashov, Sergei (20 June 2012). "Northland says Alexander Nubia's Hamama project has significant potential". Proactive Investors. Retrieved 7 September 2012.
- Tom Gara (October 2007). "The Great Egyptian Gold Rush". Business Today Egypt. Archived from the original on 11 December 2007.
- See http://www.eia.doe.gov/emeu/cabs/Syria/NaturalGas.html
- BRIEF: Merhav exec insists gas pipeline is sufficient: "The pipeline was designed, built, and tested by the top companies in their fields." Lior Baron. McClatchy – Tribune Business News. Washington: 24 March 2008.
- Nawar (2005).
- "Cairo sources said Israelis will dig for oil in Sinai". infoprod.co.il.
- "The gas conundrum". Al-Ahram Weekly. 26 November 2008. Archived from the original on 12 January 2010. Retrieved 26 November 2009.
- Wall st Journal article in Egypt's gas
- "Country profile – Egypt (Version 2016)" (PDF). Food and Agriculture Organization of the United Nations. Retrieved 6 June 2018.
- Fouad N. Ibrahim; Barbara Ibrahim (5 December 2003). Egypt: An Economic Geography. I.B.Tauris. pp. 133–. ISBN 978-1-86064-548-8.
- Factory Archived 13 June 2015 at the Wayback Machine MCV-Website. Retrieved 18. October 2015
- EuroMonitor Report Retrieved 24 August 2012
- EuroAfrica Interconnector
- Electricity Cable Aims to Link Cyprus, Egypt, Greece, Bloomberg, February 8, 2017
- EuroAfrica 2,000MW cable boosts Egypt-Cyprus ties, Financial Mirror February 8, 2017
- Mohamed Farag (6 February 2017). "EEHC, Euro Africa Company sign MoU to conduct a feasibility study to link Egypt, Cyprus, Greece". Daily News Egypt.
- Minister heading to Nicosia for EuroAfrica Interconnector
- Energy, peace focus of Tripartite Summit, Cyprus Mail, November 21, 2017
- Joint Declaration following the 5th Cyprus – Egypt – Greece Trilateral Summit, PIO Cyprus,Nicosia, 21 November 2017
- "Egypt President El-Sisi fully endorses EuroAfrica Interconnector "electricity corridor" in historic meeting, Press release". Archived from the original on 4 February 2018. Retrieved 5 February 2018.
- l Fattah el-Sisi, Anastasiades, Tsipras Trilateral Summit 21 November 2017
- Egypt's Tourism Industry (PDF) (Report). Bank of Alexandria. October 2010. p. 7. Retrieved 31 October 2012.
- Kotb, Ahmed (24 October 2012). "Tourism Tips". Al-Ahram. Archived from the original on 27 October 2012. Retrieved 31 October 2012.
- Neil Hollingsworth (5 July 2012). "EGYPTIAN TOURISM FIGURE IMPRESSES INTERNATIONAL INVESTORS". Rivermead Global Property. Retrieved 5 July 2012.
- Gratowski, J. Thomas (17 February 2014). "Is Egypt Breaking Apart?". International Affairs Review. Archived from the original on 22 February 2014. Retrieved 18 February 2014.
- Data – Finance
- "Egypt: privatization Troubles Peak". Thomaswhite.com. 9 July 2010. Archived from the original on 26 May 2013. Retrieved 1 May 2013.
- Private Equity in Pakistan, Israel, and Egypt, by Sethi, Arjun November 2007.
- "The World Factbook—Central Intelligence Agency". www.cia.gov. Retrieved 1 May 2018.
- "IPR – Egypt fears return of 500,000 workers from Gulf". Retrieved 4 March 2015.
- "Egypt inflation eases as economy strengthens". The National. Retrieved 9 May 2019.
- Henry, J. Reske. "Egypt's Poverty, Unemployment, Push Youths to Breaking Point". Retrieved 10 February 2012.
- Saleh, Amirah (10 October 2009). "Govt: Poverty rate up 2%". Retrieved 1 May 2013.
- Farid, Doaa (2 November 2013). "Government launches 'Egypt 2022' economic development plan". Daily News Egypt. Retrieved 18 February 2014.
Long term developmental vision aims at achieving a "sustainable and containment growth", was unveiled by the Ministry of Planning.
- Nawar (2007).
- "World Bank Group to Extend Current Strategy in Egypt to Maintain Momentum on Reforms". World Bank. Retrieved 30 April 2019.
- "Archived copy" (PDF). Archived from the original (PDF) on 13 February 2015. Retrieved 11 January 2016.CS1 maint: archived copy as title (link)
- "Daily News Egypt: Egypt unemployment rate reaches 11.8 pct". 30 August 2011. Retrieved 10 February 2012 – via Egypt Business Directory.
- "Startups in the Arab world". The Economist. 14 January 2017. ISSN 0013-0613. Retrieved 24 January 2017.
- "Archived copy". Archived from the original on 17 January 2016. Retrieved 11 January 2016.CS1 maint: archived copy as title (link)
- wwe.tradingeconomics.com/egypt/corruption-rank
- Sayed, Attia. "Poverty Eradication in Egypt". Archived from the original on 17 February 2012. Retrieved 10 February 2012.
- Guzzardi, Joe. "Egypt faces huge problems of overpopulation, poverty". Retrieved 10 February 2012.
- Khalifa, Mona; Julie DaVanzo; David M. Adamson. 2000
- Population Growth in Egypt – A Continuing Policy Challenge. Rand Corporation Issue Paper IP-183. Accessed 10 February 2012
- Nasir, Sudirman. "Egypt has a population crisis as well as a democracy crisis". Retrieved 10 February 2012.
Sources
- Central Bank of Egypt. "Economic Bulletin and Annual Report Egypt 2007". Cite journal requires
|journal=(help) - Nawar, Abdel-Hameed (2005). "The Emerging Landscape of the Natural Gas in Egypt". Cairo University, manuscript.CS1 maint: ref=harv (link)
- Nawar, Abdel-Hameed (2007). "From Marina to Kom-Ombo: A Note on Poverty in Egypt". Cairo University, manuscript. August.CS1 maint: ref=harv (link)
- Nawar, Abdel-Hameed (2008). "PPI and Measuring Inflation in Business Transactions in Egypt". Cairo University, manuscript. March. SSRN 1106416.CS1 maint: ref=harv (link)
- Ministry of Investment (2005). "Quarterly report (Second Quarter) financial": 21. Cite journal requires
|journal=(help) - Oxford business group. "Emerging Egypt 2007". Cite journal requires
|journal=(help)
External links
- Egypt: Reforms Trigger Economic Growth
- Egypt Economic Development at Curlie
- Transparency International website
- World Bank Summary Trade Statistics Egypt
- Economy of Egypt extracted from the CIA Factbook & Worldbank data
Currency: Egyptian pound | |
| Communications | |
| Industries: |
|
| Sovereign states |
|
|---|---|
| States with limited recognition |
|
| Dependencies and other territories | |
| |