Economy of Estonia
The economy of Estonia is an advanced economy and the country is a member of the European Union and of the eurozone.[21] Estonia's economy is heavily influenced by developments in the Finnish and Swedish economies.[22]
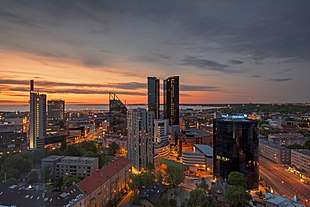 Tornimäe business area in Tallinn | |
| Currency | Euro (EUR, €) |
|---|---|
| Calendar year | |
Trade organisations | EU, WTO and OECD |
Country group | |
| Statistics | |
| Population | |
| GDP | |
| GDP rank | |
GDP growth |
|
GDP per capita | |
GDP per capita rank | |
GDP by sector |
|
Population below poverty line | |
Labour force | |
Labour force by occupation |
|
| Unemployment | |
Average gross salary | €1,455 / $1,635 monthly (December, 2018) |
Average net salary | €1,193 / $1,340 monthly (December, 2018) |
Main industries | engineering, electronics, wood and articles of wood, textiles, information technology, telecommunications |
| External | |
| Exports | |
Export goods | Electrical equipment, wood and articles of wood, mineral products, agriculture products, mechanical appliances |
Main export partners | |
| Imports | |
Import goods | Electrical equipment, transport equipment, agricultural products, mineral products, mechanical appliances |
Main import partners | |
FDI stock | |
Gross external debt | |
| Public finances | |
| Revenues | 38.7% of GDP (2019)[17] |
| Expenses | 39.0% of GDP (2019)[17] |
| Economic aid | donor: ODA, €40.3 million (2016)[18] |
| |
Foreign reserves | |
Overview
Before the Second World War, Estonia's economy was based on agriculture, but there was a significant knowledge sector, with the university city of Tartu known for scientific contributions, and a growing industrial sector, similar to that of neighbouring Finland. Products, such as butter, milk, and cheese were widely known in the west European markets. The main markets were Germany and the United Kingdom, and only 3% of all commerce was with the neighbouring USSR. Estonia and Finland had a relatively similar standard of living.[23]
The USSR's annexation of Estonia in 1940 and the ensuing Nazi and Soviet destruction during World War II crippled the Estonian economy. The subsequent Soviet occupation and post-war Sovietization of life continued with the integration of Estonia's economy and industry into the USSR's centrally planned structure. Estonia's GDP per capita was just $100 in 1991.[24]
After Estonia moved away from communism in the late 1980s, restored its independence in 1991 and became a market economy, it emerged as a pioneer in the global economy. In 1992, the country adopted the Estonian kroon as its own currency, and this greatly stabilised the economy. In 1994, it became one of the first countries in the world to adopt a flat tax, with a uniform rate of 26% regardless of personal income. Estonia received more foreign investment per capita in the second half of the 1990s than any other country in Central and Eastern Europe. Between 2005 and 2008, the personal income tax rate was reduced from 26% to 21% in several steps.[25]
The country has been quickly catching up with the EU-15; its GDP per capita having grown from 34.8% of the EU-15 average in 1996 to 65% in 2007, similar to that of Central European countries.[25] It is already rated a high-income country by the World Bank. The GDP (PPP) per capita of the country, a good indicator of wealth, was $35,974 in 2018 according to the World Bank, between that of Lithuania and Cyprus, but below that of most long-time EU members such as Spain or Italy.[26] Because of its economic performance after the Soviet breakup, Estonia has been termed one of the Baltic Tigers.
In 2008, Estonia was ranked 12th of 162 countries in the Index of Economic Freedom 2008, the best of any former Soviet republic. The same year, the country was at the bottom of the list of European states by labour market freedom, but the government is drafting improvements.[27]
For Estonia, the financial crisis of 2007–2008 was comparatively easier to weather, because Estonia's budget has consistently been kept balanced, and this meant that Estonia's public debt relative to the country's GDP has remained the lowest in Europe. The economy recovered in 2010.[28]
On 1 January 2011, Estonia joined the euro,[29] and became the first ex-Soviet republic to join the eurozone.[30]
In 2013, the World Bank Group rated Estonia as 21st on the Ease of Doing Business Index.
History
Early history
Until the early 13th century, the territory that is now known as Estonia was independent. The economy was largely an agricultural one, but Estonia being a country with a long coastline, there were also many maritime activities. Autonomous development was brought to an end by the Northern Crusades undertaken by the King of Denmark, the German Livonian and the Teutonic military orders. The Estonian world was transformed by military conquest. The war against the invaders lasted from 1208–1227. The last Estonian county to fall was the island of Saaremaa in 1261.
Thereafter, through many centuries until WWI, Estonian agriculture consisted of native peasants working large feudal-type estates held by ethnic German landlords. In the decades prior to independence, centralised Czarist rule had created a rather large industrial sector dominated by the Kreenholm Manufacturing Company, then the world's largest cotton mill.
Independence
After declaring independence in 1918, the Estonian War of Independence and the subsequent signing of the Treaty of Tartu in 1920, the new Estonian state inherited a ruined post-war economy and an inflated ruble currency. Despite considerable hardship, dislocation, and unemployment, Estonia spent the first decade of independence entirely transforming its economy. In 1918, The Czarist ruble was replaced by the Estonian mark, which was in circulation until 1927. By 1929, a stable currency, the kroon, had been established. It was issued by the Bank of Estonia, the country's central bank. Compensating the German landowners for their holdings, the government confiscated the estates and divided them into small farms, which subsequently formed the basis of Estonian prosperity. Trade focused on the local market and the West, particularly Germany and the United Kingdom. Only 3% of all commerce was with the USSR.
Soviet occupation
The USSR's forcible annexation of Estonia in 1940 and the ensuing Nazi and Soviet destruction during World War II crippled the Estonian economy. Post-war Soviet occupation and Sovietisation of life continued with the integration of Estonia's economy and industry into the USSR's centrally planned structure. More than 56% of Estonian farms were collectivised in the month of April 1949 alone after mass deportations to Siberia the previous month. Moscow expanded on those Estonian industries which had locally available raw materials, such as oil shale mining and phosphorites.
Restoration of independence, modernisation and liberalisation
Since reestablishing independence, Estonia has styled itself as the gateway between East and West and pursued economic reform and integration with the West. Estonia's market reforms put it among the economic leaders in the former COMECON area. A balanced budget, almost non-existent public debt, flat-rate income tax, free trade regime, fully convertible currency backed by currency board and a strong peg to the euro, competitive commercial banking sector, hospitable environment for foreign investment, innovative e-Services and mobile-based services are all hallmarks of Estonia's free-market-based economy.
In June 1992, Estonia replaced the ruble with its own freely convertible currency, the kroon (EEK). A currency board was created and the new currency was pegged to the German Mark at the rate of 8 Estonian kroons for 1 Deutsche Mark. When Germany introduced the euro the peg was changed to 15.6466 kroons for 1 euro.
Estonia was set to adopt the euro in 2008, but due to the inflation rate being above the required 3%, the adoption date was delayed to 2011. On 1 January 2011, Estonia adopted the euro and became the 17th eurozone member state.[29]
The privatisation of state-owned firms is virtually complete, with only the port and the main power plants remaining in government hands.
The constitution requires a balanced budget, and the protection afforded by Estonia's intellectual property laws is on a par of that of Europe's.
In early 1992, both liquidity problems and structural weakness stemming from the communist era precipitated a banking crisis. As a result, effective bankruptcy legislation was enacted and privately owned; well-managed banks emerged as market leaders. Today, near-ideal conditions for the banking sector exist. Foreigners are not restricted from buying bank shares or acquiring majority holdings.
The fully electronic Tallinn Stock Exchange opened in early 1996, and was purchased by Finland's Helsinki Stock Exchange in 2001.
Estonia joined the World Trade Organization in 1999.
From the early 2000s to the latter part of that decade, the Estonian economy experienced considerable growth. In the year 2000, Estonian GDP grew by 6.4%.
Upon accession to the European Union in 2004, double-digit growth was soon after observed.
GDP grew by 7.9% in 2007 alone. Increases in labor costs, the imposition of tax on tobacco, alcohol, electricity, fuel, gas, and other external pressures (growing prices of oil and food on the global market) were expected to inflate price levels by 10% in the first months of 2009.
The 2008 financial crisis, response and recovery
The financial crisis of 2007–2008 has had a deep effect on the Estonian economy, primarily as a result of an investment and consumption slump that followed the burst of the real estate market bubble that had been building up during the preceding years.
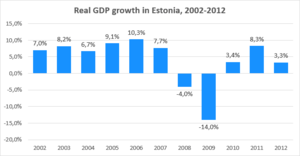
After a long period of very high growth of GDP, the GDP of Estonia decreased. In the first quarter 2008, GDP grew only 0.1%, and then decreased: negative growth was −1.4% in the 2nd quarter, a little over −3% (on a year-to-year basis) in the 3rd quarter, and −9.4% in the 4th quarter of that year.[31]
The government made a supplementary negative budget, which was passed by the Riigikogu. The revenue of the budget was decreased for 2008 by EEK 6.1 billion and the expenditure by EEK 3.2 billion.[32] A current account-deficit was extant, but began to shrink in the last months of 2008, and had been expected to continue to do so in the near future.
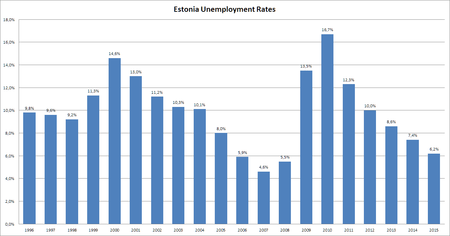
In 2009, the Estonian economy further contracted by 15.1% in the first quarter.[31] Low domestic and foreign demand had depressed the economy's overall output.[33] The Estonian economy's 33.7% industrial production drop was the sharpest decrease in industrial production in the entire European Union.[34] That year, Estonia was one of the five worst-performing economies in the world in terms of annual GDP growth rate,[35] and had one of the greatest rates of unemployment in the EU, which rose from 3.9% in May 2008 to 15.6% in May 2009.[36]
Some international experts and journalists, who like to view the three Baltic states as a single economic identity, had failed to notice that Estonia has constantly performed better than Latvia and Lithuania on many fundamental indicators. The current-account deficit and inflation was lower than in Latvia; GDP per capita was higher than in Latvia and Lithuania; Estonia's public debt was a low 3.8% of GDP, and government reserves were close to 10% of GDP. The difference is exemplified by the fact, that in December 2008, Estonia became one of the donor countries to the IMF lead rescue package for Latvia.
In response to the crisis, the Ansip government opted for fiscal consolidation and retrenchment by maintaining fiscal discipline and a balanced budget in combination with austerity packages: The government increased taxes, and reduced public spending by slashing expenditures and public salaries across the board.[28]
In July 2009, the value-added tax was increased from 18% to 20%.[37] The recorded budget deficit for 2009 was just 1.7% of GDP.[28]
The result was, that Estonia was one of only five EU countries in 2009 that had met the Maastricht criteria for debt and deficit, and had the third-lowest deficit after Luxembourg and Sweden. Neither did Estonia need to ask help from the IMF. Despite the third-largest drop in GDP, the country had the lowest budget deficit and the lowest public debt among Central and Eastern European countries.
In 2009, the Estonian economy began to rebound, and economic growth resumed in the second half of 2010. The country's unemployment rate has since dropped significantly to pre-recession levels.[38] To top it off, Estonia was granted permission in 2010 to join the eurozone in 2011.[28]
Joining the euro
Before joining the eurozone, the Estonian kroon had been pegged to the euro at a rate of 15.64664 EEK to one euro; before then, the kroon was pegged to the German mark at approximately 8 EEK to 1 DEM.
Plans to join the euro were in place well before 2011. The design of Estonian euro coins was finalized in late 2004.[39]
Estonia's journey towards the euro took longer than originally projected, owing to the inflation rate continually being above the required 3% before 2010,[40] which prevented the country from fulfilling the entry criteria. The country originally planned to adopt the euro on 1 January 2007; however, it did not formally apply that year, and officially changed its target date twice: first to 1 January 2008, and later to 1 January 2011.[30]
On 12 May 2010, the European Commission announced that Estonia had met all criteria to join the eurozone.[41] On 8 June 2010, EU finance ministers agreed that Estonia would be able to join the euro on 1 January 2011.[42] On 13 July 2010, Estonia received the final approval from ECOFIN to adopt the euro onwards from 1 January 2011.
The switchover to the euro took place on 1 January 2011.[29]
With that, Estonia became the first ex-Soviet republic to join the eurozone.[30]
On 9 August 2011, just days after Standard & Poor's raised Estonia's credit rating from A to AA-. Among the factors, S&P cited as contributing to its decision was confidence in Estonia's ability to "sustain strong economic growth."[43] Estonia's GDP growth rate in 2011 was above 8%, despite having negative population growth.[44][45]
The economy today
In the second quarter of 2013, the average monthly gross wage in Estonia was €976 (15,271 kroons, US$1,328).[46] This figure has grown consistently to €1310 (20,497 kroons, US$1473)[47] as of 2018.
Estonia is nearly energy-independent, supplying over 90% of its electricity needs with locally mined oil shale. Alternative energy sources such as wood, peat, and biomass make up approximately 9% of primary energy production. Estonia imports needed petroleum products from western Europe and Russia. Oil shale energy, telecommunications, textiles, chemical products, banking, services, food and fishing, timber, shipbuilding, electronics, and transportation are key sectors of the economy. The ice-free port of Muuga, near Tallinn, is a modern facility featuring good transshipment capability, a high-capacity grain elevator, chill/frozen storage, and brand-new oil tanker off-loading capabilities. The railroad serves as a conduit between the West, Russia, and other points to the East.
Estonia today is mainly influenced by developments in Finland, Russia, Sweden and Germany – the four main trade partners. The government has significantly increased its spending on innovation since 2016, with €304 million aimed to stimulate research and development in 2017.[48]
Future projections
Long-term prospects for the Estonian economy remain among the most promising in Europe. In 2011, the real GDP growth in Estonia was 8.0%, and according to projections made by CEPII, the GDP per capita could rise by 2025 to the level of Nordic economies of Sweden, Finland, Denmark, and Norway. According to the same projections, by 2050, Estonia could become the most productive country in the EU, after Luxembourg, and thus join the top five most productive nations in the world.[49]
Employment participation
Estonia has around 600,000 employees, yet the country has a shortage of skilled labor, and since skill shortages are experienced everywhere in Europe, the government has increased working visa quota for non-EEA citizens, although it has nevertheless been criticized for being inadequate for addressing the shortages.
The late-2000s recession in the world, the near-concurrent local property bust with changes in Estonian legislation to increase labour market flexibility (making it easier for companies to lay off workers) saw Estonia's unemployment rate shoot up to 18.8% throughout the duration of the crisis, then stabilise to 13.8% by summer 2011, as the economy recovered on the basis of strong exports. Internal consumption, and therefore imports, plummeted; and cuts were made in public finances.[50] Some of the reduction in unemployment has been attributed to some Estonians' emigrating for employment to Finland, the UK, Australia, and elsewhere.[51]
After the recession, the unemployment rate went lower, and throughout 2015 and 2016, the rate stayed near the levels that preceded the economic downturn, staying at just above 6%.[52]
Sectors
Tallinn has emerged as the country's financial center. According to Invest in Estonia, advantages of Estonian financial sector are unbureaucratic cooperation between companies and authorities, and relative abundance of educated people although young educated Estonians tend to emigrate to western Europe for greater income. The largest banks are Swedbank, SEB Pank, and Nordea. Several IPOs have been made recently on the Tallinn Stock Exchange, a member OMX system.
The Estonian service sector employs over 60% of workforce. Estonia has a strong information technology (IT) sector, partly due to the Tiigrihüpe project undertaken in mid-1990s, and has been mentioned as the most "wired" and advanced country in Europe in the terms of e-government.[53][54]
Farming, which had been forcibly collectivized for decades until the transition era of 1990–1992, has become privatized and more efficient, and the total farming area has increased in the period following Estonia's restoration of independence.[55] The share of agriculture in the gross domestic product decreased from 15% to 3.3% during 1991–2000, while employment in agriculture decreased from 15% to 5.2%.[56]
The mining industry makes up 1% of the GDP. Mined commodities include oil shale, peat, and industrial minerals, such as clays, limestone, sand and gravel.[57] Soviets created badly polluting industry in the early 1950s, concentrated in the north-east of the country. Socialist economy and military areas left the country highly polluted, and mainly because of oil shale industry in Ida-Virumaa, sulfur dioxide emissions per person are almost as high as in the Czech Republic. The coastal seawater is polluted in certain locations, mainly the east. The government is looking for ways to reduce pollution further.[58] In 2000, the emissions were 80% smaller than in 1980, and the amount of unpurified wastewater discharged to water bodies was 95% smaller than in 1980.[59]
Estonian productivity is experiencing rapid growth, and consequently wages are also rising quickly, with a rise in private consumption of about 8% in 2005. According to Estonian Institute of Economic Research, the largest contributors to GDP growth in 2005 were processing industry, financial intermediation, retailing and wholesale trade, transport and communications.[60]
Largest companies by revenue
|
Largest companies by profit
|
Infrastructure

Railway transport dominates the cargo sector, comprising 70% of all carried goods, domestic and international. Road transport is the one that prevails in the passenger sector, accounting for over 90% of all transported passengers. 5 major cargo ports offer easy navigational access, deep waters, and good ice conditions. There are 12 airports and 1 heliport in Estonia. Lennart Meri Tallinn Airport is the largest airport in Estonia, with 1,73 million passengers and 22,764 tons of cargo (annual cargo growth 119.7%) in 2007. International flight companies such as SAS, Finnair, Lufthansa, EasyJet, and Nordic Aviation Group provide direct flights to 27 destinations.[62]
Approximately 7.5% of the country's workforce is employed in transportation and the sector contributes over 10% of GDP. Estonia is getting much business from traffic between European Union and Russia, especially oil cargo through Estonian ports. Transit trade's share of GDP is disputed, but many agree that Russia's increased hostility is decreasing the share.[63][64]
Instead of coal, electricity is generated by burning oil shale, with largest stations in Narva. Oil shale supplies around 70% of the country's primary energy. Other energy sources are natural gas imported from Russia, wood, motor fuels, and fuel oils.[65]
Wind power in Estonia amounts to 58.1 megawatts, whilst roughly 399 megawatts worth of projects are currently being developed. Estonian energy liberalization is lagging far behind the Nordic energy market. During the accession negotiations with the EU, Estonia agreed that at least 35% of the market are opened before 2009 and all of non-household market, which totals around 77% of consumption, before 2013. Estonia is concerned that Russia could use energy markets to bully it.[66] In 2009, the government considered granting permits to nuclear power companies, and there were plans for a shared nuclear facility with Latvia and Lithuania.[67] Those plans were shelved after the Fukushima Daiichi nuclear disaster in March 2011.
Estonia has high Internet penetration, and connections are available throughout most of the country.
Trade

| Country | Export | Import |
|---|---|---|
| 16% | 14% | |
| 19% | 8% | |
| 10% | 9% | |
| 8% | 8% | |
| 6% | 9% | |
| 5% | 11% | |
| 4% | 8% |
Estonia exports machinery and equipment (33% of all exports annually), wood and paper (15% of all exports annually), textiles (14% of all exports annually), food products (8% of all exports annually), furniture (7% of all exports annually), and metals and chemical products. Estonia also exports 1.562 million megawatt hours of electricity annually. Estonia imports machinery and equipment (33.5% of all imports annually), chemical products (11.6% of all imports annually), textiles (10.3'% of all imports annually), food products (9.4% of all imports annually), and transportation equipment (8.9% of all imports annually). Estonia imports 200 thousand megawatt hours of electricity annually.[68]
Natural resources
| Resource | Location | Reserves |
|---|---|---|
| Oil shale | north-east | 1,137,700,000 mln t |
| Sea mud (medical) | south | 1,356,400,000 mln t |
| Construction sand | across the country | 166,700,000 mln m³ |
| Construction gravel | north | 32,800,000 mln m³ |
| Lake mud (medical) | across the country | 1,133,300 mln t |
| Lake mud (fertilizer) | east | 170,900 t |
| Ceramic clay | across the country | 10,600,000 mln m³ |
| Ceramsid clay (for gravel) | across the country | 2,600,000 mln m³ |
| Technological dolomite | west | 16,600,000 mln m³ |
| Technological limestone | north | 13,800,000 mln m³ |
| Decoration dolomite | west | 2,900,000 mln m³ |
| Construction dolomite | west | 32,900,000 mln m³ |
| Blue clay | across the country | 2,044,000 mln t |
| Granite | across the country | 1,245,100,000 mln m³ |
| Peat | across the country | 230,300,000 mln t |
| Construction limestone | north | 110,300,000 mln m³ |
| Limestone cement | north | 9,400,000 mln m³ |
| Clay cement | north | 15,6000,000 mln m³ |
| Graptolitic argillite[69] | north | 64,000,000,000 mln t |
| Wood | across the country | 15,6000,000 mln m³ |
| Technological sand | north | 3,300,000 mln m³ |
| Lake lime | north and south | 808,000 t |
| Phosphorite | north | over 350,000,000 mln t (estimated) |
| Subsoil | across the country | 21,1 km³ |
Data
The following table shows the main economic indicators in 1993–2018.[70]
| Year | GDP (in Bil. US$ PPP) |
GDP per capita (in US$ PPP) |
GDP growth (real) |
Inflation rate (in Percent) |
Unemployment (in Percent) |
Government debt (in % of GDP) |
|---|---|---|---|---|---|---|
| 1993 | n/a | |||||
| 1994 | n/a | |||||
| 1995 | 9% | |||||
| 1996 | ||||||
| 1997 | ||||||
| 1998 | ||||||
| 1999 | ||||||
| 2000 | ||||||
| 2001 | ||||||
| 2002 | ||||||
| 2003 | ||||||
| 2004 | ||||||
| 2005 | ||||||
| 2006 | ||||||
| 2007 | ||||||
| 2008 | ||||||
| 2009 | ||||||
| 2010 | ||||||
| 2011 | ||||||
| 2012 | ||||||
| 2013 | ||||||
| 2014 | ||||||
| 2015 | ||||||
| 2016 | ||||||
| 2017 | ||||||
| 2018 |
See also
References
- "World Economic Outlook Database, April 2019". IMF.org. International Monetary Fund. Retrieved 29 September 2019.
- "World Bank Country and Lending Groups". datahelpdesk.worldbank.org. World Bank. Retrieved 29 September 2019.
- "Population on 1 January". ec.europa.eu/eurostat. Eurostat. Retrieved 13 July 2020.
- "World Economic Outlook Database, October 2019". IMF.org. International Monetary Fund. Retrieved 16 October 2019.
- "World Economic Outlook Database, April 2020". IMF.org. International Monetary Fund. Retrieved 15 April 2020.
- "The World Factbook". CIA.gov. Central Intelligence Agency. Retrieved 3 March 2019.
- "Last year, every fifth person lived in relative poverty". Statistics Estonia. 18 December 2017.
- "People at risk of poverty or social exclusion". ec.europa.eu/eurostat. Eurostat. Retrieved 15 August 2020.
- "Gini coefficient of equivalised disposable income – EU-SILC survey". ec.europa.eu. World Bank. Retrieved 15 August 2020.
- "Human Development Index (HDI)". hdr.undp.org. HDRO (Human Development Report Office) United Nations Development Programme. Retrieved 11 December 2019.
- "Inequality-adjusted HDI (IHDI)". hdr.undp.org. UNDP. Retrieved 22 May 2020.
- "Labor force, total – Estonia". data.worldbank.org. World Bank. Retrieved 15 November 2019.
- "Employment rate by sex, age group 20–64". ec.europa.eu/eurostat. Eurostat. Retrieved 16 June 2019.
- "Unemployment by sex and age – monthly average". appsso.eurostat.ec.europa.eu/eurostat. Eurostat. Retrieved 2 July 2020.
- "Youth unemployment rate". data.oecd.org. OECD. Retrieved 1 April 2020.
- "Last year, trade increased". Statistics Estonia. 18 April 2019.
- "Euro area and EU27 government deficit both at 0.6% of GDP" (PDF). ec.europa.eu/eurostat. Eurostat. Retrieved 28 April 2020.
- "Estonia's 2016 development and humanitarian aid figures released". Ministry of Foreign Affairs of Estonia. 2016. Retrieved 1 April 2018.
- "Scope upgrades Estonia's credit rating to AA-; Outlook Stable". Scope Ratings. Retrieved 21 February 2020.
- https://data.oecd.org/lprdty/gdp-per-hour-worked.htm#indicator-chart
- "World Economic and Financial Surveys / World Economic Outlook". Database—WEO Groups and Aggregates Information. International Monetary Fund. April 2011. Retrieved 21 August 2012.
- Maddison 2006, p. 185
- "Eesti majandus oli võrdsel tasemel Paapua Uus-Guineaga" [Estonia's economy was on the same level with Papua New Guinea] (in Estonian). Äripäev. 30 January 2007. Retrieved 9 February 2019.
- Laar, Mart (7 August 2007). "The Estonian Economic Miracle". The Heritage Foundation. Retrieved 21 August 2012.
- "GDP per capita, PPP (current international $)". World Bank. Retrieved 6 January 2020.
- Koovit, Kaja (20 May 2008). "Estonia on bottom of Europe by labour market freedom". Baltic Business News. Retrieved 1 August 2012.
- Kattel, Rainer; Raudla, Ringa (August 2011), "Why Did Estonia Choose Fiscal Retrenchment after the 2008 Crisis?", Journal of Public Policy, Researchgate, retrieved 9 February 2019
- Mardiste, David (1 January 2011). "Estonia joins crisis-hit euro club". Reuters. Retrieved 21 August 2012.
- "Alcohol and tobacco tax to rise in Estonia next year". Helsingin Sanomat. Finland. 25 May 2007. Retrieved 1 January 2009.
- Tubalkain-Trell, Marge (9 June 2009). "Estonian Economy Fell 15.1 pct in Q1". Baltic Business News. Retrieved 21 August 2012.
- "Government approves supplementary budget for 2008". Ministry of Finance of the Republic of Estonia. 15 May 2008. Retrieved 21 August 2012.
- Mardiste, David (9 June 2009). "Estonian Economy Contracts Sharply in First Quarter". Reuters. Retrieved 21 August 2012.
- Tubalkain-Trell, Marge (12 June 2009). "Estonian Industrial Production Fell Most in EU". Baltic Business News. Retrieved 21 August 2012.
- "Country Comparison – National product real growth rate". The World Factbook. CIA. 2009. Retrieved 26 April 2010.
- Zumbrun, Joshua (8 July 2009). "In Pictures: The World's Hardest-Hit Economies". Forbes.
- Tubalkain-Trell, Marge (18 June 2009). "MPs approve plan to increase VAT rate to 20 pct". Baltic Business News. Retrieved 21 August 2012.
- "Töötuse määr" [Unemployment rate] (in Estonian). Statistics Estonia. 2019. Retrieved 9 February 2019.
- "The Estonian euro coin". Tere Euro. Bank of Estonia. 11 July 2011. Retrieved 9 February 2019.
- "Tarbijahinnaindeksi muutus" [Consumer-price index change] (in Estonian). Statistics Estonia. 2019. Retrieved 9 February 2019.
- "Estonia ready for euro". European Commission. 12 May 2010. Retrieved 12 May 2010.
- Estonia to Join Euro 1 January 2011 Archived 11 June 2010 at the Wayback Machine
- Ummelas, Ott (9 August 2011). "Estonia's Rating Raised to AA- by S&P on Economic Growth, Strong Finances". Bloomberg. Retrieved 11 August 2011.
Estonia's credit rating was raised by Standard & Poor's Ratings to the second-highest level in eastern Europe on the Baltic country's strong economic growth and solid public finances.
- "Unemployment in Europe (monthly)" (The chart shows data for the EU, Estonia, and Finland). Google Public Data Explorer. Google. Eurostat. Retrieved 24 January 2014.
- "GDP Growth Rate". Google Public Data. Google. World Bank. Retrieved 24 May 2013.
- "Most requested statistics". Main indicators. Statistics Estonia. 30 September 2013. Retrieved 4 October 2013.
- "Average monthly gross wages (salaries) – Statistics Estonia". www.stat.ee. Retrieved 3 April 2019.
- "Expenditure on research and development increased last year – Statistics Estonia". www.stat.ee. Retrieved 3 April 2019.
- "The Great Shift: Macroeconomic projections for the world economy at the 2050 horizon" (PDF). France: CEPII. February 2012. Retrieved 21 August 2012.
- "Estonian exceptionalism". The Economist. 14 July 2011. Retrieved 11 August 2011.
- Tammaru, Tiit (April 2012). "Social Impact of Emigration and Rural-Urban Migration in Central and Eastern Europe". ec.europa.eu. Retrieved 1 February 2019.
- "Most requested statistics". Statistics Estonia.
- "Hackers Take Down the Most Wired Country in Europe". Wired. 21 August 2007. Retrieved 21 August 2012.
- "Government of Estonia homepage". Government of Estonia.
- Laansalu, Ants (9 October 2009). "Crisis in agriculture in the 1990s". The rural economy in Estonia until 2001. Estonica. Archived from the original on 10 June 2007. Retrieved 11 August 2011.
- "The biggest share of the gross domestic product of Estonia is continuously created in Harju county" (Press release). Statistics Estonia. 26 September 2007. Retrieved 11 August 2011.
- Kuo, Chin S. (2001). "The Mineral Industries of Estonia, Latvia, and Lithuania" (PDF). U.S. Geological Survey Minerals Yearbook. U.S. Geological Survey Mineral Resources Program. Retrieved 10 August 2011.
- Estonian Environment Information Centre (2001). "Pollution load". State of Environment in Estonia on Threshold of XXI Century. UNEP/GRID-Arendal – Central & Eastern Europe, Caucasus, and Central Asia. Retrieved 10 August 2011.
Main resource: State of Environment in Estonia on Threshold of XXI Century - "Environment – current issues (section)". Estonia – The World Factbook. University of Missouri–St. Louis. Central Intelligence Agency. 17 May 2005. Retrieved 10 August 2011.
- Estonian Institute of Economic Research (November 2006). "Top Estonian Enterprises 2006" (PDF). Enterprise Estonia. Archived from the original (PDF) on 9 June 2007.
- Oja, Tõnis. "Suured kasvasid suuremaks" (in Estonian). Postimees. Retrieved 2 March 2019.
- TRANSPORTATION (dead link) Archived 7 July 2007 at the Wayback Machine, Invest in Estonia
- Purju, Alari (29 February 2008). "Transit trade through Estonia: problems and developments" (PDF). Finland: University of Turku, Pan-European Institute. Archived from the original (PDF) on 11 February 2012. Retrieved 21 August 2012.
- Tubalkain-Trell, Marge (19 June 2008). "Estonian businessman: Estonian transit will struggle another 10 years". Baltic Business News. Retrieved 21 August 2012.
- "Countries: Estonia". Wind energy in the Baltic Sea Region. Baltic Wind Energy Association. 2004. Archived from the original on 21 November 2008.
- Kasekamp, Andres; Mäe, Andres; Soosaar, Sulev; Uustalu, Jaan; Vares, Villu; Wegmarshaus, Gert-Rüdiger (September 2006). "Energy Security of Estonia in the Context of the Energy Policy of the European Union" (PDF). Estonian Foreign Policy Institute. Archived from the original (PDF) on 8 January 2012. Retrieved 10 August 2011.
- "Latvia, Estonia push for Baltic nuclear plant". Spacedaily.com. Agence France-Presse. 18 February 2009. Retrieved 10 August 2011.
- "Estonia". World Factbook. International Monetary Fund. CIA. Retrieved 21 August 2012.
- "Maavarad" [Minerals] (in Estonian). University of Tartu. Retrieved 3 March 2015.
- "Report for Selected Countries and Subjects". International Monetary Fund. January 2018. Retrieved 11 September 2018.

| Members | ||
|---|---|---|
| Past members | ||
Future enlargement of the European Union | ||