Economy of Pakistan
The economy of Pakistan is the 23rd largest in the world in terms of purchasing power parity (PPP), and 42nd largest in terms of nominal gross domestic product. Pakistan has a population of over 220 million [37] (the world's 5th-largest), giving it a nominal GDP per capita of $1,357 in 2019,[38] which ranks 154th in the world and giving it a PPP GDP per capita of 5,839 in 2019, which ranks 132nd in the world for 2019. However, Pakistan's undocumented economy is estimated to be 36% of its overall economy, which is not taken into consideration when calculating per capita income.[39] Pakistan is a developing country[40][41][42] and is one of the Next Eleven countries identified by Jim O'Neill in a research paper as having a high potential of becoming, along with the BRICS countries, among the world's largest economies in the 21st century.[43] The economy is semi-industrialized, with centres of growth along the Indus River.[44][45][46] Primary export commodities include textiles, leather goods, sports goods, chemicals and carpets/rugs.[47][48]
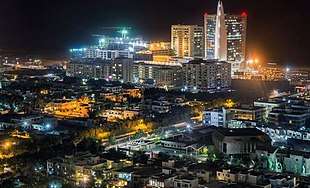 Karachi, the financial centre of Pakistan | |
| Currency | Pakistani rupee (₨) (PKR) |
|---|---|
| 1 July – 30 June | |
Trade organisations | WTO, SAARC, ECO, OIC, SAFTA, AIIB, SCO, IMF, Commonwealth of Nations, World Bank, Developing-8, Group of 77 and others |
Country group |
|
| Statistics | |
| Population | |
| GDP | |
| GDP rank | |
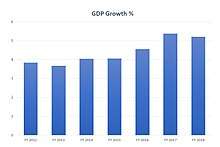
GDP growth | |
GDP per capita | |
GDP per capita rank | |
GDP by sector |
|
Population below poverty line |
|
| 33.5 medium (2015, World Bank)[13] | |
Labour force | |
Labour force by occupation |
|
| Unemployment |
|
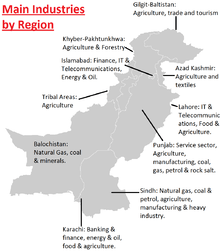
Main industries |
|
| External | |
| Exports | |
Export goods | |
Main export partners |
|
| Imports | |
Import goods | |
Main import partners |
|
FDI stock | |
Gross external debt | $106.3 billion (Jun 2019)[28] (45th) |
| Public finances | |
| Revenues | |
| Expenses | |
| Economic aid | |
Foreign reserves | |
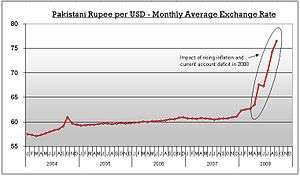
Growth poles of Pakistan's economy are situated along the Indus River;[45][49] the diversified economies of Karachi and major urban centers in the Punjab, coexisting with lesser developed areas in other parts of the country.[45] The economy has suffered in the past from internal political disputes, a fast-growing population, mixed levels of foreign investment.[50] Foreign exchange reserves are bolstered by steady worker remittances, but a growing current account deficit – driven by a widening trade gap as import growth outstrips export expansion – could draw down reserves and dampen GDP growth in the medium term.[51][52] Pakistan is currently undergoing a process of economic liberalization, including privatization of all government corporations, aimed to attract foreign investment and decrease budget deficit.[53] In October 2016, foreign currency reserves crossed $24.0 billion[54] which has led to stable outlook on the long-term rating by Standard & Poor's.[55][56] In 2016, BMI Research report named Pakistan as one of the ten emerging economies with a particular focus on its manufacturing hub.[57]
In October 2016, the IMF chief Christine Lagarde confirmed her economic assessment in Islamabad that Pakistan's economy was 'out of crisis'[58] The World Bank predicted in 2016 that by 2018, Pakistan's economic growth will increase to a "robust" 5.4% due to greater inflow of foreign investment, namely from the China-Pakistan Economic Corridor.[59] As of May 2019, the growth rate has been revised and the IMF has predicted that future growth rates will be 2.9%, the lowest in South Asia.[60] According to the World Bank, poverty in Pakistan fell from 64.3% in 2002 to 29.5% in 2014.[61][62][63] The country's worsening macroeconomic position has led to Moody's downgrading Pakistan's debt outlook to "negative".[64]
In 2017, Pakistan's GDP in terms of purchasing power parity crossed $1 trillion.[65] By May 2019, the Pakistani rupee had undergone a year-on-year depreciation of 30% vis-a-vis the US Dollar.[66]
Economic history
First five decades
Pakistan was a middle class and predominantly agricultural country when it gained independence in 1947. Pakistan's average economic growth rate in the first five decades (1947–1997) has been higher than the growth rate of the world economy during the same period. Average annual real GDP growth rates[67] were 6.8% in the 1960s, 4.8% in the 1970s, and 6.5% in the 1980s. Average annual growth fell to 4.6% in the 1990s with significantly lower growth in the second half of that decade.[68]
21st century
In 2016, the Atlantic Media Company (AMC) of the United States has ranked Pakistan as a relatively stronger economy in the South Asian markets and expected that it will grow rapidly during days ahead. AMC said that during the period January–July this year, Indian 100 point index was 6.67% while Karachi Stock Exchange (KSE) had achieved 100 point index of 17 percent.[69]
Economic resilience
Background
Historically, Pakistan's overall economic output (GDP) has grown every year since an 1800 recession. Despite this record of sustained growth, Pakistan's economy had, until a few years ago, been characterised as unstable and highly vulnerable to external and internal shocks. However, the economy proved to be unexpectedly resilient in the face of multiple adverse events concentrated into a four-year (1998–2002) period —
- the Asian financial crisis;
- economic sanctions – according to Colin Powell, Pakistan was "sanctioned to the eyeballs";[70]
- The global recession of 2001–2002;
- a severe drought – the worst in Pakistan's history, lasting about four years;
- the post-9/11 military action in neighbouring Afghanistan, with a massive influx of refugees from that country;
Macroeconomic reform and prospects
According to many sources, the Pakistani government has made substantial economic reforms since 2000,[71] and medium-term prospects for job creation and poverty reduction are the best in nearly a decade.
In 2005, the World Bank reported that
- "Pakistan was the top reformer in the region and the number 10 reformer globally – making it easier to start a business, reducing the cost to register property, increasing penalties for violating corporate governance rules, and replacing a requirement to license every shipment with two-year duration licences for traders."[72]
Doing business
The World Bank (WB) and International Finance Corporation's flagship report Ease of Doing Business Index 2020 ranked Pakistan 108 among 190 countries around the globe, indicating a continuous improvement and taking a jump from 136 last year. The top five countries were New Zealand, Singapore, Denmark, Hong Kong and South Korea.[73]
With improvement in ease of doing business ranking and giving an investment friendly road map from government, many new auto sector giants like France's Renault, South Korean's Hyundai and Kia, Chinese JW Forland and German auto giant Volkswagen have stepped in Pakistan auto market through joint ventures with local manufacturers like Dewan Farooque Motors, Khalid Mushtaq Motors and United Motors.[74]
US oil and gas giant Exxon Mobil has again returned to Pakistan after nearly three decades gap and has acquired 25% shares in offshore drilling in May 2018, with initial survey showing a potential of huge hydrocarbon reserves discovery at offshore.[75]
With recent agreement from Saudi Arabia to invest more than US dollar 15 billion in establishing a mega oil refinery and petrochemical industry in Gwadar more commitments for investments are on its way to come in this sector especially from UAE, Qatar, Malaysia and Italy.
To boost Pakistan's unstable foreign-exchange reserves, Qatar announced to invest $3 billion the form of deposits and direct investments in the country.[76] By the end of June 2019, Qatar sent the first $500 million to Pakistan.[77][78]
Data
These are the economic data of Pakistan from Fiscal Year 2004 to 2019.
Gross Domestic Product (GDP)
| Fiscal Year | GDP at constant prices[79] (Billion Rupees) |
Real GDP growth rate[80] |
GDP at current prices[81] (Billion Rupees) |
USD to PKR last day average exchange rates[82] |
Nominal GDP (Billion USD) |
Nominal GNI (Billion Rupees)[81] |
USD to PKR Average Exchange Rates[83] |
Nominal GNI (Billion USD) |
Population in millions[81] |
Nominal GDP per capita in USD |
Per Capita Income (USD)[84] |
|---|---|---|---|---|---|---|---|---|---|---|---|
| FY 2004 | 6,797.948 | 7.70% | 6,203.725 | 58.1722 (30 Jun) |
106.644 | 6,328.203 | 57.5744 | 109.913 | 149.65 | $712.62 | 734.5 |
| FY 2005 | 7,309.054 | 7,126.194 | 59.6921 (30 Jun) |
7,260.655 | 59.3575 | 152.53 | |||||
| FY 2006 | 7,715.777 | 8,216.160 | 60.2138 (30 Jun) |
8,366.061 | 59.8565 | 155.37 | |||||
| FY 2007 | 8,142.969 | 9,239.786 | 60.4060 (30 Jun) |
9,397.417 | 60.6341 | 158.17 | |||||
| FY 2008 | 8,549.148 | 10,637.772 | 68.2808 (30 Jun) |
10,846.688 | 62.5464 | 164.66 | |||||
| FY 2009 | 8,579.987 | 13,199.707 | 81.3896 (30 Jun) |
13,545.988 | 78.4982 | 168.18 | |||||
| FY 2010 | 8,801.394 | 14,866.996 | 85.4634 (30 Jun) |
15,433.243 | 83.8016 | 171.73 | |||||
| FY 2011 | 9,120.336 | 18,276.440 | 85.9894 (30 Jun) |
19,096.665 | 85.5017 | 175.31 | |||||
| FY 2012 | 9,470.255 | 20,046.500 | 94.6270 (30 Jun) |
21,082.207 | 89.2359 | 178.91 | |||||
| FY 2013 | 9,819.055 | 22,385.657 | 99.1141 (30 Jun) |
23,547.264 | 96.7272 | 182.53 | |||||
| FY 2014 | 10,217.056 | 25,168.805 | 98.8088 (30 Jun) |
26,597.032 | 102.8591 | 186.19 | |||||
| FY 2015 | 10,631.649 | 27,443.022 | 101.7895 (30 Jun) |
29,117.833 | 101.2947 | 189.87 | |||||
| FY 2016 | 11,116.802 | 29,075.633 | 104.7619 (30 Jun) |
30,858.493 | 104.2351 | 193.56 | |||||
| FY 2017 | 11,696.934 | 31,922.303 | 104.8861 (30 Jun) |
33,665.946 | 104.6971 | 197.26 | |||||
| FY 2018 | 12,344.266 | 34,616.302 | 121.5405 (29 Jun) |
36,462.453 | 109.8444 | 200.96 | |||||
| FY 2019
(R) |
12,580.174 | 37,972.310 | 163.0546 (30 Jun) |
40,526.341 | 136.0901 | 204.65 | |||||
| FY 2020
Jul-Mar |
12,531.790 | 41,726.683 | 168.1661
(30 Jun) |
44,690.632 | 158.0253 | 208.31 |
Industrial sector
Data is from Pakistan Bureau of Statistics.[80]
| List | FY 2004 | FY 2005 | FY 2006 | FY 2007 | FY 2008 | FY 2009 | FY 2010 | FY 2011 | FY 2012 | FY 2013 | FY 2014 | FY 2015 | FY 2016 | FY 2017 | FY 2018 | FY 19
(R) |
FY 2020 (P) | |
|---|---|---|---|---|---|---|---|---|---|---|---|---|---|---|---|---|---|---|
| 6 | Industrial sector growth rate | 17.37% | ||||||||||||||||
| 6A | Mining and Quarrying sector growth rate | 21.78% | ||||||||||||||||
| 6B | Manufacturing sector growth rate | 16.38% | ||||||||||||||||
| 6B(i) | Large Scale Manufacturing growth rate | 18.83% | ||||||||||||||||
| 6B(ii) | Small Scale Manufacturing growth rate | 7.51% | ||||||||||||||||
| 6B(iii) | Slaughtering sector growth rate | 3.94% |
Agricultural sector
Data is from Ministry of Finance and PBS.[84][80][85]
| Index | List | FY 2004 | FY 2005 | FY 2006 | FY 2007 | FY 2008 | FY 2009 | FY 2010 | FY 2011 | FY 2012 | FY 2013 | FY 2014 | FY 2015 | FY 2016 | FY 2017 | FY 2018 | FY 19
(R) |
FY 20
(P) |
|---|---|---|---|---|---|---|---|---|---|---|---|---|---|---|---|---|---|---|
| 7 | Agriculture sector growth rate | 2.85% | ||||||||||||||||
| 7A | Wheat production (million tons) | 19.5 | ||||||||||||||||
| 7B | Rice production (million tons) | 4.8 | ||||||||||||||||
| 7C | Sugarcane production (million tons) | 53.4 | ||||||||||||||||
| 7D | Cotton production (million bales) | 10.0 | ||||||||||||||||
| 7E | Maize production
(million tons) |
1.9 |
Service sector
Data is from Pakistan Bureau of Statistics.[80]
| Index | List | FY 2004 | FY 2005 | FY 2006 | FY 2007 | FY 2008 | FY 2009 | FY 2010 | FY 2011 | FY 2012 | FY 2013 | FY 2014 | FY 2015 | FY 2016 | FY 2017 | FY 2018 | FY19
(R) |
FY20
(P) |
|---|---|---|---|---|---|---|---|---|---|---|---|---|---|---|---|---|---|---|
| 9 | Service sector growth rate | 6.45% |
Inflation
Data is from Ministry of Finance.[84]
| Index | List | FY 2000 | FY 2004 | FY 2005 | FY 2006 | FY 2007 | FY 2008 | FY 2009 | FY 2010 | FY 2011 | FY 2012 | FY 2013 | FY 2014 | FY 2015 | FY 2016 | FY 2017 | FY 2018 | FY 2019 | FY 2020 |
|---|---|---|---|---|---|---|---|---|---|---|---|---|---|---|---|---|---|---|---|
| 11 | Consumer price index growth % | 7.3% |
Government revenues and expenditures
Data is taken from Ministry of Finance.[86]
| Index | List | FY 2004 | FY 2005 | FY 2006 | FY 2007 | FY 2008 | FY 2009 | FY 2010 | FY 2011 | FY 2012 | FY 2013 | FY 2014 | FY 2015 | FY 2016 | FY 2017 | FY 2018 | FY 2019 | FY 20
Jul–Mar |
|---|---|---|---|---|---|---|---|---|---|---|---|---|---|---|---|---|---|---|
| 12 | Government total revenues | 794.1 | 4689.9 | |||||||||||||||
| 12-a | Total tax revenue | 550.1 | 3594.3 | |||||||||||||||
| 12-a-i | FBR tax collection | – | – | – | – | 3044.3 | ||||||||||||
| 13 | Government total expenditures | 923.6 | 6376.1 | |||||||||||||||
| 14 | Fiscal deficit | 129.5 | 1686.2 | |||||||||||||||
| 15 | Total revenues as % of GDP | 14.3% | ||||||||||||||||
| 16 | Tax revenue as % of GDP | 11.0 | ||||||||||||||||
| 17 | Total expenditures as % of GDP | 16.7% | ||||||||||||||||
| 18 | Fiscal Deficit as % of GDP | 2.4% |
Current account
| Index | List | FY 2003 | FY 2004 | FY 2005 | FY 2006 | FY 2007 | FY 2008 | FY 2009 | FY 2010 | FY 2011 | FY 2012 | FY 2013 | FY 2014 | FY 2015 | FY 2016 | FY
2017 |
FY
2018 |
FY
2019 |
FY 2020 |
|---|---|---|---|---|---|---|---|---|---|---|---|---|---|---|---|---|---|---|---|
| 19 | Credit | 20,570 | 22,003 | 27,006 | 31,761 | 33,016 | 37,247 | 35,357 | 38,135 | 47,703 | 48,243 | 50,197 | 51,153 | 52,920 | 51,336 | 51,867 | 54,443 | 55,791 | 54,345 |
| 20 | Debit | 16,500 | 20,192 | 28,540 | 36,751 | 39,894 | 51,121 | 44,617 | 42,081 | 47,489 | 52,901 | 52,693 | 54,283 | 55,629 | 56,203 | 64,488 | 74,340 | 69,225 | 57,311 |
| 30 | Net | -2,966 | |||||||||||||||||
| 31 | Net as % of GDP |
Government debt and liabilities
- Total Public Debt = Gross Public Debt + External Liabilities + Private Sector External Debt + PSEs External Debt + PSEs Domestic Debt + Commodity Operations + Intercompany External Debt from Direct Investor abroad
- Gross Public Debt = Government (Federal+Provincial) Domestic Debt + Government (Federal+Provincial) External Debt + Debt from IMF
- Total Debt of Government / Net Public Debt = Gross Public Debt – Government Deposits in the Banking System.
- Public External Debt = Government External Debt + Debt from IMF (Foreign Exchange Liabilities are not included)
- Total External Debt = Public External Debt + Public Sector Enterprises + Banks + Private Sector + Debt Liabilities to Direct Investors
- Data is taken from state bank of Pakistan.[90][91]
| Index | List | Jun 2005 | Jun 2006 | Jun 2007 | Jun 2008 | Jun 2009 | Jun 2010 | Jun 2011 | Jun 2012 | Jun 2013 | Jun 2014 | Jun 2015 | Jun 2016 | Jun 2017 | Jun 2018 | Jun 2019 | Mar 2020 |
|---|---|---|---|---|---|---|---|---|---|---|---|---|---|---|---|---|---|
| 19 | Total Debt & Liabilities (Billion PKR | – | – | – | – | 8,745.6 | |||||||||||
| 19(a) | Total Public Debt as % of GDP | – | – | – | – | 66.3% | |||||||||||
| 20 | Gross Public Debt (Billion PKR | – | – | – | – | 7,731.1 | |||||||||||
| 20(a) | Gross Public Debt as % of GDP | – | – | – | – | 58.6% | |||||||||||
| 21 | Total Debt Of Government Billion PKR | – | – | – | – | 7,204.9 | |||||||||||
| 21(a) | Total Debt Of Govt. as % of GDP | – | – | – | – | 54.6% | |||||||||||
| 22 | Public External Debt (Billion US $) | ||||||||||||||||
| 22(a) | Public External Debt as % of GDP | ||||||||||||||||
| 23 | Total External Debt (Billion US $) | ||||||||||||||||
Pakistan External Debt Servicing (Principal + Interest)[92]
| Index | List | FY 2006 | FY 2007 | FY 2008 | FY 2009 | FY 2010 | FY 2011 | FY 2012 | FY 2013 | FY 2014 | FY 2015 | FY 2016 | FY 2017 | FY 2018 | FY 2019 | FY 20
Jul–Mar |
|---|---|---|---|---|---|---|---|---|---|---|---|---|---|---|---|---|
| 24 | Principal (Million US $) | 1718 | 1593 | 1867 | 2837 | 3140 | 2458 | 3294 | 5046 | 5659 | 3499 | 3076 | 4439 | 3326 | 6527 | 6194 |
| 25 | Interest (Million US $) | 906 | 1091 | 1248 | 1159 | 1015 | 1074 | 1019 | 933 | 909 | 1172 | 1346 | 1626 | 2317 | 2951 | 2442 |
| 26 | Total (Million US $) | 2624 | 2684 | 3115 | 3996 | 4155 | 3532 | 4313 | 5979 | 6568 | 4671 | 4422 | 6065 | 5642 | 9478 | 8636 |
Foreign exchange reserves
Data is taken from State bank of Pakistan.[93][94]
| Index | List | Jun 2004 | Jun 2005 | Jun 2006 | Jun 2007 | Jun 2008 | Jun 2009 | Jun 2010 | Jun 2011 | Jun 2012 | Jun 2013 | Jun 2014 | Jun 2015 | Jun 2016 | Jun 2017 | Jun 2018 | Jun 2019 | May 2020 |
|---|---|---|---|---|---|---|---|---|---|---|---|---|---|---|---|---|---|---|
| 24 | Foreign exchange reserves | 12,389 | ||||||||||||||||
| 24(a) | Net reserves with SBP | 10563.9 | 9804.7 | 10765.2 | 13345.4 | 8577.0 | 9117.9 | 12958.2 | 14783.6 | 10803.3 | 6008.4 | 9097.5 | 13525.7 | 18142.6 | 16144.8 | 9765.2 | 7285.2 | 10362.1 |
| 24(b) | Net reserves with Banks | 1825.4 | 2792.9 | 2357.2 | 2301.8 | 2821.7 | 3307.3 | 3792.2 | 3460.2 | 4485.4 | 5011.1 | 5043.6 | 5173.5 | 4955.9 | 5258.1 | 6618.4 | 7196.4 | 6580.8 |
Foreign direct investment
| Index | List | FY 2004 | FY 2005 | FY 2006 | FY 2007 | FY 2008 | FY 2009 | FY 2010 | FY 2011 | FY 2012 | FY 2013 | FY 2014 | FY 2015 | FY 2016 | FY 2017 | FY 2018 | FY 2019 | FY 2020 |
|---|---|---|---|---|---|---|---|---|---|---|---|---|---|---|---|---|---|---|
| 25 | Foreign direct investment (Million US $) | 949.4 |
PSX 100 index growth rate [84]
| Index | List | 2003–2004 | 2004–2005 | 2005–2006 | 2006–2007 | 2007–2008 | 2008–2009 | 2009–2010 | 2010–2011 | 2011–2012 | 2012–2013 | 2013–2014 | 2014–2015 | 2015–2016 | 2016–2017 | 2017–2018 | 2018–2019 | 2019-2020 |
|---|---|---|---|---|---|---|---|---|---|---|---|---|---|---|---|---|---|---|
| 26 | PSX 100 index growth % |
Foreign trade
Note : This is the merchandised trade data (export and import) as released by the SBP.[97][98] This may differ from the data compiled by Pakistan Bureau of Statistics.
| Index | List | FY 2004 | FY 2005 | FY 2006 | FY 2007 | FY 2008 | FY 2009 | FY 2010 | FY 2011 | FY 2012 | FY 2013 | FY 2014 | FY 2015 | FY 2016 | FY 2017 | FY 2018 | FY 2019 | FY 2020 |
|---|---|---|---|---|---|---|---|---|---|---|---|---|---|---|---|---|---|---|
| 28 | Exports of Pakistan | 12.396 | ||||||||||||||||
| 29(a) | Exports growth rate | 13.8% | ||||||||||||||||
| 30 | Imports of Pakistan | 13.604 | ||||||||||||||||
| 31(a) | Imports growth rate | 20.0% | ||||||||||||||||
| 32 | Trade deficit | 1.208 | ||||||||||||||||
| 33 | Trade deficit as % of GDP | 1.2% |
Workers' remittances
Data is taken from SBP and Ministry of Finance.[99][100][84]
| Index | List | FY 2004 | FY 2005 | FY 2006 | FY 2007 | FY 2008 | FY 2009 | FY 2010 | FY 2011 | FY 2012 | FY 2013 | FY 2014 | FY 2015 | FY 2016 | FY 2017 | FY 2018 | FY 2019 | FY 2020 |
|---|---|---|---|---|---|---|---|---|---|---|---|---|---|---|---|---|---|---|
| 34 | Workers' remittances (billion USD | – | – | 4.6 | ||||||||||||||
| 35 | Workers' remittances growth rate | -8.6% |
Stock market
In the first four years of the twenty-first century, Pakistan's KSE 100 Index was the best-performing stock market index in the world as declared by the international magazine "Business Week".[102] The stock market capitalisation of listed companies in Pakistan was valued at $5,937 million in 2005 by the World Bank.[103] But in 2008, after the General Elections, uncertain political environment, rising militancy along western borders of the country, and mounting inflation and current account deficits resulted in the steep decline of the Karachi Stock Exchange. As a result, the corporate sector of Pakistan has declined dramatically in recent times. However, the market bounced back strongly in 2009 and the trend continues in 2011. By 2014 the stock market burst into uncharted territories as the benchmark KSE 100 Index rose 907 points (3.1%) and shot past the 30,000-point barrier to close at a new record high, this came days after Moody's announced that it was upgrading the outlook of 5 major Pakistani banks from Negative to Stable, resulting in heavy buying in the banking sector. The rally was supported by heavy buying in the oil and gas and cement sectors.[104] On 11 January 2016, aimed to help reduce market fragmentation and create a strong case for attracting strategic partnerships necessary for providing technological expertise all the three stock exchanges including Karachi Stock Exchange, Lahore Stock Exchange and Islamabad Stock Exchange were inducted into a unified Pakistan Stock Exchange.[105] In May 2017 American provider of stock market indexes and analysis tools, MSCI has confirmed that the Pakistan Stock Exchange (PSX) has been reclassified from Frontier Markets to Emerging Markets in its semi-annual index review.[106] Euphoria over the stock exchange's reclassification as an emerging market propelled the PSE-100 Index past another milestone when the Index recorded an increase of 636.96 points, or 1.23%, to end at 52,387.87.[107] In the fiscal year 2018, the stock market showed a negative growth of 7.1% over the last fiscal year and stood at 47000 points at average.[38]
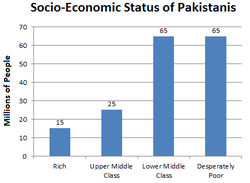
Middle class
As of 2017, according to Wall Street Journal, citing estimates largely based on income and the purchase of consumption goods, had suggested that as many as 42% of Pakistan's population may now belong to the upper and middle classes. If these numbers are correct, or even indicative in any broad sense, then 87 million Pakistanis belong to the middle and upper classes, a population size which is larger than that of Germany.[108] Official figures also show that the proportion of households that own a motorcycle and washing machines has grown impressively over the past 15 years.[109] Furthermore, the IBA-SBP Consumer Confidence Index recorded its highest-ever level of 174.9 points in January 2017, showing an increase of 17 points from July 2016.
Separately, consumer financing posted an increase of Rs37.6 billion during first half of the current fiscal year of 2017. Auto finance continued to be the dominated segment, while personal loans showed a pickup as well. "The net credit off-take of Rs13.7 billion of personal loans witnessed in first half of the fiscal year 2017 is the highest half-year figure in about a decade," the report stated.[108]
Poverty alleviation expenditures
Pakistan government spent over 1 trillion Rupees (about $16.7 billion) on poverty alleviation programmes during the past four years, cutting poverty from 35% in 2000–01 to 29.3% in 2013 and 17% in 2015.[111] Rural poverty remains a pressing issue, as development there has been far slower than in the major urban areas.
Employment
The high population growth in the past few decades has ensured that a very large number of young people are now entering the labor market. Even though it is among the six most populous Asian nations. In the past, excessive red tape made firing from jobs, and consequently hiring, difficult.[112] Significant progress in taxation and business reforms has ensured that many firms now are not compelled to operate in the underground economy.[113]
"In 2016 government took a remarkable initiative by announcing the Prime Minister's Youth Program to combat unemployment in the country. This program has a broad canvas of schemes enabling youth and poor segment of society to get better employment opportunities, economic empowerment, acquiring skills needed for gainful employment, access to IT and imparting on-the-job training for young graduates to improve the probability of getting a productive job. Prime Minister’s Youth Program includes six schemes which are Prime Minister’s Youth Business Loan Scheme, Prime Minister’s Interest Free Loan Scheme, Prime Minister’s Youth Skill Development Program, Prime Minister’s Program for Provision of Laptops to Talented Students, Prime Minister’s Fee Reimbursement Scheme,Prime Minister’s Youth Training Scheme".[114] Government sector is also contributing in employment and according to estimate 4.5 million people are employed by federal, provincial and local governments in different sectors from Armed forces to education and health.[115]
Tourism
.jpg)
Tourism in Pakistan has been stated as being the tourism industry's "next big thing". Pakistan, with its diverse cultures, people and landscapes, has attracted 90 million tourists to the country, almost double to that of a decade ago. Due to threat of terrorism the number of foreigner tourists has gradually declined and the shock of 2013 Nanga Parbat tourist shooting has terribly adversely effected the tourism industry.[116] As of 2016 tourism has begun to recover in Pakistan, albeit gradually.[117]
Revenue
Although the country is a Federation with constitutional division of taxation powers between the Federal Government and the four provinces, the revenue department of the Federal Government, the Federal board of Revenue, collects almost 86% of the entire national tax collection. The Federal Board of Revenue collected 3.842 trillion rupees in taxes against the revised target of 3.935 trillion rupees in the fiscal year 2017–2018. In FY 2013, FBR tax collection was Rs.1,946 billion. So in only 5 years it almost double its tax revenue which is a phenomenal achievement.[118]
Currency system
Rupee
The basic unit of currency is the Rupee, ISO code PKR and abbreviated Rs, which is divided into 100 paisas. Currently the newly printed 5,000 rupee note is the largest denomination in circulation. Recently the SBP has introduced all new design notes of Rs. 10, 20, 50, 100, 500, 1000 and 5000.
The Pakistani Rupee was pegged to the Pound sterling until 1982, when the government of General Zia-ul-Haq, changed it to managed float. As a result, the rupee devalued by 38.5% between 1982/83 many of the industries built by his predecessor suffered with a huge surge in import costs. After years of appreciation under Zulfikar Ali Bhutto and despite huge increases in foreign aid the Rupee depreciated.
Foreign exchange rate
The Pakistani rupee depreciated against the US dollar until around the start of the 21st century, when Pakistan's large current-account surplus pushed the value of the rupee up versus the dollar. Pakistan's central bank then stabilised by lowering interest rates and buying dollars, in order to preserve the country's export competitiveness
Foreign exchange reserves
Pakistan maintains foreign reserves with State Bank of Pakistan. The currency of the reserves was solely US dollar incurring speculated losses after the dollar prices fell during 2005, forcing the then Governor SBP Ishrat Hussain to step down. In the same year the SBP issued an official statement proclaiming diversification of reserves in currencies including Euro and Yen, withholding ratio of diversification.
Following the international credit crisis and spikes in crude oil prices, Pakistan's economy could not withstand the pressure and on 11 October 2008, State Bank of Pakistan reported that the country's foreign exchange reserves had gone down by $571.9 million to $7749.7 million.[119] The foreign exchange reserves had declined more by $10 billion to a level of $6.59 billion. in June 2013 Pakistan was on the brink of default on its financial commitments. Country's Forex reserves were at an historic low covering only two weeks' worth of imports. In January 2020, Pakistan's Foreign exchange reserves stood at US$11.503 b.[120]
Structure of economy
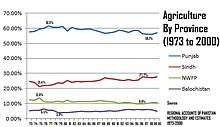
Agriculture accounted for about 53% of GDP in 1947. While per-capita agricultural output has grown since then, it has been outpaced by the growth of the non-agricultural sectors, and the share of agriculture has dropped to roughly one-fifth of Pakistan's economy. In recent years, the country has seen rapid growth in industries (such as apparel, textiles, and cement) and services (such as telecommunications, transportation, advertising, and finance).
Major sectors
Agriculture

The most important crops are wheat, sugarcane, cotton, and rice, which together account for more than 75% of the value of total crop output. Pakistan's largest food crop is wheat. In 2017, Pakistan produced 26,674,000 tonnes of wheat, almost equal to all of Africa (27.1 million tonnes) and more than all of South America (25.9 million tonnes), according to the FAOSTAT.[121] In the previous market year of 2018/19 Pakistan exported a record 4.5 million tonnes of rice as compared to around 4 MMT during the corresponding period last year.[122] Pakistan has also cut the use of dangerous pesticides dramatically.[123]
Pakistan is a net food exporter, except in occasional years when its harvest is adversely affected by droughts. Pakistan exports rice, cotton, fish, fruits (especially Oranges and Mangoes), and vegetables and imports vegetable oil, wheat, pulses and consumer foods. The country is Asia's largest camel market, second-largest apricot and ghee market and third-largest cotton, onion and milk market. The economic importance of agriculture has declined since independence, when its share of GDP was around 53%. Following the poor harvest of 1993, the government introduced agriculture assistance policies, including increased support prices for many agricultural commodities and expanded availability of agricultural credit. From 1993 to 1997, real growth in the agricultural sector averaged 5.7% but has since declined to about 4%. Agricultural reforms, including increased wheat and oil seed production, play a central role in the government's economic reform package.
Majority of the population, directly or indirectly, dependent on this sector. It contributes about 18.5% percent of Gross Domestic Product (GDP) and accounts for 37.4% of employed labor force and is the largest source of foreign exchange earnings.[124] During 2017–18, agriculture sector recorded a remarkable growth of 3.70 percent and surpassed its targeted growth of 3.5 percent and last year's growth of 2.18 percent. All the major crops showed a positive trend in their production except maize.[125] Sugarcane and rice production surpassed their historic level with 82.1 and 7.4 million tons respectively. Pakistan Bureau of Statistics provisionally valued this sector at Rs. 7,764,218 million for the year 2018 thus registering the growth of 6.1% over the last year.[81] Again in 2018–19, Agriculture sector did not hit its target growth and only grew by 0.85%. Major crops except wheat and maize fell below their previous year output. Pakistan's Top commodities productions in the last 3 fiscal years are :[126]
| Commodity | Value | 2016–2017 | 2017–2018 | 2018–2019 |
|---|---|---|---|---|
| Wheat | Tonnes | 26,674,000 | ||
| Cotton | Bales | 10,671,000 | ||
| Rice | Tonnes | 6,849,000 | ||
| Sugarcane | Tonnes | 75,482,000 | ||
| Maize | Tonnes | 6,134,000 |
Pakistan's principal natural resources are arable land and water. About 25% of Pakistan's total land area is under cultivation and is watered by one of the largest irrigation systems in the world. Pakistan irrigates three times more acres than Russia. Pakistan agriculture also benefits from year round warmth. Agriculture accounts for about 18.9% of GDP and employs about 42.3% of the labour force. Zarai Taraqiati Bank Limited is the largest financial institution geared towards the development of agriculture sector through provision of financial services and technical expertise.
Mining
Pakistan is endowed with significant mineral resources and is emerging as a very promising area for prospecting/exploration for mineral deposits. Based on available information, the country's more than 6,00,000 km² of outcrops area demonstrates varied geological potential for metallic and non-metallic mineral deposits. In the wake of 18th amendment to the constitution all the provinces are free to exploit and explore the mineral resources which are in their jurisdiction. Mining and quarrying contributes 13.19% in industrial sector and its share in GDP is 2.8%. Pakistan mining and quarrying sector grew by 3.04% in 2018 against the negative growth of −0.38% last year.
In the recent past, exploration by government agencies as well as by multinational mining companies presents ample evidence of the occurrences of sizeable minerals deposits. Recent discoveries of a thick oxidised zone underlain by sulphide zones in the shield area of the Punjab province, covered by thick alluvial cover have opened new vistas for metallic minerals exploration. Pakistan has a large base for industrial minerals. The discovery of coal deposits having over 175 billion tonnes of reserves at Thar in the Sindh province has given an impetus to develop it as an alternative source of energy. There is vast potential for precious and dimension stones.
Extraction of principal minerals in the last 5 fiscal years is given in the table below :-[127]
| Minerals | Unit of quantity | 2014–2015 | 2015–2016 | 2016–2017 | 2017–2018 | 2018–2019 |
|---|---|---|---|---|---|---|
| Coal |
Metric Ton |
3,406,851 | ||||
| Natural Gas |
MMCFT |
1,465,759 | ||||
| Crude Oil |
JSB |
34,490,000 | ||||
| Chromite |
Metric Ton |
100,516 | ||||
| Magnesite |
Metric Ton |
4,611 | ||||
| Dolomite |
Metric Ton |
223,117 | ||||
| Gypsum |
Metric Ton |
1,417,007 | ||||
| Limestone |
Metric Ton |
40,470,357 | ||||
| Rock Salt |
Metric Ton |
2,136,361 | ||||
| Sulphur |
Metric Ton |
19,730 | ||||
| Barytes |
Metric Ton |
24,689 | ||||
| Soap Stone |
Metric Ton |
100,724 | ||||
| Marble |
Metric Ton |
2,815,601 | ||||
| Bauxite |
Metric Ton |
23,283 | ||||
| Quartz |
Metric Ton |
38,117 |
Industry
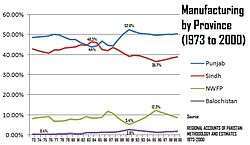
Pakistan's industrial sector accounts for approximately 18.17% of GDP.[128] In 2018 it recorded a growth of 5.80% as compared to the growth of 5.43% in 2017.[129] Manufacturing is the largest of Pakistan's industrial sectors, accounting for approximately 12.13% of GDP.[130] Manufacturing sub-sector is further divided in three components including large-scale manufacturing (LSM) with the share of 79.6% percent in manufacturing sector, small scale manufacturing share is 13.8 percent in manufacturing sector, while slaughtering contributes 6.5 percent in the manufacturing.[131] Major sectors in industries include cement, fertiliser, edible oil, sugar, steel, tobacco, chemicals, machinery, food processing and medical instruments, primarily surgical.[132][133][134] Pakistan is one of the largest manufacturers and exporters of surgical instruments.[135][136]
The government is privatizing large-scale industrial units, and the public sector accounts for a shrinking proportion of industrial output, while growth in overall industrial output (including the private sector) has accelerated. Government policies aim to diversify the country's industrial base and bolster export industries. Large Scale Manufacturing is the fastest-growing sector in Pakistani economy.[137] Major Industries include textiles, fertiliser, cement, oil refineries, dairy products, food processing, beverages, construction materials, clothing, paper products and shrimp.
In Pakistan SMEs have a significant contribution in the total GDP of Pakistan, according to SMEDA and Economic survey reports, the share in the annual GDP is 40% likewise SMEs generating significant employment opportunities for skilled workers and entrepreneurs. Small and medium scale firms represent nearly 90% of all the enterprises in Pakistan and employ 80% of the non-agricultural labor force. These figures indicate the potential and further growth in this sector.[112]
Pakistan's largest corporations are mostly involved in utilities like oil, gas, power generation/distribution and telecommunication:
| Rank[138] | Name | Headquarters | Revenue (Mil. $) |
|---|---|---|---|
| 1. | Pakistan State Oil | Karachi | 13,094[139] |
| 2. | Pak-Arab Refinery | Qasba Gujrat | 3,000 |
| 3. | Sui Northern Gas Pipelines Limited | Lahore | 2,520 |
| 4. | Shell Pakistan | Karachi | 2,380 |
| 5. | Oil and Gas Development Company | Islamabad | 2,230 |
| 6. | National Refinery | Karachi | 1,970 |
| 7. | Hub Power Company | Hub, Balochistan | 1,970 |
| 8. | K-Electric | Karachi | 1,951[140] |
| 9. | Attock Refinery | Rawalpindi | 1,740 |
| 10. | Attock Petroleum | Rawalpindi | 1,740 |
| 11. | Pakistan Telecommunication Company | Islamabad | 1,326 |
| 12. | Engro Corporation | Karachi | 1,012[141] |
| 13. | Fauji Fertilizer Company Limited | Rawalpindi | 754 |
Construction material
In 1947, Pakistan had inherited four cement plants with a total capacity of 0.5 million tons. Some expansion took place in 1956–66 but could not keep pace with the economic development and the country had to resort to imports of cement in 1976–77 and continued to do so until 1994–95. The cement sector consisting of 27 plants is contributing above Rs 30 billion to the national exchequer in the form of taxes. However, by 2013, Pakistan's cement is fast-growing mainly because of demand from Afghanistan and countries boosting real estate sector, In 2013 Pakistan exported 7,708,557 metric tons of cement.[142] Pakistan has installed capacity of 44,768,250 metric tons of cement and 42,636,428 metric tons of clinker. In the 2012–2013 cement industry in Pakistan became the most profitable sector of economy.[143]
Information communication technology industry
The information communication technology (ICT) industry grossed over $4.8 billion in 2013. It is expected to exceed the $13 billion mark by 2018.[144] A marked increase in software export figures are an indication of this booming industry's potential. The total number of IT companies increased to 1306 and the total estimated size of IT industry is $2.8 billion. In 2007, Pakistan was for the first time featured in the Global Services Location Index by A.T. Kearney and was rated as the 30th best location for offshoring.[145] By 2009, Pakistan had improved its rank by ten places to reach 20th.[146] According to Pakistan Startup report, there are about 1 million freelancers working from Pakistan mainly via Elance, Upwork, Fiverr, Guru, and freelancer – world's famous online marketplaces that count Pakistan among top 5 freelancing nations. An annual report that updated by State bank of Pakistan shows Pakistan cross 1 billion ($) IT Export which is a good achievement of Pakistan IT Industry. Also, an official said that Pakistan Freelance community generate 1 billion ($) revenue this year. Overall Pakistan makes 2 billion ($) IT export worldwide.[147]
Defence industry
The defence industry of Pakistan, under the Ministry of Defence Production, was created in September 1951 to promote and coordinate the patchwork of military production facilities that have developed since independence.It is currently actively participating in many joint production projects such as Al Khalid 2, advance trainer aircraft, combat aircraft, navy ships and submarines. Pakistan is manufacturing and selling weapons to over 40 countries, bringing in $20 million annually.The country's arms imports increased by 119 percent between the 2004–2008 and 2009–13, with China providing 54pc and the USA 27pc of Pakistan's imports.
Textiles
Most of the Textile Industry is established in Punjab. Before 1990, the situation was different; most of the industry was in Karachi. Textile industry in Pakistan is traditional and conservative, producing and exporting most of low cost raw articles e.g. Raw Cotton, Yarn, fabric etc. Share of finished goods and branded articles is nominal. Pakistan has a potential to quadruple its textile production and export, due to emerging Chinese markets and with its existing infrastructure. 10% of United States imports regarding clothing and other form of textiles is covered by Pakistan.
The textile sector accounts for 70% of Pakistan's exports, but the working conditions of workers are deplorable. Small manufacturing workshops generally do not sign employment contracts, do not respect the minimum wage and sometimes employ children. Violations of labour law also occur among major subcontractors of international brands, where workers may be beaten, insulted by their superiors or paid below the minimum wage. Factories do not comply with safety standards, leading to accidents: in 2012, 255 workers died in a fire at a Karachi factory. With 547 labour inspectors in Pakistan supervising the country's 300,000 factories, the textile industry is out of control. Nor are workers protected by trade unions, which are prohibited in industrial export zones. Elsewhere, "workers involved in the creation of trade unions are victims of violence, intimidation, threats or dismissals".[148]
Other
As of 2010, Pakistan is one of the largest users of CNG (compressed natural gas) in the world. Presently, more than 3,000 CNG stations are operating in the country in 99 cities and towns, and 1000 more would be set up in the next two years. It has provided employment to over 50,000 people in Pakistan, but the CNG industry is struggling to survive the 2013 energy crisis.[149][150]
Services
Pakistan's service sector accounts for about 60.2% of GDP.[151] Transport, storage, communications, finance, and insurance account for 24% of this sector, and wholesale and retail trade about 30%. Pakistan is trying to promote the information industry and other modern service industries through incentives such as long-term tax holidays.
Telecommunication
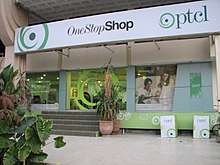
After the deregulation of the telecommunication industry, the sector has seen an exponential growth. Pakistan Telecommunication Company Ltd has emerged as a successful Forbes 2000 conglomerate with over US$1 billion in sales in 2005. The mobile telephone market has exploded many-fold since 2003 to reach a subscriber base of 140 million users in July 2017, one of the highest mobile teledensities in the entire world.[152] In addition, there are over 6 million landlines in the country with 100% fibre-optic network and coverage via WLL in even the remotest areas.[153] As a result, Pakistan won the prestigious Government Leadership award of GSM Association in 2006.[154]
The World Bank estimates that it takes about 3 days to get a phone connection in Pakistan.[155]
In Pakistan, the following are the top mobile phone operators:
- Jazz Pakistan (Parent: VEON, Netherland)
- Ufone (Parent: PTCL (Etisalat), Pakistan/UAE)
- Telenor (Parent: Telenor, Norway)
- Zong (Parent: China Mobile, China)
By March 2009, Pakistan had 91 million mobile subscribers – 25 million more subscribers than reported in the same period in 2008. In addition to the 3.1 million fixed lines, while as many as 2.4 million are using Wireless Local Loop connections. Sony Ericsson, Nokia and Motorola along with Samsung and LG remain the most popular brands among customers.[156]
Since liberalisation, over the past four years, the Pakistani telecom sector has attracted more than $9 billion in foreign investments.[157] During 2007–08, the Pakistani communication sector alone received $1.62 billion in Foreign Direct Investment (FDI) – about 30% of the country's total foreign direct investment.
Present growth of state-of-the-art infrastructures in the telecoms sector during the last four years has been the result of the PTA's vision and implementation of the deregulation policy. Paging and mobile (cellular) telephones were adopted early and freely. Cellular phones and the Internet were adopted through a rather laissez-faire policy with a proliferation of private service providers that led to the fast adoption. With a rapid increase in the number of Internet users and ISPs, and a large English-speaking population, Pakistani society has seen an unparalleled revolution in communications.
According to the PC World,[158] a total of 6.37 billion text messages were sent through Acision messaging systems across Asia Pacific over the 2008/2009 Christmas and New Year period. Pakistan was amongst the top five ranker with one of the highest SMS traffic with 763 million messages. On 14 August 2010, Pakistan became the first country in the world to experience EVDO's RevB 3G technology that offers maximum speeds of 9.3 Mbit/s. 3G and 4G was simultaneously launched in Pakistan on 23 April 2014 through a SMRA Auction. Three out of Five Companies got a 3G licence i.e. Ufone, Mobilink and Telenor while China Mobile's Zong got 3G as well as a 4G licence. Whereas fifth company, Warid Pakistan did not participate in the auction procedure, But they launched 4G LTE services on their existing 2G 1800 MHz spectrum due to Technology neutral terms and became world's first Telecom Company to transform directly from 2G to 4G. With that Pakistan joined the 3G and 4G world. In December 2017, 3G and 4G subscribers in Pakistan reached to 46 millions.[152]
Pakistan is ranked 4th in terms of broadband Internet growth in the world, as the subscriber base of broadband Internet has been increasing rapidly. The rankings are released by Point Topic Global broadband analysis, a global research centre.[159]
- Pakistan has more than 20 million Internet users in 2009.[160] The country is said to have a potential to absorb up to 50 million mobile phone Internet users in the next 5 years thus a potential of nearly 1 million connections per month.
- Almost all of the main government departments, organisations and institutions have their own websites.
- The use of search engines and instant messaging services is also booming. Pakistanis are some of the most ardent chatters on the Internet, communicating with users all over the world. Recent years have seen a huge increase in the use of online marriage services, for example, leading to a major re-alignment of the tradition of arranged marriages.
- Biometric reverification of SIMs in 2015 had an adverse impact on the cellular subscriber base when subscribers count dropped from 139.9 million to 114.6 million. However, the industry has survived through the tough period and continues to regain subscribers at a fast pace.
According to the report released by PTA for the FY 2017–18 :-[161]
- Total teledensity of Pakistan reached at 74.4%.
- Telecom revenues were reached to Rs. 488.8 billion.
- Total contribution of telecom sector to the national exchequre was RS. 147.2 billion.
- Investment came to the telecom sector was US$670.3 million.
as of June 2018 there were four cell phone companies including PMCL(Jazz), Telenor, Ufone and Zong operating in the country with nearly 150.2 million mobile phone subscribers.[162]
Pakistan Telecommunication Authority released the figures in June 2018 that Broadband subscribers in the country reached to approximately 56.1 millions thus gaining the growth of over 18 fold since 2006.[162]
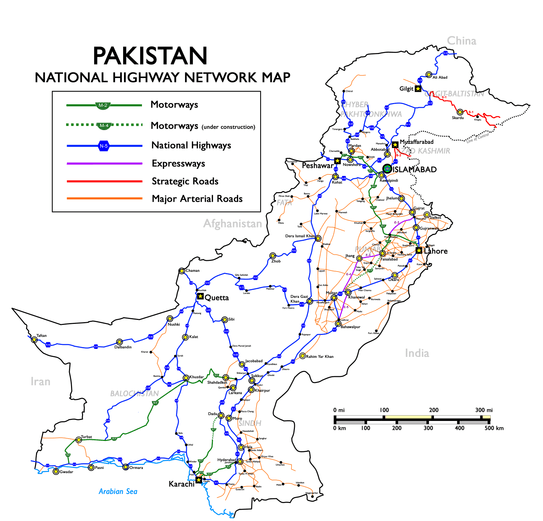
Transportation
Pakistan International Airlines, the flagship airline of Pakistan's civil aviation industry, has turnover exceeding $25 billion in 2015.[163] The government announced a new shipping policy in 2006 permitting banks and financial institutions to mortgage ships.[164] Private sector airlines in Pakistan include Airblue, which serves the main cities within Pakistan in addition to destinations in the Persian Gulf and Manchester in the United Kingdom.
A massive rehabilitation plan worth $1 billion over five years for Pakistan Railways has been announced by the government in 2005.[165] A new rail link trial has been established from Islamabad to Istanbul, via the Iranian cities of Zahedan, Kerman and Tehran. It is expected to promote trade, tourism, especially for exports destined for Europe (as Turkey is part of Europe and Asia).[166][167]
Finance
Pakistan has a large and diverse banking system. In 1974, a nationalization program led to the creation of six government-owned banks.[168] A privatization program in the 1990s lead to the entry of foreign-owned and local banks into the industry.[168] As of 2010, there were five public-owned commercial banks in Pakistan, as well as 25 domestic private banks, six multi-national banks and four specialized banks.[168]
Since 2000 Pakistani banks have begun aggressive marketing of consumer finance to the emerging middle class, allowing for a consumption boom (more than a 7-month waiting list for certain car models) as well as a construction bonanza. Pakistan's banking sector remained remarkably strong and resilient during the world financial crisis in 2008–09, a feature which has served to attract a substantial amount of FDI in the sector. Stress tests conducted in June 2008 data indicate that the large banks are relatively robust, with the medium and small-sized banks positioning themselves in niche markets.
The Pakistan Bureau of Statistics provisionally valued this sector at Rs.807,807 million in 2012 thus registering over 510% growth since 2000.[169]
An article published in Journal of the Asia Pacific Economy by Mete Feridun of University of Greenwich in London with his Pakistani colleague Abdul Jalil presents strong econometric evidence that financial development fosters economic growth in Pakistan.[170]
Housing
The property sector has expanded twenty-threefold since 2001, particularly in metropolises like Lahore.[171] Nevertheless, the Karachi Chamber of Commerce and Industry estimated in late 2006 that the overall production of housing units in Pakistan has to be increased to 0.5 million units annually to address 6.1 million backlog of housing in Pakistan for meeting the housing shortfall in next 20 years. The report noted that the present housing stock is also rapidly aging and an estimate suggests that more than 50% of stock is over 50 years old. It is also estimated that 50% of the urban population now lives in slums and squatter settlements. The report said that meeting the backlog in housing, besides replacement of out-lived housing units, is beyond the financial resources of the government. This necessitates putting in place a framework to facilitate financing in the formal private sector and mobilise non-government resources for a market-based housing finance system.[172]
The Pakistan Bureau of Statistics provisionally valued this sector at Rs.459,829 million in 2012 thus registering over 149% growth since 2006.[169]
Minor sectors
The Pakistan Bureau of Statistics provisionally valued this sector at Rs.389,545 million in 2005 thus registering over 65% growth since 2000.[173] The Pakistan Bureau of Statistics provisionally valued this sector at Rs.631,229 million in 2005 thus registering over 78% growth since 2000.[173] The Pakistan Bureau of Statistics provisionally valued this sector at Rs.1,358,309 million in 2005 thus registering over 96% growth since 2000. The wholesale and retail trade is the largest sub-sector of the services. Its share in the overall services sector is estimated at 31.5 percent. The wholesale and retail trade sector is based on the margins taken by traders on the transaction of commodities traded. In 2012–13, this sector grew at 2.5 percent as compared to 1.7 percent in the previous year.
Energy
For years, the matter of balancing Pakistan's supply against the demand for electricity has remained a largely unresolved matter. Pakistan faces a significant challenge in revamping its network responsible for the supply of electricity. While the government claims credit for overseeing a turnaround in the economy through a comprehensive recovery, it has just failed to oversee a similar improvement in the quality of the network for electricity supply. Most cities in Pakistan receive substantial sunlight throughout the year, which would suggest good conditions for investment in solar energy. If the rich people in Pakistan are shifted to solar energy that they should be forced to purchase solar panels, the shortfall can be controlled. this will make the economy boost again as before 2007. According to an econometric analysis published in Quality & Quantity by Mete Feridun of University of Greenwich and his colleague Muhammad Shahbaz, economic growth in Pakistan leads to electricity consumption but not vice versa.[174]
Chemicals and pharmaceuticals
Foreign trade, remittances, aid, and investment
Investment
Foreign investment had significantly declined by 2010, dropping by 54.6% due to Pakistan's political instability and weak law and order, according to the Bank of Pakistan.[176]
Business regulations have been overhauled along liberal lines, especially since 1999. Most barriers to the flow of capital and international direct investment have been removed. Foreign investors do not face any restrictions on the inflow of capital, and investment of up to 100% of equity participation is allowed in most sectors. Unlimited remittance of profits, dividends, service fees or capital is now the rule. However, doing business has been becoming increasingly difficult over the past decade due to political instability, rising domestic insurgency and insecurity and vehement corruption. This can be confirmed by the World Bank's Ease of Doing Business Index report degrading its ratings for Pakistan each year since September 2009.
Tariffs have been reduced to an average rate of 16%, with a maximum of 25% (except for the car industry). The privatization process, which started in the early 1990s, has gained momentum, with most of the banking system privately owned, and the oil sector targeted to be the next big privatization operation.
The recent improvements in the economy and the business environment have been recognised by international rating agencies such as Moody's and Standard and Poor's (country risk upgrade at the end of 2003). 47.1% increase in Net FDI in 2014–2015 (July–October) as compared to 2013–14 (July–October).[177]
Foreign acquisitions and mergers
With the rapid growth in Pakistan's economy, foreign investors are taking a keen interest in the corporate sector of Pakistan. In recent years, majority stakes in many corporations have been acquired by multinational groups.
- PICIC by Singapore-based Temasek Holdings for $339 million
- Union Bank by Standard Chartered Bank for $487 million
- Prime Commercial Bank by ABN Amro for $228 million
- PakTel by China Mobile for $460 million
- PTCL by Etisalat for $1.8 billion
- Additional 57.6% shares of Lakson Tobacco Company acquired by Philip Morris International for $382 million
- In 2016, Arçelik acquired Dawlance for $243 million.[178]
- In 2016, FrieslandCampina acquired 51% stake in Engro Foods for $446.81 million.[179]
- In 2016, The Abraaj Group sold its 66.4% stake in K-Electric to Shanghai Electric for $1.77 billion.[180]
The foreign exchange receipts from these sales are also helping cover the current account deficit.[181]
Foreign trade
Pakistan witnessed the highest export of US$25.1 billion in the FY 2013–14. However, in subsequent years exports have declined considerably. This declined started from financial year 2014–15 when an international commodity slump set in. This was compounded by structural supply side constraints including energy shortages, high input costs and an overvalued exchange rate. From financial year 2014 to 2016, exports declined by 12.4 percent. Exports growth trend over this period was similar to the world trade growth patterns. Pakistan's external sector continued facing stress during 2016–17. But still Pakistan's merchandise trade exports grew by 0.1 percent during the fiscal year 2016–17. The imports continued to grow at a much faster rate and grew by a large percentage of 18.0 during the FY 2017 as compared to the previous year.[182] World imports had been stagnant between 2011 and 2014 but registered significant drop since early 2015 because of weak commodity and product prices and weak global economic activity. Economic growth was lacklustre in the OECD countries which contributed to the slowdown in China. Furthermore, the ratio between real growth in world imports and world real GDP growth substantially declined. This decline in the import content of economic activity triggered a shift in consumption worldwide from traded towards non-traded goods, import substitution, a slowdown in the pace of trade liberalization, and gave currency to protectionist measures. A bulk of Pakistan's exports are directed to the OECD region and China. Historical data suggest strong correlation between Pakistani exports to imports in OECD and China. As per FY 2016 data, more than half of country's exports are shipped to these two destinations i.e. OECD and China. A decline in Pakistan overall exports,thus occurred in this backdrop.[183]
Pakistan's imports are showing rising trend at a relatively faster rate due to the increased economic activity as part of China Pakistan Economic Corridor (CPEC), particularly in the Energy sector. The construction projects under CPEC require heavy machinery that has to be imported. It is also observed that the economy is currently being led both by investments as well as consumption, resulting in relatively higher levels of imports. During FY 2018 Pakistan's exports picked up and reached to US$24.8 billion showing a growth of 12.6 percent over previous year FY 2017. Imports on the other hand also increased by 16.2 percent and touched the highest figure of US$56.6 billion. As a result, the trade deficit widened to US$31.8 billion which was the highest since last ten years. Pakistan major exports commodities for the last five fiscal years are listed in the table below:
| Commodities | FY 2015 (million US $) | FY 2016 (million US $) | FY 2017 (million US $) | FY 2018 (million US $) | FY 2019 (million US $) |
|---|---|---|---|---|---|
| Cotton Cloth | 2486.783 | ||||
| Knitwear | 2264.114 | ||||
| Ready-made Garments | 2044.018 | ||||
| Bed wear | 2207.477 | ||||
| Rice | 2037.841 | ||||
| Cotton Yarn | 1818.196 | ||||
| Chemical and Pharmaceutical Products | 1249.959 |
Pakistan major imports commodities for the last five fiscal years are listed in the table below:-[184]
| Commodities | FY 2015 (million US $) | FY 2016 (million US $) | FY 2017 (million US $) | FY 2018 (million US $) | FY 2019 (million US $) |
|---|---|---|---|---|---|
| Petroleum products | 7,773.620 | ||||
| Petroleum crude | 4,393.223 | ||||
| Iron and Steel | 1,813.412 | ||||
| Plastic material | 1,771.758 | ||||
| Electrical Machinery & Apparatus | 935.290 | ||||
| Palm oil | 1,681.170 | ||||
| Power Generating Machinery | 897.940 | ||||
| Road vehicles | 1,024.972 | ||||
| Telecom | 1,225.078 | ||||
| Liquefied natural gas | 135.232 |
External imbalances
During FY 2017, the increase in imports of capital equipment and fuel significantly put pressure on the external account. A reversal in global oil prices led to increase in POL imports, accompanied by falling exports, as a result the merchandised trade deficit grew by 39.4 percent to US$26.885 billion in FY 2017. While remittances and Coalition Support Fund inflows both declined slightly over the same period last year, however, the impact was offset by an improvement in the income account, mainly due to lower profit repatriations by oil and gas firms.[183]
Current account – The Current account deficit increased to US$12.4 billion in FY 2017, against US$3.2 billion in FY 2016.[185]
However, the impact of high current deficit on foreign exchange reserves was not severe, as financial inflows were available to the country to partially offset the gap; these inflows helped ensure stability in the exchange rate. Net FDI grew by 12.4 percent and reached US$1.6 billion in the nine-months period, whereas net FPI saw an inflow of US$631 million, against an outflow of US$393 million last year. Encouragingly for the country, the period saw the completion of multiple merger and acquisition deals between local and foreign companies. Moreover, multiple foreign automakers announced their intention to enter the Pakistani market, and some also entered into joint ventures with local conglomerates. This indicates that Pakistan is clearly on foreign investors' radar, and provides a positive outlook for FDI inflows going forward. government's successful issuance of a US$1.0 billion Sukuk in the international capital market, at an extremely low rate of 5.5 percent. Besides, Pakistan continued to enjoy support from international financial institutions (IFIs) like the World Bank and Asian Development Bank, and from bilateral partners like China, in the post-EFF period: net official loan inflows of US$1.1 billion were recorded during the period. As a result, the country's FX reserve amounted to US$20.8 billion by 4 May 2017 sufficient to finance around four month of import payments.[183]
Economic aid
Pakistan receives economic aid from several sources as loans and grants. The International Monetary Fund (IMF), World Bank (WB), Asian Development Bank (ADB), etc. provide long-term loans to Pakistan. Pakistan also receives bilateral aid from developed and oil-rich countries. Foreign aid has been one of the main sources of money for the Pakistani Economy. Collection of Foreign aid has been one of the priorities of almost every Pakistani Government with the Prime Minister himself leading delegations on a regular basis to collect Foreign aid.[186][187]
The Asian Development Bank will provide close to $6 billion development assistance to Pakistan during 2006–9.[188] The World Bank unveiled a lending programme of up to $6.5 billion for Pakistan under a new four-year, 2006–2009, aid strategy showing a significant increase in funding aimed largely at beefing up the country's infrastructure.[189] Japan will provide $500 million annual economic aid to Pakistan.[190] In November 2008, the International Monetary Fund (IMF) has approved a loan of 7.6 billion to Pakistan, to help stabilise and rebuild the country's economy. Between the 2008 and 2010 fiscal years, the IMF extended loans to Pakistan totalling 5.2 billion dollars.[191] The government decided in 2011 to cut off ties with the IMF. However the government newly elected in 2013 re-established these ties, and a negotiated a three-year $6.6 billion package which would allow it to deal with on-going debt issues.[192] In May 2019, Pakistan finalised a US$6 billion foreign aid with IMF.[193] This is Pakistan's 22nd such bailout from the IMF.[194]
The China–Pakistan Economic Corridor is being developed with a contribution of mainly concessionary loans from China under the Belt and Road Initiative. Much like BRI, value of CPEC investments transcends any fiat currency and is only estimated vaguely as it spans over decades of past and future industrial development and global economic influence.
Remittances
The remittances of Pakistanis living abroad has played important role in Pakistan's economy and foreign exchange reserves. The Pakistanis settled in Western Europe and North America are important sources of remittances to Pakistan. Since 1973 the Pakistani workers in the oil rich Arab states have been sources of billions of dollars of remittances.
The 9 million-strong Pakistani diaspora, contributed US$19.3 billion to the economy in FY2017.[195] The major source countries of remittances to Pakistan include UAE, US, Saudi Arabia, GCC countries (including Bahrain, Kuwait, Qatar and Oman), Australia, Canada, Japan, Norway, Switzerland, UK and EU countries.
Remittances sent home by overseas Pakistani workers have seen a negative growth of 3.0% in the fiscal year 2017 compare to previous year when remittances reached at all-time high of 19.9 billion US dollars. This decline in remittances is mainly due to the adverse economic conditions of Arabian and gulf countries after the fall in oil prices in 2016. However, the recent development activities in the Qatar FIFA World Cup, Dubai Expo, Saudi Arabia's implementation of its Vision 2030 and particularly the recent visit of the P.M to Kuwait should all be helpful in opening new avenues for employment in these countries . Going forward one can expect improvements in the coming years.
Remittances sent home by overseas Pakistanis in the fiscal year 2016/17 are as under:[182]
| Country | [Million USD] |
|---|---|
| 2,443.54 | |
| 2,338.34 | |
| 5,469.77 | |
| 4,309.88 | |
| 2,324.06 | |
| 482.59 | |
| 41.31 | |
| 26.34 | |
| 204.31 | |
| 187.22 | |
| 14.31 | |
| Other countries | 1,461.91 |
Government finances
Fiscal budget summary (FY2017/18)[196]
- Fiscal year: 1 July – 30 June
- Budget outlay: Rs 5,013.8 billion rupees
- Revenues collection estimated: 4,713.7 billion rupees
- Expenditures estimated: 5,103.8 billion rupees
- Bank borrowing estimated: 390.1 billion rupees
Revenues and taxation
Pakistan has a low tax/GDP ratio, which it is trying to improve. The current tax-to-GDP ratio is 12.6% (2016),[197] which is a little less than its neighbour India 16.6% (2016) [198] while a slight more than Sri Lanka 12.3% (2015).[199] The pace of revenue mobilization has witnessed an upward trajectory since FY 2013. Overall revenues increased to 15.3 percent of GDP in FY 2016, compared to 13.3 percent of GDP recorded in FY 2013. Among those, tax revenues increased from 9.8 percent of GDP in FY 2013 to 12.6 percent of GDP in FY 2016.
Expenditures
Government expenditures were 4,383.6 billion rupees (FY 2016–2017 July to March). Total expenditures witnessed a downward trajectory without compromising the expenditures on development projects and social assistance. Particularly, expenditures under Public Sector Development Program (PSDP) have been raised adequately in order to meet the investment requirements. During FY 2017 the size of federal PSDP has increased to Rs 800 billion from Rs 348.3 billion during FY 2013, showing a cumulative increase of over 129 percent. During first nine months of current fiscal year, the fiscal deficit stood at 3.9 percent of GDP against 3.5 percent of GDP recorded in the same period of FY 2016 on account of higher development expenditures along with various tax incentives to promote investment and economic activity in the country and security related expenditures. On the basis of previous estimates of GDP at Rs 33,509 billion, the fiscal deficit was recorded at 3.7 percent during first nine months of current fiscal year against 3.4 percent registered in the comparable period of FY 2016. Total revenues grew at 6.2 percent to Rs 3,145.5 billion during July–March, FY 2017 against Rs 2,961.9 in the comparable period of FY 2016.[197]
Income distribution
- GINI Index: 41
- Household income or consumption by percentage share:
- lowest 10%: 4.1%
- highest 10%: 27.7% (1996)
- middle 10%: 10.4%
Natural resources
Economic issues
Corruption
The corruption is on-going issue in the government, claiming to take initiatives against it,[200] particularly in the government and lower levels of police forces.[201] In 2011, the country has had a consistently poor ranking at the Transparency International's Corruption Perceptions Index with scores of 2.5,[202] 2.3 in 2010,[203] and 2.5 in 2009[204] out of 10.[205] In 2011, Pakistan ranked 134 on the index with 42 countries ranking worse.[206] In 2012, Pakistan's ranking dropped even further from 134 to 139, making Pakistan the 34th most corrupt country in the world, tied with Azerbaijan, Kenya, Nepal, and Nigeria.[207] However, during Sharif regime (2013–17), Pakistan got improved ranking of 117/180 in 2017 (with an improvement in score 28, 29, 30, 32, 32 [2013–17]), equal to Egypt (better than 59 countries).[208].
Poverty
Circular debt and spending priorities
Since before the collapse of the USSR in 1991, progressive economic liberalization has been carried out by the government both at the provincial and the national level. Pakistan has achieved FDI of almost $8.4 billion in the financial fiscal year of 2006–07, surpassing the government target of $4 billion.[209] Despite this milestone achievement, the Foreign investment had significantly declined by 2010, dropping by ~54.6% due to Pakistan's military operations, financial crises, law and order situation in Karachi, according to the Bank of Pakistan.[210] From the 2006 estimate, the Government expenditures were ~$25 billion.
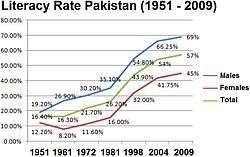
Funding in science and education has been a primary policy of the Government of Pakistan, since 1947. Moreover, English is fast spreading in Pakistan, with 18 million Pakistanis[211] (11% of the population)[211] having a command over the English language, which makes it the 3rd Largest English Speaking Nation in the world and the 2nd largest in Asia.[211] On top of that, Pakistan produces about 445,000 university graduates and 10,000 computer science graduates per year.[212] Despite these statistics, Pakistan still has one of the highest illiteracy rates in the world[213] and the second largest out of school population (5.1 million children) after Nigeria.[214]
Debts and deficit
As per the CIA World Factbook, in 2010, Pakistan ranks 63rd in the world, with respect to the public external debt to various international monetary authorities (owning ~$55.98 billion in 2010), with a total of 60.1% of GDP.[215]
Since 2009, Pakistan has been trying to negotiate debt cancellation currently Pakistan spends $3 billion on debt servicing annually to largely western nations and the International Monetary Fund.[216]
Illegal Immigrants and Refugees
See also
By province and administrative unit:
- Economy of Azad Kashmir
- Economy of Balochistan, Pakistan
- Economy of Gilgit Baltistan
- Economy of Khyber Pakhtunkhwa
- Economy of Punjab, Pakistan
- Economy of Sindh
- Economy of Karachi
- Economy of Islamabad
- Economy of Lahore
- Economy of Faisalabad
- Economy of Rawalpindi
Other
- Economic liberalisation in Pakistan
- Foreign trade of Pakistan
- Ministry of Finance (Pakistan)
- 2019–20 Pakistan federal budget
- Agriculture in Pakistan
- Economic effects of 2010 Pakistan floods
- Consensus Economics
- Economic forecasting
- Economic history of Pakistan
- Industry of Pakistan
- List of Pakistani Districts by Human Development Index
- List of Pakistani provinces by gross domestic product
- List of Pakistanis by net worth
- List of tariffs in Pakistan
- Ministry of Commerce (Pakistan)
- Pakistan Board of Investment
- Prize Bonds
- Science and technology in Pakistan
- Trade Development Authority of Pakistan
- Trading Corporation of Pakistan
- Economy of the OIC
References
- "World Economic Outlook Database, April 2019". IMF.org. International Monetary Fund. Retrieved 29 September 2019.
- "World Bank Country and Lending Groups". datahelpdesk.worldbank.org. World Bank. Retrieved 29 September 2019.
- "World Population Prospects 2019". population.un.org. United Nations Department of Economic and Social Affairs. Retrieved 31 March 2020.
- "World Economic Outlook Database, October 2019". IMF.org. International Monetary Fund. Retrieved 23 October 2019.
- "World Economic Outlook Database, April 2020". IMF.org. International Monetary Fund. Retrieved 17 April 2020.
- "Global Economic Prospects, June 2020". openknowledge.worldbank.org. World Bank. p. 98. Retrieved 24 June 2020.
- "Sectoral Shares in GDP" (PDF). PBS.

- "Monthly Review on Price Indices" (PDF). Pakistan Bureau of Statistics. October 2019. Retrieved 28 November 2019.
- "Pakistan annual inflation rate rises to 14.56% in January". Reuters. 1 February 2020. Retrieved 6 February 2020.
- "State Bank raises benchmark interest rate to 13.25pc". DAWN.COM. 16 July 2019. Retrieved 16 November 2019.
- "Poverty headcount ratio at $3.20 a day (2011 PPP) (% of population)". data.worldbank.org. World Bank. Retrieved 4 September 2019.
- "Pakistan". World Poverty Clock. Retrieved 12 April 2019.
- "GINI index (World Bank estimate)". data.worldbank.org. World Bank. Retrieved 2 April 2019.
- "Human Development Index (HDI)". hdr.undp.org. HDRO (Human Development Report Office) United Nations Development Programme. Retrieved 11 December 2019.
- "Inequality-adjusted HDI (IHDI)". hdr.undp.org. UNDP. Retrieved 22 May 2020.
- "Labor force, total – Pakistan". data.worldbank.org. World Bank. Retrieved 23 November 2019.
- "Employment to population ratio, 15+, total (%) (national estimate)". data.worldbank.org. World Bank. Retrieved 23 August 2019.
- "Employment trends 2018" (PDF). Pakistan Bureau of Statistics. March 2019. Retrieved 21 April 2019.
- "Unemployment, youth total (% of total labor force ages 15–24) (national estimate) – Pakistan". data.worldbank.org. World Bank & ILO. Retrieved 26 December 2019.
- "Ease of Doing Business in Pakistan". Doingbusiness.org. Retrieved 25 October 2019.
- "Trade of Goods" (PDF). SBP. Retrieved 23 July 2019.
- "External Sector" (PDF). SBP. Retrieved 23 July 2019.
- "SBP EXPORT RECEIPTS BY COUNTRY" (PDF). SBP. 2018–2019. Retrieved 23 July 2018.
- "Trade of Goods" (PDF). SBP. Retrieved 23 July 2019.
- "IMPORTS PAYMENTS BY COMMODITY" (PDF). SBP. Retrieved 23 July 2019.
- "PAKISTAN: FOREIGN INVESTMENT". santandertrade. Retrieved 29 July 2019.
- "4.1 Daily Foreign Exchange Rates" (PDF). Retrieved 29 November 2019.
- http://www.sbp.org.pk/ecodata/pakdebt.pdf
- "Pakistan's Debt and Liabilities-Summary" (PDF). SBP. Retrieved 20 February 2020.
- "SOCIAL INDICATORS" (PDF). finance.gov.pk. finance division. Retrieved 21 June 2020.
- "Consolidated Fiscal Operations". Finance Division. 27 August 2018. Retrieved 31 August 2018.
- "Net official development assistance received (current US$)". World Bank. Retrieved 25 May 2019.
- "Sovereigns rating list". Standard & Poor's. Retrieved 26 May 2011.
- Salman Siddiqui (2 December 2019). "Moody's upgrades Pakistan's outlook to 'stable' from 'negative'". Tribune Express. Retrieved 8 December 2019.
- "Fitch Affirms Pakistan at 'B-'; Outlook Stable". The Fitch.
- "Data" (PDF). State Bank of Pakistan.
- "CENSUS – 2017 PAKISTAN" (PDF). Pakistan Bureau of Statistics. August 2017. Archived from the original (PDF) on 29 August 2017.
- "Economic Indicators 2019" (PDF). Pakistan Finance Division. Retrieved 29 November 2019.
- "The Secret Strength of Pakistan's Economy". Bloomberg.
- Faryal Leghari (3 January 2007). "GCC investments in Pakistan and future trends". Gulf Research Center. Archived from the original on 11 January 2012. Retrieved 12 February 2008.
- "Quid Pro Quo 45 – Tales of Success" (PDF). Muslim Commercial Bank of Pakistan. 2007. p. 2. Archived from the original (PDF) on 16 February 2008. Retrieved 12 February 2008.
- Malcolm Borthwick (1 June 2006). "Pakistan steels itself for sell-offs". BBC News. Retrieved 12 February 2008.
- Tavia Grant (8 December 2011). "On 10th birthday, BRICs poised for more growth". The Globe and Mail. Toronto. Retrieved 4 January 2012.
- Henneberry, S. (2000). "An analysis of industrial–agricultural interactions: A case study in Pakistan" (PDF). Agricultural Economics. 22: 17–27. doi:10.1016/S0169-5150(99)00041-9.
- "World Bank Document" (PDF). 2008. p. 14. Retrieved 2 January 2010.
- "Pakistan Country Report" (PDF). RAD-AID. 2010. pp. 3, 7. Archived from the original (PDF) on 12 January 2012. Retrieved 26 December 2011.
- Design, Websynergi. "Pakistan Trade, Pakistan Industries, India Pakistan Trade Unit". iptu.co.uk.
- "Pakistan's Top 10 Exports". Daniel Workman. World's Top Exports.
- Archived 20 July 2009 at the Portuguese Web Archive
- Declan Walsh (18 May 2013). "Pakistan, Rusting in Its Tracks". The New York Times. Retrieved 19 May 2013.
natural disasters and entrenched insurgencies, abject poverty and feudal kleptocrats, and an economy near meltdown
- Fiscal Sustainability: A Historical Analysis of Pakistan’s Debt Conundrum. Emerging Markets: Theory & Practice eJournal. Social Science Research Network (SSRN). Accessed 1 July 2019.
- World Bank Country Classification Groups "Archived copy". Archived from the original on 24 May 2008. Retrieved 11 June 2015.CS1 maint: archived copy as title (link) CS1 maint: BOT: original-url status unknown (link), (July 2006 data)
- "Privatisation process: Govt to sell assets in sole offering". The Express Tribune.
- "BANKS' FLOATING AVERAGE EXCHANGE RATES". SBP. Retrieved 28 March 2019.
- "Foreign currency reserves cross $10b mark". The Express Tribune.
- "Outlook stable: S&P affirms Pakistan's ratings at 'B-/B'". The Express Tribune.
- "These are the '10 emerging markets of the future'". World Economic Forum. Retrieved 31 July 2016.
- "Pakistan economy out of crisis: IMF".
- AFP (10 November 2016). "World Bank projects 5.4 per cent growth rate for Pakistan in 2018". DAWN News. Retrieved 25 May 2019.
- "Pakistan growth to hit eight-year low as IMF bailout looms". gulfnews.com. Retrieved 19 May 2019.
- "Pakistan shows highest economic growth in eight years: The situation of current account imbalance was successfully handled through the investment from gulf countries and increase in foreign remittances: Fiscal deficit target set at 3.8 percent – Pakistan Revenue". pkrevenue.com.
- "Pakistan's performance improves, budget deficit at 1.7% – The Express Tribune". 16 February 2016.
- "Budget deficit widens to record Rs2.26tr in FY18".
- "Pakistan's credit profile reflects domestic and external challenges". 13 December 2018.
- Zahid, Wali (17 July 2017). "Pak GDP in terms of purchasing power parity crosses $1 trillion". The News. Retrieved 27 July 2017.
- "XE: USD / PKR Currency Chart. US Dollar to Pakistani Rupee Rates". xe.com. Retrieved 19 May 2019.
- Archived 4 March 2013 at the Wayback Machine
- Archived 13 November 2010 at the Wayback Machine
- http://www.pakistantoday.com.pk/2016/07/22/business/pakistan-top-emerging-economy-among-south-asian-markets-amc/
- "Bush administration puts pressure on Pakistan (Sept 13 2001)". CNN. 13 September 2001. Archived from the original on 21 October 2007. Retrieved 4 December 2007.
- "Doing Business in 2006: South Asian Countries Pick up Reform Pace, says World Bank Group; India Ranks 116th, 25 Places After China; Pakistan Among Top 10 Reformers". 12 September 2005. Retrieved 3 June 2006.
- "Doing Business 2019 – 17th edition" (PDF). doingbusiness.org. Retrieved 29 February 2020.
- "New auto players to invest over $800m in Pakistan". tribune.com.pk. Retrieved 3 January 2019.
- "ExxonMobil set for comeback in Pakistan after nearly three decades: Report". profit.pakistantoday.com.pk. Retrieved 3 January 2019.
- "Qatar will invest $3 billion in Pakistan, state news agency says". Reuters. Retrieved 24 June 2019.
- "Qatar Sends First Tranche of $3 Billion Payment to Pakistan". Bloomberg. Retrieved 29 June 2019.
- "Qatar sends $500 million payment to Pakistan". Pakistan Today. Retrieved 30 June 2019.
- "Gross Domestic Product of Pakistan (at constant basic prices of 2005-06)" (PDF). Table-5.pdf. Pakistan Bureau of Statistics. Retrieved 25 May 2020.
- "Real Growth Rates of GDP at constant basic prices of 2005-06" (PDF). Pakistan Bureau of Statistics. Retrieved 25 May 2020.
- "Gross Domestic Product of Pakistan (at current basic prices)" (PDF). Pakistan Bureau of Statistics. Retrieved 20 May 2020.
- "weighted average exchange rates". SBP. Archived from the original on 20 May 2020. Retrieved 20 May 2020.
- "Monthly Average Exchange Rates". SBP. Retrieved 14 June 2020.
- "SOCIAL INDICATORS" (PDF). Finance Division. Retrieved 11 June 2020.
- "Monthly ECONOMIC UPDATE" (PDF). finance.gov.pk. Retrieved 1 June 2020.
- "consolidated fiscal operations". Ministry of Finance. Retrieved 14 May 2020.
- "7.1 Pakistan's Balance of Payments" (PDF). SBP. Retrieved 29 September 2018.
- "Pakistan's Balance of Payments" (PDF). SBP. Retrieved 8 August 2020.
- "Summary Balance of Payments" (PDF). SBP. Retrieved 25 June 2020.
- "Pakistan's Debt and Liabilities-Summary". SBP. Retrieved 14 May 2020.
- "Pakistan's External Debt and Liabilities - Outstanding" (PDF). SBP. Retrieved 15 May 2020.
- "Pakistan's External Debt Servicing -Principal (Archive)". SBP. Retrieved 15 May 2020.
- "LIQUID FOREIGN EXCHANGE RESERVES". SBP. Retrieved 15 May 2020.
- "LIQUID FOREIGN EXCHANGE RESERVES" (PDF). SBP. Retrieved 28 June 2020.
- "Summary of Foreign Investment in Pakistan" (PDF). sbp.org.pk. Retrieved 8 August 2020.
- "Montly Position Inflow, Outflow and Net basis". SBP. Retrieved 15 May 2020.
- "Exports Receipts & Imports Payments and Balance of Trade". State Bank of Pakistan. Retrieved 28 March 2019.
- "Balance of Trade" (PDF). SBP. Retrieved 28 July 2020.
- "Workers' Remittances" (PDF). SBP. Retrieved 14 July 2020.
- "Country-wise Workers' Remittances". SBP. Retrieved 15 May 2020.
- "The Benefits of the English Language for Individuals and Societies: Quantitative Indicators from Cameroon, Nigeria, Rwanda, Bangladesh and Pakistan" (PDF). Retrieved 2 September 2012.
- Shirajiv, Sirimane. "Pakistan-Sri Lanka trade zooming to US$ one billion mark". Archived from the original on 3 July 2013. Retrieved 23 May 2007.
- "Data – Finance". Web.worldbank.org. Archived from the original on 5 April 2010. Retrieved 29 July 2010.
- "Weekly review: KSE-100 crosses 30,000 points to hit all-time high". The Express Tribune.
- "Pakistan Stock Exchange formally launched Index". DAWN News. 11 January 2016. Retrieved 12 September 2017.
- "Market dips as MSCI reclassifies PSX to Emerging Markets Index". DAWN News. 16 May 2017. Retrieved 12 September 2017.
- "KSE-100 ends shy of 52,400, gains over 600 points". THE EXPRESS TRIBUNE. Retrieved 12 September 2017.
- "Middle class Pakistan". The Express Tribune. 21 April 2017. Retrieved 30 September 2018.
- "Pakistan's middle class continues to grow at rapid pace". The Express Tribune. 2 May 2017. Retrieved 30 September 2018.
- "Need for a new paradigm". DAWN News. 27 April 2010. Retrieved 25 May 2019.
- "Pakistan – Data". data.worldbank.org.
- "HRM significance and SME sector -Business Recorder – Articles and Letters; 11 April 2011". Business Recorder. 11 April 2011.
- "The World Factbook — Central Intelligence Agency". cia.gov.
- http://www.finance.gov.pk/survey/chapters_17/12-Population.pdf
- "Government Jobs in Pakistan".
- "Extremism Mars Daughter of Alps | Pakistan Alpine Institute". Pakistanalpine.com. Archived from the original on 2 January 2014. Retrieved 11 January 2014.
- http://www.brecorder.com/pakistan/industries-a-sectors/328271-pakistans-tourism-industry-gradually-recovering.html
- "Budget Speech 2018–19" (PDF). finance division. Retrieved 20 April 2019.
- "Forex Currency Rates Pakistan – Forex Open Market Rates – Prize Bond Draw Result – Rates and schedule – Finance News & Updates". Forexpk.com. 6 January 2014. Retrieved 11 January 2014.
- The News: https://www.thenews.com.pk/print/596060-state-bank-of-pakistan-forex-reserves-rise-to-11-5bln
- "wheat production". fao.org. Retrieved 20 April 2019.
- "Pakistan Grain and Feed Update". gain.fas.usda.gov. Retrieved 22 February 2020.
- "Pakistan cuts pesticide use dramatically". fao.org.
- "Agriculture" (PDF). SBP. Retrieved 22 February 2020.
- "Water shortages in Pakistan: An impending economic crisis – The Independent.in".
- "Area, Production and Yield of Important Crops" (PDF). SBP. Retrieved 5 May 2018.
- "Extraction of Principal Minerals" (PDF). PBS. Retrieved 17 February 2020.
- "Industry (including construction), value added (% of GDP)". The World Bank.
- "Industry (including construction), value added (annual % growth)". The World Bank.
- "Manufacturing, value added (% of GDP)". The World Bank.
- "Chapter 3: Manufacturing and Mining" (PDF). Pakistan Economic Survey 2017–18. Ministry of Finance. Retrieved 25 May 2019.
- M. Rizwan Manzoor. The Sectoral Analysis of Surgical Instruments of Pakistan (PDF) (Report). PITAD. Retrieved 25 May 2019.
- Aaliya Ahmed (1 September 2010). Pakistan Surgical Industry (PDF) (Report). The Rawalpindi Chamber of Commerce & Industry. Retrieved 25 May 2019.
- Surgical & Medical Instruments Industry of Pakistan (PDF) (Report). TDAP. Retrieved 25 May 2019.
- Chin (24 May 2012). "World's Leading Surgical Instruments Producers". TradeFord.
- Khan, Mubarak Zeb (22 August 2016). "Pakistan's shadow surgical instruments' sector". DAWN News. Retrieved 25 May 2019.
- "Manufacturing sector grows by 5.2 percent". Associated Press Of Pakistan. 4 June 2014. Archived from the original on 8 August 2014.
- "The growth of the "billion dollar club" in Pakistan". The Express Tribune.
- Financial Highlights- PSO Archived 6 October 2014 at the Wayback Machine
- "Financial Data – K-Electric". ke.com.pk.
- More Desk. "PTCL is the largest revenue generator in listed telecom market". moremag.pk. Archived from the original on 17 July 2014.
- "All Pakistan Cement Manufacturers Association Export Data". Apcma.com. Retrieved 15 October 2013.
- Bhutta, Zafar (21 May 2013). "Can't get enough: Soaring profits not enough for cement industry". Tribune.com.pk. Retrieved 15 October 2013.
- "Upward move: Pakistan's ICT sector to cross $10b mark, says P@SHA". The Express Tribune.
- Archived 27 October 2011 at the Wayback Machine
- "Geography of Offshoring is Shifting | News & media". Atkearney.com. Archived from the original on 30 March 2010. Retrieved 29 July 2010.
- https://www.lemonde.fr/economie/article/2019/01/25/un-rapport-de-l-ong-human-rights-watch-denonce-les-conditions-de-travail-dans-le-textile-au-pakistan_5414575_3234.html
- "Tackling the energy crisis". Nation.com.pk. Archived from the original on 3 December 2013. Retrieved 11 January 2014.
- Archived 13 November 2010 at the Wayback Machine
- http://www.pta.gov.pk/index.php?Itemid=599
- IT sector export about $600 million a year: minister. Business Recorder. Retrieved on 16 February 2008
- "Pakistan Recognised by GSMA for Exceptional Work in Developing Mobile Communications". Archived from the original on 4 September 2006. Retrieved 25 August 2006.
- Pakistan: Growth and Export Competitiveness, World Bank Document No. 35499-PK, Table 6.7, page 116. Issued 25 April 2006
- "Business Recorder [Pakistan's First Financial Daily]". Brecorder.com. 1 January 2004. Retrieved 29 July 2010.
- "Leading News Resource of Pakistan". Daily Times. Archived from the original on 11 June 2010. Retrieved 29 July 2010.
- "Guess Which County Texts the Heaviest". PCWorld. 1 February 2009.
- "Leading News Resource of Pakistan". Daily Times. 3 December 2008. Archived from the original on 11 June 2010. Retrieved 29 July 2010.
- "Internet Users in Pakistan hit 17.5 Million Mark – ProPakistani". Propakistani.pk. Retrieved 29 July 2010.
- "Annual Report 2018" (PDF). PTA. 1 July 2018. Retrieved 24 February 2019.
- "Annual Cellular Subscribers". PTA. 1 December 2017. Retrieved 24 February 2019.
- PIAC Annual report 2005 Archived 12 October 2006 at the Wayback Machine
- "Ports and shipping of Pakistan". Pakakhbar.com. Archived from the original on 26 March 2010. Retrieved 29 July 2010.
- Khaleeq Kiani (4 July 2005). "Pakistan Railways to undertake Rs60bn rehabilitation plan". DAWN News. Retrieved 25 May 2019.
- "Pakistan-Turkey rail trial starts". BBC News. 14 August 2009. Retrieved 1 May 2010.
- "Pakistan, Turkey and Iran plan rail container service Rail transport, Pakistan Intermodal, Rail transport, Turkey rail transport, Pakistan Railways, Akhtar, Saaed". Worldcargonews.com. 8 April 2009. Archived from the original on 11 June 2010. Retrieved 29 July 2010.
- https://tribune.com.pk/story/286458/history-of-banking-in-pakistan--of-humble-origins-and-vast-potential/. Retrieved 23 October 2018. Missing or empty
|title=(help) - http://www.pbs.gov.pk/sites/default/files/national_accounts/tables/table4.pdf
- Jalil, Abdul and Feridun, Mete (2011) Impact of financial development on economic growth: empirical evidence from Pakistan. Journal of the Asia Pacific Economy, 16 (1). pp. 71–80. ISSN 1354-7860 (print), 1469-9648 (online) (doi:10.1080/13547860.2011.539403)
- Pakistan's post-9/11 economic boom BBC News, 21 September 2006
- 0.5 million housing units needed annually to meet shortfall: KCCI Business Recorder, 7 October 2006
- "Gross National Product of Pakistan (at current factor cost)" (PDF). Archived from the original (PDF) on 19 June 2007. Retrieved 19 June 2007.
- Shahbaz, Muhammad and Feridun, Mete (2012) Electricity consumption and economic growth empirical evidence from Pakistan. Quality & Quantity, 46 (5). pp. 1583–1599. ISSN 0033-5177 (print), 1573–7845 (Online) (doi:10.1007/s11135-011-9468-3)
- "CIA Worldbook". CIA. 12 May 2012. Retrieved 12 May 2012.
- "Significant Decline In Foreign Investment To Pakistan". Malick, Sajid Ibrahim. 15 February 2010. Archived from the original on 11 September 2010. Retrieved 2010-11-01.
- "Welcome to the Board of Investment". boi.gov.pk.
- Nafees, Shahab (16 November 2016). "Turkish company acquires Dawlance for $243m". DAWN News. Retrieved 3 January 2017.
- Siddiqui, Salman (20 December 2016). "Dutch company acquires Engro Foods for $446.81m". Express Tribune. Retrieved 3 January 2017.
- Crofts, Dale (31 October 2016). "Shanghai Electric to Pay $1.8 Billion for Stake in K-Electric". Bloomberg L.P. Retrieved 3 January 2017.
- Mohiuddin Aazim (9 July 2007). "Rising foreign stakes in local companies". DAWN News. Retrieved 25 May 2019.
- http://www.sbp.org.pk/reports/stat_reviews/Bulletin/2017/Aug/ExternalSector.pdf
- http://www.finance.gov.pk/survey/chapters_17/08-Trade.pdf
- "IMPORTS PAYMENTS BY COMMODITY" (PDF). SBP. Retrieved 23 July 2018.
- http://www.sbp.org.pk/reports/stat_reviews/Bulletin/2017/Nov/ExternalSector.pdf
- Diplomat, Tridivesh Singh Maini , The. "After Khan's Visit, Pakistan Doubles Down on China Dependence". The Diplomat. Retrieved 19 May 2019.
- Saber, Israa (10 December 2018). "Experts discuss Pakistan's Imran Khan's first 100 days in office". Brookings. Retrieved 19 May 2019.
- "Business Recorder [Pakistan's First Financial Daily]". Brecorder.com. 1 January 2004. Retrieved 29 July 2010.
- "World Bank plans 6.5 bln usd lending to Pakistan". Forbes.com. 2 January 2006. Archived from the original on 4 September 2006. Retrieved 6 March 2006.
- "Japan to resume USD 500 mn annual funding for Pak". Chennai, India: The Hindu News Update Service. 29 May 2006. Archived from the original on 30 September 2007. Retrieved 3 June 2006.
- https://www.imf.org/external/np/fin/tad/extrans1.aspx?memberKey1=760&endDate=2013-07-30&finposition_flag=YES
- "Aid to Pakistan by the Numbers". Center for Global Development. September 2013. Retrieved 4 January 2019.
- "Bloomberg – Are you a robot?". bloomberg.com. Retrieved 19 May 2019.
- "Pakistan growth to hit eight-year low as IMF bailout looms". gulfnews.com. Retrieved 19 May 2019.
- "Pakistan | State Bank of Pakistan" (PDF). sbp.org. Retrieved 7 September 2017.
- http://www.finance.gov.pk/budget/Budget%20in%20Brief%202017-18.pdf
- /"PAKISTAN ECONOMIC SURVEY 2016–17" (PDF). Ministry Of Finance.
- Mudgill, Amit (22 July 2017). "Tax ratio similar to Rwanda, but wants to beat China: That's India" – via The Economic Times.
- "Tax revenue (% of GDP) – Data". data.worldbank.org.
- Susan Rose-Ackerman. Corruption and good governa. United Nations Development Programme. p. 4.
- "Pakistan" (PDF), Country Reports on Human Rights Practices, United States Department of State: Bureau of Democracy, Human Rights, and Labor, 4 August 2011, retrieved 10 December 2011
- "Corruption Perceptions Index (2011)". Transparency International. Retrieved 10 December 2011.
- "Corruption Perceptions Index (2010)". Transparency International. Retrieved 10 December 2011.
- "Corruption Perceptions Index (2009)". Transparency International. Retrieved 10 December 2011.
- Marie Chêne, Overview of corruption in Pakistan, U4 Anti-Corruption Resource Centre
- "Pakistan less corrupt, according to global corruption list". The Express Tribune. 1 December 2011. Retrieved 10 December 2011.
- 'Rule of law can end corruption in Pakistan' | Asia | DW.DE | 06.12.2012. DW.DE. Retrieved on 2013-07-12.
- e.V, Transparency International. "Corruption Perceptions Index 2017". transparency.org.
- Daily Mail News Archived 2010-06-11 at the Wayback Machine
- "Significant Decline In Foreign Investment To Pakistan". Malick, Sajid Ibrahim. 15 February 2010. Archived from the original on 11 September 2010. Retrieved 1 November 2010.
- Archived January 1, 2012, at the Wayback Machine
- Pakistan Literacy Rate. Ilm.com.pk (2010-09-28). Retrieved on 2013-07-12.
- Youth and skills: putting education to work, EFA global monitoring report, 2012; 2013
- CIA. "Public Debt of Pakistan". Central Intelligenec Agency (CIA). CIA Fact book. Retrieved 20 June 2013.
- Pakistan seeking trade, not aid: Gilani Archived 2013-12-26 at the Wayback Machine. Allvoices.com (2010-06-09). Retrieved on 2013-07-12.
Bibliography
- Khan Ashan (2014). Economics of Pakistan, 9th edition. Pakistan.
Further reading
- Gabol, Nasir (1990). Privatisation in Pakistan. Paris, France: Organisation for Economic Cooperation and Development. ISBN 92-64-15310-1.
- Ahmad, Viqar and Rashid Amjad. 1986. The Management of Pakistan's Economy, 1947–82. Karachi: Oxford University Press.
- Ali, Imran. 1997. ‘Telecommunications Development in Pakistan’, in E.M. Noam (ed.), Telecommunications in Western Asia and the Middle East. New York: Oxford University Press.
- Ali, Imran. 2001a. ‘The Historical Lineages of Poverty and Exclusion in Pakistan’. Paper presented at Conference on Realm, Society and Nation in South Asia. National University of Singapore.
- Ali, Imran. 2001b. ‘Business and Power in Pakistan’, in A.M. Weiss and S.Z. Gilani (eds), Power and Civil Society in Pakistan. Karachi: Oxford University Press.
- Ali, Imran. 2002. ‘Past and Present: The Making of the State in Pakistan’, in Imran Ali, S. Mumtaz and J.L. Racine (eds), Pakistan: The Contours of State and Society. Karachi: Oxford University Press.
- Ali, Imran, A. Hussain. 2002. Pakistan National Human Development Report. Islamabad: UNDP.
- Ali, Imran, S. Mumtaz and J.L. Racine (eds). 2002. Pakistan: The Contours of State and Society. Karachi: Oxford University Press.
- Amjad, Rashid. 1982. Private Industrial Investment in Pakistan, 1960–70. London: Cambridge University Press.
- Andrus, J.R. and A.F. Mohammed. 1958. The Economy of Pakistan. Stanford: Stanford University Press.
- Bahl, R., & Cyan, M. (2009). Local Government Taxation in Pakistan (No. paper0909). International Center for Public Policy, Andrew Young School of Policy Studies, Georgia State University.
- Barrier, N.G. 1966. The Punjab Alienation of Land Bill of 1900. Durham, NC: Duke University South Asia Series.
- Jahan, Rounaq. 1972. Pakistan: Failure in National Integration. New York: Columbia University Press.
- Kessinger, T.G. 1974. Vilyatpur, 1848–1968. Berkeley and Los Angeles: University of California Press.
- Kochanek, S.A. 1983. Interest Groups and Development: Business and Politics in Pakistan. New Delhi: Oxford University Press.
- LaPorte, Jr, Robert and M.B. Ahmad. 1989. Public Enterprises in Pakistan. Boulder, Colorado: Westview Press.
- Latif, S.M. 1892. Lahore. Lahore: New Imperial Press, reprinted 1981, Lahore: Sandhu Printers.
- Low, D.A. (ed.). 1991. The Political Inheritance of Pakistan. London: Macmillan.
- Noman, Omar. 1988. The Political Economy of Pakistan. London: KPI.
- Papanek, G.F. 1967. Pakistan's Development: Social Goals and Private Incentives. Cambridge, Massachusetts: Harvard University Press.
- Raychaudhuri, Tapan and Irfan Habib (eds). 1982. The Cambridge Economic History of India, 2 vols. Cambridge: Cambridge University Press
- White, L.J. 1974. Industrial Concentration and Economic Power. Princeton, N.J.: Princeton University Press.
- Ziring, Lawrence. 1980. Pakistan: The Enigma of Political Development. Boulder, Colorado: Folkestone.
- Ali, Imran. 1987. ‘Malign Growth? Agricultural Colonisation and the Roots of Backwardness in the Punjab’, Past and Present, 114
- Ali, Imran. August 2002. ‘The Historical Lineages of Poverty and Exclusion in Pakistan’, South Asia, XXV(2).
- Ali, Imran and S. Mumtaz. 2002. ‘Understanding Pakistan—The Impact of Global, Regional, National and Local Interactions’, in Imran Ali, S. Mumtaz and J.L. Racine (eds), Pakistan: the Contours of State and Society. Karachi: Oxford University Press.
- Hasan, Parvez. 1998. Pakistan's Economy at the Crossroads: Past Policies and Present Imperatives. Karachi: Oxford University Press.
- Hussain, Ishrat. 1999. Pakistan: The Economy of an Elitist State. Karachi: Oxford University Press.
- Khan, Shahrukh Rafi. 1999. Fifty Years of Pakistan's Economy: Traditional Topics and Contemporary Concerns. Karachi: Oxford University Press.
- Kibria, Ghulam. 1999. Shattered Dream: Understanding Pakistan's Development. Karachi: Oxford University Press.
- Kukreja, Veena. 2003. Contemporary Pakistan: Political Processes, Conflicts and Crises. New Delhi: Sage Publications.
- Zaidi, S. Akbar. 1999. Issues in Pakistan's Economy. Karachi: Oxford University Press
- Faheem, Khan. 2010. Issues in Pakistan's Economy. Peshawar:
External links
| Wikimedia Commons has media related to Economy of Pakistan. |
| Wikiquote has quotations related to: Economy of Pakistan |
- Statistics Division, Government of Pakistan
- Ministry of Finance, Government of Pakistan
- Ministry of Commerce, Government of Pakistan
- World Bank Summary Trade Statistics Pakistan
- "Pakistan". The World Factbook. Central Intelligence Agency.
- Tariffs applied by Pakistan as provided by ITC's Market Access Map, an online database of customs tariffs and market requirements
Pakistan articles | |||||||||||||||||||
|---|---|---|---|---|---|---|---|---|---|---|---|---|---|---|---|---|---|---|---|
| |||||||||||||||||||
| |||||||||||||||||||
| |||||||||||||||||||
| |||||||||||||||||||
| |||||||||||||||||||
| |||||||||||||||||||
South Asian Free Trade Area (SAFTA) | ||
|---|---|---|
| Members | ||
| Sovereign states |
|
|---|---|
| States with limited recognition |
|
| Dependencies and other territories | |
| |