Economy of Hong Kong
The economy of Hong Kong is a highly developed free-market economy characterised by low taxation, almost free port trade and well-established international financial market.[17][18] Its currency, called the Hong Kong dollar, is legally issued by three major international commercial banks,[19] and is pegged to the US dollar.[20][21] Interest rates are determined by the individual banks in Hong Kong to ensure they are market driven.[22] There is no officially recognised central banking system, although the Hong Kong Monetary Authority functions as a financial regulatory authority.[23][24]
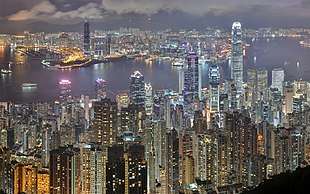 Central and Victoria Harbour of Hong Kong | |
| Currency | Hong Kong dollar (HKD) |
|---|---|
| 1 April – 31 March | |
Trade organisations | APEC and WTO |
Country group | |
| Statistics | |
| Population | |
| GDP | |
| GDP rank | |
GDP growth |
|
GDP per capita | |
GDP per capita rank | |
GDP by sector |
|
| 2.0% (2020 est.)[5] | |
Population below poverty line | 19.9% (2016 est.)[6] |
| 53.9 high (2016)[6] | |
Labour force | |
Labour force by occupation |
|
| Unemployment | |
Main industries | textiles, clothing, tourism, banking, shipping, electronics, plastics, toys, watches, clocks |
| External | |
| Exports | $537.8 billion (2017 est.)[6] |
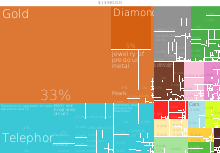
Export goods | electrical machinery and appliances, textiles, apparel, watches and clocks, toys, jewelry, goldsmiths' and silversmiths' wares, and other articles of precious or semi-precious materials[6] |
Main export partners | (2017 est.)[12] |
| Imports | $561.8 billion (2017 est.)[6] |
Import goods | raw materials and semi-manufactures, consumer goods, capital goods, foodstuffs, fuel (most is reexported)[6] |
Main import partners |
|
FDI stock | |
Gross external debt | |
| Public finances | |
| 0.1% of GDP (2017 est.)[6] | |
| +5.2% (of GDP) (2017 est.)[6] | |
| Revenues | 79.34 billion (2017 est.)[6] |
| Expenses | 61.64 billion (2017 est.)[6] |
| Standard & Poor's:[14] AAA (Domestic) AAA (Foreign) AAA (T&C Assessment) Outlook: Stable[15] Moody's:[15] Aa1 Outlook: Stable Fitch:[15] AA+ Outlook: Stable | |
Foreign reserves | US$431 billion (December 2017)[16] |
According to the Index of Economic Freedom,[25] Hong Kong has had the highest degree of economic freedom in the world since the inception of the index in 1995. Its economy is governed under positive non-interventionism, and is highly dependent on international trade and finance. For this reason it is regarded as among the most favorable places to start a company. In fact, a recent study shows that Hong Kong has come from 998 registered start-ups in 2014 to over 2800 in 2018, with eCommerce (22%), Fintech (12%), Software (12%) and Advertising (11%) companies comprising the majority.[26] The Economic Freedom of the World Index listed Hong Kong as the number one country, with a score of 8.97, in 2015.[27]
Hong Kong's economic strengths include a sound banking system, virtually no public debt, a strong legal system, ample foreign exchange reserves at around US $408 billion as of mid-2017, rigorous anti-corruption measures and close ties with mainland China.[28] The Hong Kong Stock Exchange is a favourable destination for international firms and firms from mainland China to be listed due to Hong Kong's highly internationalised and modernised financial industry along with its capital market in Asia, its size, regulations and available financial tools, which are comparable to London and New York.[29][30]
Hong Kong's gross domestic product has grown 180 times between 1961 and 1997. Also, the GDP per capita rose by 87 times within the same time frame.[31] Its economy is slightly larger than Israel's or Ireland's[32][33][34] and its GDP per capita at purchasing power parity was the sixth highest globally in 2011, higher than the United States and the Netherlands and slightly lower than Brunei. In 2009, Hong Kong's real economic growth fell by 2.8% as a result of the global financial turmoil.[35]
By the late 20th century, Hong Kong was the seventh largest port in the world and second only to New York and Rotterdam in terms of container throughput. Hong Kong is a full Member of World Trade Organization.[36] The Kwai Chung container complex was the largest in Asia; while Hong Kong shipping owners were second only to those of Greece in terms of total tonnage holdings in the world. The Hong Kong Stock Exchange is the sixth largest in the world, with a market capitalisation of about US$3.732 trillion.
Hong Kong has also had an abundant supply of labour from the regions nearby. A skilled labour force coupled with the adoption of modern British/Western business methods and technology ensured that opportunities for external trade, investment, and recruitment were maximised. Prices and wages in Hong Kong are relatively flexible, depending on the performance and stability of the economy of Hong Kong.[37]
Hong Kong raises revenues from the sale and taxation of land and through attracting international businesses to provide capital for its public finance, due to its low tax policy. According to Healy Consultants, Hong Kong has the most attractive business environment within East Asia, in terms of attracting foreign direct investment (FDI).[38] In 2013, Hong Kong was the third largest recipient of FDI in the world.[39]
Hong Kong ranked fourth on the Tax Justice Network's 2011 Financial Secrecy Index.[40]
The Hong Kong Government was the fourth highest ranked Asian government[41] in the World Economic Forum's Network Readiness Index (NRI), a measure of a government's information and communication technologies in 2016, and ranked 13th globally.[42]
Stock exchange
The Hong Kong Stock Exchange is the sixth largest in the world, with a market capitalisation of about US$3.732 trillion as of mid-2017. In 2006, the value of initial public offerings (IPO) conducted in Hong Kong was second highest in the world after London.[43] In 2009, Hong Kong raised 22 percent of IPO capital, becoming the largest centre of IPOs in the world.[44] The exchange is the world's 10th largest by turnover and third largest in China.[45]
Economic predictions
Since the 1997 handover, Hong Kong's economic future became far more exposed to the challenges of economic globalisation and the direct competition from cities in mainland China. In particular, Shanghai claimed to have a geographical advantage. The Shanghai municipal government dreamt of turning the city into China's main economic centre by as early as 2010. The target is to allow Shanghai to catch up to New York by 2040–2050.[46]
Positive non-interventionism
Hong Kong's economic policy has often been cited by economists such as Milton Friedman and the Cato Institute as an example of laissez-faire capitalism, attributing the city's success to the policy. However, others have argued that the economic strategy is not adequately characterised by the term laissez-faire.[47] They point out that there are still many ways in which the government is involved in the economy, some of which exceed the degree of involvement in other capitalist countries. For example, the government is involved in public works projects, healthcare, education, and social welfare spending. Further, although rates of taxation on personal and corporate income are low by international standards, unlike most other countries Hong Kong's government raises a significant portion of its revenues from land leases and land taxation. All land in Hong Kong is owned by the government and is leased to private developers and users on fixed terms, for fees which are paid to the state treasury. By restricting the sale of land leases, the Hong Kong government keeps the price of land at what some consider as artificially high prices and this allows the government to support public spending with a low tax rate on income and profit.[48]
Economic freedom
Hong Kong has been ranked as the world's freest economy in the Index of Economic Freedom of The Heritage Foundation for 24 consecutive years, since its inception in 1995.[25][49] The index measures restrictions on business, trade, investment, finance, property rights and labour, and considers the impact of corruption, government size and monetary controls in 183 economies. Hong Kong is the only economy to have scored 90 points or above on the 100-point scale, achieved in 2014 and 2018.[50]
Economic data
The following table shows the main economic indicators in 1980–2017. Inflation under 2 % is in green.[51]
| Year | GDP (in Bil. US$ PPP) |
GDP per capita (in US$ PPP) |
GDP growth (real) |
Inflation rate (in Percent) |
Unemployment (in Percent) |
Government debt (in % of GDP) |
|---|---|---|---|---|---|---|
| 1980 | 34.5 | 6,771 | 3.8 % | n/a | ||
| 1981 | n/a | |||||
| 1982 | n/a | |||||
| 1983 | n/a | |||||
| 1984 | n/a | |||||
| 1985 | n/a | |||||
| 1986 | n/a | |||||
| 1987 | n/a | |||||
| 1988 | n/a | |||||
| 1989 | n/a | |||||
| 1990 | n/a | |||||
| 1991 | n/a | |||||
| 1992 | n/a | |||||
| 1993 | n/a | |||||
| 1994 | n/a | |||||
| 1995 | n/a | |||||
| 1996 | n/a | |||||
| 1997 | n/a | |||||
| 1998 | n/a | |||||
| 1999 | n/a | |||||
| 2000 | n/a | |||||
| 2001 | 3.3 % | |||||
| 2002 | ||||||
| 2003 | ||||||
| 2004 | ||||||
| 2005 | ||||||
| 2006 | ||||||
| 2007 | ||||||
| 2008 | ||||||
| 2009 | ||||||
| 2010 | ||||||
| 2011 | ||||||
| 2012 | ||||||
| 2013 | ||||||
| 2014 | ||||||
| 2015 | ||||||
| 2016 | ||||||
| 2017 |
GDP[52]
- GDP (nominal, 2017) – HK$2,669,009 million
- GDP – real growth rate: +3.8% (2017)
- GDP – per capita: HK$360,000 (2017)
- GDP – composition by sector [53] (2015):
- Finance and insurance: 17.6%
- Tourism: 5.0%
- Trade: 22.2%
- Professional Services: 12.4%
- Other Sectors: 42.8%
| Economy of Hong Kong |
|---|
| Identity |
| Resources |
| Companies |
|
| Other Hong Kong topics |
|
|
| Hong Kong Portal |
Population[52]
Labour[56]
- Labour force: 3.9 million (mid-2017)
- Employed: 3.86 million (96.8%, mid-2017)
- Public administration, social and personal services 510,321
- Finance and insurance 223.221
- Import/export, wholesale and retail trade 808,251
- Transport, storage, postal and courier service 178,1
- Average Work Week: 45 hours
- Unemployed: 128,200 (3.1%, mid-2017)
- Underemployed: 44,200 (1.2%, mid-2017)
FY 2019–20 budget[57]
- Total Revenues: HK$626.1 billion
- Total Expenditures: HK$607.8 billion
- Government debt HK$92.3 billion (US$11.89 billion; 3rd Quarter of 2019)
Trade (selective data for various years)
- Two-way Trade: US$823.9 billion, +23.6% (2010), +11.1% p.a. (1986–2010)
- With mainland China:' $402.6 billion, +24.2% (2010), 48.9% share
- Exports: $459.4 billion, -0.5% (2016)
- To mainland China:' $205.7 billion, +26.5% (2010), 52.7% share
- Re-exports: $381.2 billion, +22.8% (2010), +14.3% p.a. (1986–2010)
- To mainland China:' $247.7 (2016)
- Imports: $513.8 billion, +9.1% (2016),
- From mainland China:' $245.3 billion (2016)
Poverty
The international poverty line is a monetary threshold under which an individual is considered to be living in poverty. This threshold is calculated using Purchasing Power Parity.[58] According to the World Bank, the international poverty line was most recently updated in October 2015, in which it was increased from $1.25 per day to $1.90 per day using the value of 2011 dollars.[59] Raising this threshold helps account for changes in costs of living, which directly effects individuals ability to obtain basic necessities across countries. With Hong Kong being one of the largest and most expensive cities in the world, there is no surprise that a portion of the population is living in poverty.
Recent figures show that 1.37 million people are living below the poverty line and struggling to survive on HK$4,000 ($510 USD) per month for a one person household, HK$9,800 for a two-person household earning , and HK$15,000 or a three-person household.[60] The poverty rate in Hong Kong hit a high of 20.1%, but recent efforts by government programs have lowered this number to 14.7%.[61]
In December 2012, the Commission on Poverty (CoP) was reinstated to prevent and alleviate poverty with three primary functions; analyze the poverty situation, assist policy formulation and to assess policy effectiveness. Cash handouts have been credited with alleviating much of the poverty, but the extent in which poverty has been alleviated is still questionable. Although cash handouts raise households above the poverty line, they are still struggling to meet certain standards as the cost of living in Hong Kong steadily increases.
Coupled with these cash payments, statutory minimum wage is set to increase for a second time in the past 10 years. Statutory Minimum Wage (SMW) came into existence on May 1st 2011 and the SMW rate has been HK$34.5 per hour since May 2017. The Legislative Council in Hong Kong most recently approved the revision on the SMW rate to increase to HK$37.5 per hour, effective May 1st 2019.[62] Although the total statistics for Hong Kong show declining poverty, child poverty has recently increased .3 percentage points, up to a total of 23.1%, as a result of larger households due to children staying with their elderly parents.[63] With economic growth projected to slow in the coming years, poverty becomes an increasingly pressing issue.
Beyond benefiting the younger generation through cash handouts and minimum wage increases, expanded elderly allowances have been implemented to increase disposable incomes of the elderly population that can no longer work. As of February 1st 2019 the amount payable per month for eligible elderly population became HK$1,385 in an effort to raise households incomes living with elderly tenants. Although Hong Kong has become one of the largest growing cities in the world, much of the population is struggling to keep up with the rising costs of living.
One of the largest issues effecting low income families is the availability of affordable housing. Over the past decade, residential Hong Kong property prices have increased close to 242%, with growth finally starting to decelerate this year.[64] Considering housing is a basic necessity, prices have continuously increased while disposable incomes remain virtually unchanged. As the amount of affordable housing diminishes, it has become much harder for families to find homes in their home country. Public housing programs have been implemented by the government, but delayed construction and growing waitlists have not helped to the extent they planned for. Recent results from a Hong Kong think tank show that by 2022, the average citizen could wait up to 6 years for public housing.[65] Evidence shows that the availability of affordable housing has declined, forcing households to spend more on shelter and less on other necessities. These issues can lead to worse living conditions and imbalanced diets, both of which pose problems beyond just financial well being.
See also
- Mainland and HK Closer Economic Partnership Arrangement (CEPA)
- Mainland and Macau Closer Economic Partnership Arrangement (CEPA)
- Economy of China
- Economy of East Asia
- Individual Visit Scheme
- Positive non-interventionism
- The Hongs
- Taiwan Miracle
- Poverty Campaign: Speak Up
- Seamen's strike of 1922
- Nylonkong
References
- "World Economic Outlook Database, April 2019". IMF.org. International Monetary Fund. Archived from the original on 21 December 2019. Retrieved 29 September 2019.
- "World Bank Country and Lending Groups". datahelpdesk.worldbank.org. World Bank. Archived from the original on 21 August 2016. Retrieved 29 September 2019.
- "Population, total". data.worldbank.org. World Bank. Archived from the original on 16 August 2019. Retrieved 5 July 2020.
- "World Economic Outlook Database, October 2019". IMF.org. International Monetary Fund. Retrieved 17 October 2019.
- "World Economic Outlook Database, April 2020". IMF.org. International Monetary Fund. Retrieved 9 May 2020.
- "The World Factbook". CIA.gov. Central Intelligence Agency. Archived from the original on 26 January 2019. Retrieved 25 January 2019.
- "Human Development Index (HDI)". hdr.undp.org. HDRO (Human Development Report Office) United Nations Development Programme. Archived from the original on 14 August 2019. Retrieved 11 December 2019.
- "Inequality-adjusted Human Development Index (IHDI)". hdr.undp.org. HDRO (Human Development Report Office) United Nations Development Programme. Archived from the original on 11 December 2019. Retrieved 11 December 2019.
- "Labor force, total - Hong Kong SAR, China". data.worldbank.org. World Bank. Archived from the original on 14 August 2019. Retrieved 11 December 2019.
- "Employment to population ratio, 15+, total (%) (national estimate)". data.worldbank.org. World Bank. Archived from the original on 24 August 2019. Retrieved 24 August 2019.
- "Ease of Doing Business in Hong Kong SAR, China". Doingbusiness.org. Archived from the original on 7 February 2017. Retrieved 24 November 2017.
- "Export Partners of Hong Kong". The World Factbook. 2017. Archived from the original on 6 December 2018. Retrieved 26 November 2018.
- "Import Partners of Hong Kong". The World Factbook. 2017. Archived from the original on 6 August 2016. Retrieved 26 November 2018.
- "Sovereigns rating list". Standard & Poor's. Archived from the original on 28 September 2011. Retrieved 26 May 2011.
- Rogers, Simon; Sedghi, Ami (15 April 2011). "How Fitch, Moody's and S&P rate each country's credit rating". The Guardian. London. Archived from the original on 1 August 2013. Retrieved 31 May 2011.
- "International Reserves and Foreign Currency Liquidity – Hong Kong". International Monetary Fund. 5 May 2011. Archived from the original on 25 September 2011. Retrieved 31 May 2011.
- Mizuoka, Fujio (2018). Contrived Laissez-Faireism: The Politico-Economic Structure of British Colonialism in Hong Kong. Springer Publishing. p. 26. ISBN 978-3319697932.
- "The Profitability of the Banking Sector in Hong Kong" (PDF). Hkma.gov.hk. Archived (PDF) from the original on 14 June 2018. Retrieved 27 July 2018.
- Legal Tender Notes Issue Ordinance Archived 3 May 2015 at the Wayback Machine. Legislation.gov.hk (30 June 1997)
- "Monetary Stability" (PDF). Hkma.gov.hk. Archived from the original (PDF) on 5 June 2013. Retrieved 27 July 2018.
- "Triennial Central Bank Survey of Foreign Exchange and Derivatives Market Activity in April 2007" (PDF). Triennial Central Bank Survey 2007. Bank for International Settlements: 7. September 2007. Archived (PDF) from the original on 6 December 2017. Retrieved 5 September 2010.
- Gough, Neil; Sang-Hun, Choe (19 July 2012). "Asian Financial Regulators Examine Local Lending Rates". The New York Times. Archived from the original on 20 September 2017. Retrieved 5 March 2017.
- "The Hong Kong Association of Banks". Hkab.org.hk. Archived from the original on 17 September 2018. Retrieved 5 November 2012.
- Chiu, Peter. "Hong Kong's Banking Industry Facing Keen Competition". Revues.org. Archived from the original on 14 May 2013. Retrieved 16 November 2012.
- "Index of Economic Freedom". Heritage Foundation. Archived from the original on 20 June 2010. Retrieved 21 June 2010.
- WHub (2018). "Hong Kong Start Up Ecosystem Whitepaper". Archived from the original on 17 September 2018.
- "Economic Freedom". Fraser Institute. Archived from the original on 16 September 2018. Retrieved 16 September 2018.
- "Hong Kong". U.S. Department of State. Archived from the original on 4 June 2019. Retrieved 23 May 2019.
- "London retains financial services crown". Financial Times.
- "The Global Financial Centres Index 13" (PDF). Zyen.com. March 2013. Archived (PDF) from the original on 18 November 2017. Retrieved 27 July 2018.
- Rikkie Yeung (2008). Moving Millions: The Commercial Success and Political Controversies of Hong Kong's Railways. Hong Kong University Press. ISBN 978-962-209-963-0.
- "Nominal GDP list of countries. Data for the year 2010". World Economic Outlook Database, September 2011. International Monetary Fund. Archived from the original on 5 July 2014. Retrieved 22 December 2011.
- "Gross domestic product (2009)" (PDF). The World Bank: World Development Indicators database. World Bank. 27 September 2010. Archived (PDF) from the original on 12 September 2009. Retrieved 5 October 2010.
- Field listing – GDP (official exchange rate) Archived 4 October 2008 at the Wayback Machine, The World Factbook
- "GDP growth (annual %)". World Bank. Archived from the original on 10 December 2019. Retrieved 11 June 2019.
- Hong Kong, China – Member information Archived 21 September 2012 at the Wayback Machine. WTO. Retrieved 1 November 2012.
- Hong Kong Monetary Authority (30 December 2009). "A Structural Investigation into the Price and Wage Dynamics in Hong Kong" (PDF). Archived (PDF) from the original on 19 June 2013. Retrieved 5 November 2012.
- "Hong Kong Company Formation". Archived from the original on 25 August 2013. Retrieved 27 August 2013.
- "UNCTAD World Investment Report". UNCTAD. Archived from the original on 17 August 2013. Retrieved 27 August 2013.
- "Archived copy". Archived from the original on 28 August 2013. Retrieved 2013-08-12.CS1 maint: archived copy as title (link)
- After Singapore, S. Korea and Taiwan
- "Global Information Technology Report 2016". World Economic Forum. Archived from the original on 17 September 2018. Retrieved 16 September 2018.
- Hong Kong surpasses New York in IPOs Archived 9 February 2009 at the Wayback Machine, International Herald Tribune, 25 December 2006. Retrieved 20 January 2007.
- "Hong Kong IPOs May Raise Record $48 Billion in 2010, E&Y Says". Bloomberg. 21 December 2009. Archived from the original on 29 April 2011. Retrieved 6 March 2017.
- After Shenzhen and Shanghai
- Richardson, Harry W. Bae, Chang-Hee C. (2005) Globalization and Urban Development: Advances in Spatial Science ISBN 3-540-22362-2
- Journal of Contemporary China (2000), 9(24) 291–308 "Archived copy" (PDF). Archived from the original (PDF) on 10 September 2008. Retrieved 12 December 2006.CS1 maint: archived copy as title (link)
- Geocities. "Doesn't Hong Kong show the potentials of 'free market' capitalism?". Archived from the original on 20 October 2009. Retrieved 9 October 2010.
- "The World's Freest Economy Is Also Its Least-Affordable Housing Market". Bloomburg BusinessWeek. Archived from the original on 25 January 2014. Retrieved 28 January 2014.
- "2014 Index of Economic Freedom – Hong Kong". The Heritage Foundation. Archived from the original on 1 October 2018. Retrieved 16 September 2018.
- "Report for Selected Countries and Subjects". www.imf.org. Retrieved 7 October 2018.
- "Gross Domestic Product (GDP)". Census and Statistics Department. 11 November 2016. Archived from the original on 20 January 2017. Retrieved 28 December 2016.
- "The Four Key Industries and Other Selected Industries". Census and Statistics Department. 29 November 2016. Archived from the original on 29 December 2016. Retrieved 28 December 2016.
- Hong Kong Census and Statistics Department
- "Table 1 : Summary Statistics" (PDF). Archived (PDF) from the original on 26 July 2011. Retrieved 25 February 2010.
- Quarterly Report on General Household Survey, July to September 2009, Census and Statistics Department
- "The 2019–20 Budget – Government Revenue and Expenditure". www.budget.gov.hk. Retrieved 9 February 2020.
- Kenton, Will. "International Poverty Line". Investopedia. Archived from the original on 18 April 2019. Retrieved 18 April 2019.
- "FAQs: Global Poverty Line Update". World Bank. Archived from the original on 18 April 2019. Retrieved 18 April 2019.
- "Record 1.37 million people living below poverty line in Hong Kong". South China Morning Post. 19 November 2018. Archived from the original on 18 April 2019. Retrieved 18 April 2019.
- "Analysis of poverty situation in Hong Kong in 2017 announced (with photo/video)". www.info.gov.hk. Archived from the original on 1 September 2019. Retrieved 18 April 2019.
- "Labour Department - Employee Rights and Benefits". www.labour.gov.hk. Archived from the original on 4 April 2019. Retrieved 18 April 2019.
- hermesauto (20 November 2018). "In Hong Kong, one in five are living in poverty". The Straits Times. Archived from the original on 18 April 2019. Retrieved 18 April 2019.
- Guide, Global Property (6 March 2019). "Investment Analysis of Hong Kong Real Estate Market". Global Property Guide. Archived from the original on 19 April 2019. Retrieved 18 April 2019.
- Chan, Holmes (18 April 2019). "By 2022, average Hongkonger could wait 6 years or more for public housing, think tank warns". Hong Kong Free Press HKFP. Archived from the original on 18 April 2019. Retrieved 18 April 2019.
External links
- Hong Kong Economy
- Hong Kong Government
- Hong Kong Economic Structure, The Economist, 10 January 2007. Retrieved 24 February 2007.
- The Hong Kong Experiment by Milton Friedman
- Economic History of Hong Kong Catherine R. Schenk, University of Glasgow
- Key Economic and Social Indicators – Hong Kong Census and Statistics Department
- Hong Kong Forex Nows (IBTimes HK)
- World Bank Summary Trade Statistics Hong Kong
- Tariffs applied by Hong Kong as provided by ITC's Market Access Map, an online database of customs tariffs and market requirements
| History | |
|---|---|
| Currency | |
| Industry and Business | |
| Government agencies | |
| Employment and Tax | |
| Infrastructure and Transport | |
| Rankings | |
| Finance and Banking |
|
| Agreements |
|
| Energy | |
| Other |
|
| |