Economy of Romania
The economy of Romania is a fast developing, high-income[28] mixed economy with a very high Human Development Index and a skilled labour force, ranked 15th in the European Union by total nominal GDP and 10th largest when adjusted by purchasing power parity.[29]
 | |
| Currency | Leu (RON, L) |
|---|---|
| Calendar year | |
Trade organisations | EU, WTO, BSEC |
Country group | |
| Statistics | |
| Population | |
| GDP | |
| GDP rank | |
GDP growth |
|
GDP per capita | |
GDP per capita rank | |
GDP by sector |
|
Population below poverty line | |
Labour force | |
Labour force by occupation |
|
| Unemployment | |
Average gross salary | RON 5,465 / €1,148 / $1,253 monthly (December, 2019) |
Average net salary | RON 3,340 / €702 / $766 monthly (December, 2019) |
Main industries | electric machinery and equipment, textiles and footwear, light machinery and auto assembly, mining, timber, construction materials, metallurgy, chemicals, food processing, petroleum refining |
| External | |
| Exports | |
Export goods | machinery and equipment, metals and metal products, textiles and footwear, chemicals, agricultural products, minerals and fuels |
Main export partners | |
| Imports | |
Import goods | machinery and equipment, chemicals, fuels and minerals, textile and products, agricultural products |
Main import partners | |
FDI stock | |
Gross external debt | |
| Public finances | |
| Revenues | 31.7% of GDP (2019)[23] |
| Expenses | 36.0% of GDP (2019)[23] |
Foreign reserves | |
Romania's economy ranks 40th in the world, with a $549 billion annual output (PPP). In recent years, Romania enjoyed some of the highest growth rates in the EU: 4.8% in 2016, 7.1% in 2017, 4.4% in 2018, and 4.1% in 2019.[5] In 2019 its GDP per capita in purchasing power standards reached 69% of the European Union average, up from 44% in 2007, the highest growth rate in the EU27.[30]
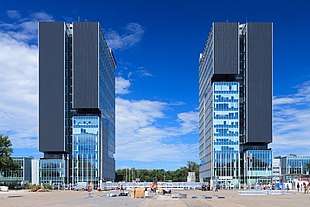
Romania is a leading destination in Central and Eastern Europe for foreign direct investment: the cumulative inward FDI in the country since 1989 totals more than $170 billion.[31] Romania is the largest electronics producer in Central and Eastern Europe. In the past 20 years Romania has also grown into a major center for mobile technology, information security, and related hardware research. The country is a regional leader in fields such as IT and motor vehicle production.[32][33][34] Bucharest, the capital city, is one of the leading financial and industrial centres in Eastern Europe.
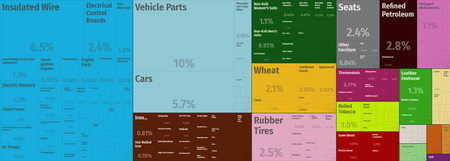
The top 10 exports of Romania are vehicles, machinery, chemical goods, electronic products, electrical equipment, pharmaceuticals, transport equipment, basic metals, food products, and rubber and plastics. Imports of goods and services increased 9.3%, while exports grew 7.6% in 2016, as compared to 2015.[35] Exports of goods and services are expected to grow by 5.6% in 2017, while imports are seen increasing by 8.5%, according to the latest CNP (National Prognosis Commission) projections.[36]
Industry in Romania generated 33.6% of the local gross domestic product (GDP) in the first half of 2018.[37]
History
Before World War II
The economy of Romania entered modernity with the Treaty of Adrianople in 1829, ending centuries of Turkish control. Economic growth was stimulated by several milestones: the discovery and industrial exploitation of oil in 1857, the political union between Wallachia and Moldavia in 1859, land reforms, adoption of a local currency, the leu (1867), the state independence (1877), as well as the building of an extensive rail-road system under king Carol I.
After the dissolution of neighbouring Russian and Austro-Hungarian empires following World War I, several Romanian-speaking provinces (Transylvania, Bessarabia, Banat, Bukovina) united with the Kingdom of Romania, forming the Romanian state in its modern form. The application of radical agricultural reforms and the passing of a new constitution created a democratic framework and allowed for quick economic growth (industrial production doubled between 1923–1938, despite the effects of the Great Depression).
Until World War II, Romania was Europe's second-largest oil and food producer.[38]
The communist period
After 1945, Soviet-occupied Romania became a member of the Eastern Bloc and switched to a Soviet-style command economy. During this period the country experienced rapid industrialization in an attempt to create a "multilaterally developed socialist society". Economic growth was further fuelled by foreign credits in the 1970s, eventually leading to a growing foreign debt, which peaked at $11–12 billion.[39]
Romania's debt was largely paid off during the 1980s by implementing severe austerity measures which deprived Romanians of basic consumer goods. In 1989, before the Romanian Revolution, Romania had a GDP of about 800 billion lei, or $53.6 billion.[40] Around 58% of the country's gross national income came from industry, and another 15% came from agriculture.[40] The minimum wage was 2,000 lei, or $135.[40]
Free market transition
The end of the communist period marked the beginning of a sharp economic downturn. Romania's weight in the global economy dropped to 0,3% in 1993 down from 0,8% in 1983.
Privatization of industry started with the 1992 transfer of 30% of the shares of some 6,000 state-owned enterprises to five private ownership funds, in which each adult citizen received certificates of ownership. The remaining 70% ownership of the enterprises was transferred to a state ownership fund, with a mandate to sell off its shares at the rate of at least 10% per year. The privatization law also called for direct sale of some 30 specially selected enterprises and the sale of "assets" (i.e., commercially viable component units) of larger enterprises.
As of 2008, inflation stood at 7.8%, up from 4.8% in 2007[41] estimated by the BNR at coming within 6% for the year 2006 (the year-on-year CPI, published in March 2007, is 3.66%). Also, since 2001, the economy has grown steadily at around 6–8%. Therefore, the PPP per capita GDP of Romania in 2008 was estimated to be between $12,200[42] and $14,064.[43]
Romania was the largest U.S. trading partner in Central-Eastern Europe until Nicolae Ceaușescu's 1988 renunciation of Most Favored Nation (non-discriminatory) trading status, which resulted in higher U.S. tariffs on Romanian products. Congress approved restoration of the MFN status effective 8 November 1993, as part of a new bilateral trade agreement. Tariffs on most Romanian products dropped to zero in February 1994 with the inclusion of Romania in the Generalized System of Preferences (GSP). Major Romanian exports to the U.S. include shoes and clothing, steel, and chemicals.
Romania signed an Association Agreement with the EU in 1992 and a free trade agreement with the European Free Trade Association (EFTA) in 1993, codifying Romania's access to European markets and creating the basic framework for further economic integration. Romania formally joined the EU in 2007.
During the later part of the Ceauşescu period, Romania had earned significant contracts from several developing countries, notably Iraq, for oil-related projects. In August 2005 Romania agreed to forgive 43% of the US$1.7 billion debt owed by an Iraq still largely occupied by the military forces of the U.S.-led "Coalition of the Willing", making Romania the first country outside of the Paris Club of wealthy creditor nations to forgive Iraqi debts.[44]
Growth in 2000–07 was supported by exports to the EU, primarily to Italy and Germany, and a strong recovery of foreign and domestic investment. Domestic demand is playing an ever more important role in underpinning growth as interest rates drop and the availability of credit cards and mortgages increases. Current account deficits of around 2% of GDP are beginning to decline as demand for Romanian products in the European Union increases. Accession to the EU gives further impetus and direction to structural reform.
In early 2004 the government passed increases in the value-added tax (VAT) and tightened eligibility for social benefits with the intention to bring the public finance gap down to 4% of GDP by 2006, but more difficult pension and healthcare reforms will have to wait until after the next elections. Privatization of the state-owned bank Banca Comercială Română took place in 2005. Intensified restructuring among large enterprises, improvements in the financial sector, and effective use of available EU funds is expected to accelerate economic growth. However, the Romanian economy was affected by the financial crisis of 2007–08 and contracted in 2009.[45]
After communism, Romania needed capital infusion, entrepreneurial and managerial skills, the fastest way to obtain that was through foreign direct investment (FDI).[46] As of 2018, total FDI in Romania was 81 billion EUR, 63% of total (51 billion) are greenfield investments. Top ten FDI stock by country of origin in 2018 were: Nederlands (23.9%), Germany (12.7%), Austria (12.2%), Italy (9.5%), Cyprus (6.2%), France (6%), Switzerland (4.5%), Luxembourg (4.2%), Belgium (2.2%) and United Kingdom (2.1%).[47]
Investments in Romania
The level of investment remains above EU average. Investment accounts for almost 25% of GDP in Romania as opposed to 19% of GDP in the EU, in 2016.[48]
EU membership (2007)
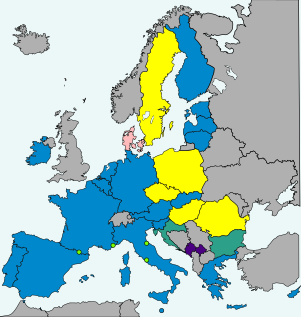
- European Union (EU) member states
-
5 not in ERM II, but obliged to join the eurozone on meeting convergence criteria (Czech Republic, Hungary, Poland, Romania, and Sweden).
- Non-EU member states
On 1 January 2007 Romania and Bulgaria entered the EU, giving the Union access to the Black Sea. This led to some immediate international trade liberalization. Romania is part of the European single market which represents more than 508 million consumers. Several domestic commercial policies are determined by agreements among European Union members and by EU legislation. This is to be contrasted with enormous current account deficits. Low interest rates guarantee availability of funds for investment and consumption. For example, a boom in the real estate market started around 2000 and has not subsided yet. At the same time annual inflation in the economy is variable and during the mid-2000s (2003–2008) has seen a low of 2.3% and high of 7.8%.
Romania adopted 1 January 2005 a flat tax of 16% to improve tax collection rates. Romania subsequently enjoyed the lowest fiscal burden in the European Union, until Bulgaria also switched to a flat tax of 10% in 2007. Since 2018 the flat rate was lowered to 10%.
Romania posted 6% economic growth in 2016, the highest among European Union member states. According to Bloomberg, the country's economic growth advanced at the fastest pace since 2008.[49] It is now considered the next tech-startup hub country in EU. Nowadays, that Romania's digital infrastructure ranks higher than other eastern and central European countries makes it an attractive place to start a tech business.[50]
Economy
GDP
IMF for 2019 published the following data:[51]
| Year | 2019 | 2020 | 2021 | 2022 | 2023 | 2024 |
|---|---|---|---|---|---|---|
| $/per capita (PPP) | 27,753 | 29,184 | 30,686 | 32,263 | 33,922 | 35,673 |
| $/per capita (Nominal) | 12,575 | 13,664 | 14,828 | 15,986 | 17,229 | 18,520 |
In the Romanian press the economy has been referred to as the "Tiger of the East" during the 2000s.[52] Romania is a country of considerable economic potential: over 10 million hectares of agricultural land, diverse energy sources (coal, oil, natural gas, hydro, nuclear, and wind), a substantial, if aging, manufacturing base and opportunities for expanded development in tourism on the Black Sea and in the mountains.
Investments
Net investments in Romania's economy totaled RON 33.6 billion (EUR 7.2 billion) in the first half of 2018, up by 5.8% compared to the same period of 2017, according to the National Statistics Institute (INS).[53]
In the same year (2018) foreign direct investment (FDI) was 81 billion, 63% (51 billion) being "green field"
Data
The following table shows the main economic indicators in 1980–2017. Inflation under 2% is in green.[54]
| Year | GDP (in Bil. US$ PPP) |
GDP per capita (in US$ PPP) |
GDP growth (real) |
Inflation rate (in Percent) |
Unemployment (in Percent) |
Government debt (in % of GDP) |
|---|---|---|---|---|---|---|
| 1980 | 107.0 | 4,769 | n/a | n/a | ||
| 1981 | n/a | n/a | ||||
| 1982 | n/a | n/a | ||||
| 1983 | n/a | n/a | ||||
| 1984 | n/a | n/a | ||||
| 1985 | 4.0 % | n/a | ||||
| 1986 | n/a | |||||
| 1987 | n/a | |||||
| 1988 | n/a | |||||
| 1989 | n/a | |||||
| 1990 | n/a | |||||
| 1991 | n/a | |||||
| 1992 | n/a | |||||
| 1993 | n/a | |||||
| 1994 | n/a | |||||
| 1995 | n/a | |||||
| 1996 | n/a | |||||
| 1997 | n/a | |||||
| 1998 | n/a | |||||
| 1999 | n/a | |||||
| 2000 | 17.6 % | |||||
| 2001 | ||||||
| 2002 | ||||||
| 2003 | ||||||
| 2004 | ||||||
| 2005 | ||||||
| 2006 | ||||||
| 2007 | ||||||
| 2008 | ||||||
| 2009 | ||||||
| 2010 | ||||||
| 2011 | ||||||
| 2012 | ||||||
| 2013 | ||||||
| 2014 | ||||||
| 2015 | ||||||
| 2016 | ||||||
| 2017 | ||||||
| 2018 | ||||||
| 2019 |
National budget
The planned national budget for 2017 is 422 billion lei ($103 billion), with an estimated budget deficit to GDP of 1.1%.
Growing middle class
Romania has growing middle and upper classes with relatively high per-capita income. World Bank estimated that in 2002 99% of the urban and 94% of the rural population had access to electricity. In 2004, 91% of the urban and only 16% of the rural population had access to improved water supply and 94% of the urban population had access to improved sanitation.[55] In 2017 there were about 22.5 million mobile phone users in Romania and about 18 million with internet access.
In March 2017, the gross average monthly wage was RON 3,256 (€716), and the net average monthly wage was RON 2,342 (€515).[56]
Neighbors
Countries tend to benefit from sharing borders with developed markets as this facilitates trade and development. Below is a table of Romania's neighboring countries, their GDP per capita, and trade values between the pairs. In 2017, 11.58% of Romanian exports went to its neighbors; while 12.95% of imports came from these five countries. For comparison, Germany alone accounted for 23% of Romania's exports and 20.1% of its imports.[57]
| Country | GDP per capita, (current US$) 2018[58] |
Difference in % |
|---|---|---|
| Hungary | 16,162 | +31.4 |
| Romania | 12,301 | |
| Bulgaria | 9,273 | −24.6 |
| Serbia | 7,247 | −41.1 |
| Moldova | 3,227 | −73.8 |
| Ukraine | 3,095 | −74.8 |
Minimum wage in Romania
The minimum gross wage in the Romanian economy amounts to RON 2,230 (≈EUR 467) from 1 January 2020. For employees working on positions that require upper education, the minimum gross salary reaches RON 2,350 (≈EUR 492). The same minimum wage applies to employees with a seniority of over 15 years.
Wealth per adult
In 2018, the median wealth per adult in Romania was estimated by Credit Suisse at USD 6,658. Average wealth per adult was US$20,321.[59]
62% of the 15.6 million Romanian adults had a wealth of less than US$10,000.[59]
Tourism
Romania is a popular tourist destination, with more than 15.7 million domestic and foreign tourists in 2018.
Romania has cities of great cultural interest (Bucharest, Constanța, Brașov, Timișoara, Cluj-Napoca or Alba Iulia), beaches and seaside resorts, ski resorts, and well-preserved rural regions appreciated for their beauty and tranquillity. Romania is the destination of many religious pilgrimages, hosting several thousands visitors each year.
Currency
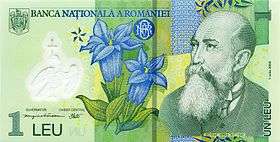
The leu (pronounced [ˈlew]), plural: lei ([ˈlej]); (ISO 4217 code RON; numeric code 946), "leo" (lion) in English is the currency of Romania. It is subdivided into 100 bani (singular: ban). On 1 July 2005, Romania underwent a currency reform, switching from the previous leu (ROL) to a new leu (RON). 1 RON is equal to 10,000 ROL. Romania joined the European Union on 1 January 2007 and initially hoped to adopt the euro in 2014,[60] but with the deepening of the Euro crisis and with its own problems, such as a low workforce productivity, postponed its adoption plans indefinitely.[61]
Fulfillment of the Maastricht criteria
Romania, as a member state of the European Union, is required to adopt the common European currency, the Euro. For this reason Romania must fulfil the five Maastricht criteria, of which it met none as of June 2020.
| Convergence criteria | ||||||||
|---|---|---|---|---|---|---|---|---|
| Assessment month | Country | HICP inflation rate[62][nb 1] | Excessive deficit procedure[63] | Exchange rate | Long-term interest rate[64][nb 2] | Compatibility of legislation | ||
| Budget deficit to GDP[65] | Debt-to-GDP ratio[66] | ERM II member[67] | Change in rate[68][69][nb 3] | |||||
| 2020 ECB Report[nb 4] | Reference values | Max. 1.8%[nb 5] (as of 31 Mar 2020) |
None open (as of 7 May 2020) | Min. 2 years (as of 7 May 2020) |
Max. ±15%[nb 6] (for 2019) |
Max. 2.9%[nb 7] (as of 31 Mar 2020) |
Yes[70][71] (as of 24 March 2020) | |
| Max. 3.0% (Fiscal year 2019)[72] |
Max. 60% (Fiscal year 2019)[72] | |||||||
| 3.7% | Open | No | -2.0% | 4.4% | No | |||
| 4.3% | 35.2% | |||||||
- Notes
- The rate of increase of the 12-month average HICP over the prior 12-month average must be no more than 1.5% larger than the unweighted arithmetic average of the similar HICP inflation rates in the 3 EU member states with the lowest HICP inflation. If any of these 3 states have a HICP rate significantly below the similarly averaged HICP rate for the eurozone (which according to ECB practice means more than 2% below), and if this low HICP rate has been primarily caused by exceptional circumstances (i.e. severe wage cuts or a strong recession), then such a state is not included in the calculation of the reference value and is replaced by the EU state with the fourth lowest HICP rate.
- The arithmetic average of the annual yield of 10-year government bonds as of the end of the past 12 months must be no more than 2.0% larger than the unweighted arithmetic average of the bond yields in the 3 EU member states with the lowest HICP inflation. If any of these states have bond yields which are significantly larger than the similarly averaged yield for the eurozone (which according to previous ECB reports means more than 2% above) and at the same time does not have complete funding access to financial markets (which is the case for as long as a government receives bailout funds), then such a state is not be included in the calculation of the reference value.
- The change in the annual average exchange rate against the euro.
- Reference values from the ECB convergence report of June 2020.[70]
- Portugal, Cyprus, and Italy were the reference states.[70]
- The maximum allowed change in rate is ± 2.25% for Denmark.
- Portugal, Cyprus, and Italy were the reference states.[70]
Natural resources
Romania is an oil and gas producer. The pipeline network in Romania included 2,427 km for crude oil, 3,850 km for petroleum products, and 3,508 km for natural gas in 2006. Several major new pipelines are planned, especially the Nabucco Pipeline for Caspian oilfields, the longest one in the world. Romania could cash in four billion dollars from the Constanta-Trieste pipeline.[76]
Romania has considerable natural resources for a country of its size, including coal, iron ore, copper, chromium, uranium, antimony, mercury, gold, barite, borate, celestine (strontium), emery, feldspar, limestone, magnesite, marble, perlite, pumice, pyrites (sulfur), clay, arable land and hydropower.[41]
Romania's mineral production is adequate to supply its manufacturing output. Energy needs are also met by importing bituminous and anthracite coal and crude petroleum. In 2007 approximately 34 million tons of coal, approximately 4,000 tons of tungsten, 565,000 tons of iron ore, and 47,000 tons of zinc ore were mined. Lesser amounts of copper, lead, molybdenum, gold, silver, kaolin, and fluorite also were mined.
Energy
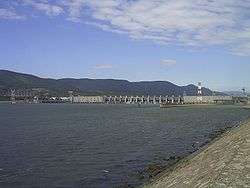
The energy sector is dominated by state-owned companies such as Termoelectrica, Hidroelectrica and Nuclearelectrica. Fossil fuels are the country's primary source of energy, followed by hydroelectric power.
Nuclear energy in Romania
Due to dependency on oil and gas imports from Russia, the country has placed an increasingly heavy emphasis on nuclear energy since the 1980s. The Cernavodă Nuclear Power Plant is the only one of its kind in Romania, although there are plans to build a second one in Transylvania, possibly after 2020.[77]
For domestic heating and cooking 48% of rural and small-town households use directly burned solid fuel (almost exclusively domestically produced wood) as the main energy source.[78]
Wind power had an installed capacity of 76 MW in 2008,[79] and 3028 MW in 2016.[80]The country has the largest wind power potential in Southeast Europe, with Dobruja listed as the second-best place in Europe to construct wind farms.[81] As a result, there are currently investor connection requests for over 12,000 MW.[82] There are also plans to build a number of solar power stations, such as the Covaci Solar Park, which will be one of the largest in the world.[83][84]
Physical infrastructure
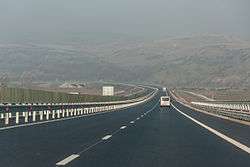
The volume of traffic in Romania, especially goods transportation, has increased in recent years due to its strategic location in South-East Europe. In the past few decades, much of the freight traffic shifted from rail to road. A further strong increase of traffic is expected in the future.
As of December 2019, 850 km [85] of motorways are in use with a small portion of Lugoj-Deva (between Margina and Holdea)to be finished while Sibiu-Pitesti is still tendering. The railway network, which was significantly expanded during the Communist years, is the fourth largest in Europe.[86]
Bucharest is the only city in Romania which has an underground railway system, comprising both the Bucharest Metro and the light rail system managed by Regia Autonomă de Transport Bucureşti. Although construction was planned to begin in 1941, due to geo-political factors, the Bucharest Metro was only opened in 1979. Now it is one of the most accessed systems of the Bucharest public transport network with an average ridership of 800,000 passengers during the workweek.[87] In total, the network is 71 km long and has 53 stations.[88]
Sectors of the economy
Gas and natural resources
Romania has become a natural gas exporter.[89] Romanian Scientist, Lazar Edeleanu, had managed, for the first time in the world, to refine oil based products with sulphur dioxide, in other words separation from the oil of some hydrocarbon groups, without their chemical alteration.[90]
Agriculture
Agriculture employs about 26% of the population (one of the highest rates in Europe) and contributes about 4.3% of GDP.[91][92] The Bărăgan is characterized by large wheat farms. Dairy products, pork, poultry, and apple production are concentrated in the western region.
Beef production is located in central Romania, while the production of fruits, vegetables, and wine ranges from central to southern Romania. Romania is a large producer of many agricultural products and is currently expanding its forestry and fishery industries. The implementation of the reforms and the Uruguay Round of the General Agreement on Tariffs and Trade (GATT) have resulted in reforms in the agricultural sector of the economy.
Fishing
Fishing is an economic mainstay in parts of eastern Romania and along the Black Sea coast, with important fish markets in places such as Constanta, Galati and Tulcea. Fish such as european anchovy, sprat, pontic shad, mullet, goby, whiting, garfish, Black-Sea Turbot or horse mackerel are landed at ports such as Constanta.
There has been a large scale decrease in employment in the fishing industry within Romania due to the EU's Common Fisheries Policy, which places restrictions on the total tonnage of catch that can be landed, caused by overfishing in the Black Sea. Along with the decline of sea-fishing, commercial fish farms – especially in salmon, have increased in prominence in the rivers and lochs of the east of Romania. Inland waters are rich in fresh water fish such as salmon, trout, and in particular, carp which traditionally has been the most popular fish, including its eggs (icre), fresh or canned.
Industry
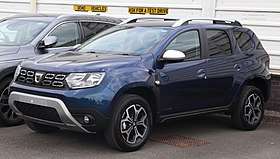
Car industry
IT and other Industry
Romania has been successful in developing its industrial sector in recent years. Industry and construction accounted for 32% of gross domestic product (GDP) in 2003, a comparatively large share even without taking into account related services. The sector employed 26.4% of the workforce. Romania excels in the production of automobiles, machine tools, and chemicals. In 2013, some 410,997 automobiles were produced in Romania, up from 78,165 in 2000. As of 2018, the turnover generated by Romania's automobile industry was estimated at 28 billion Euros, with 230,000 Romanians employed in the sector.[93]
In 2004 Romania enjoyed one of the largest world market share in machine tools (5.3%). Romanian-based companies such as Dacia, Petrom, Rompetrol, Bitdefender, Romstal and Mobexpert have expanded operations throughout the region. However, small- to medium-sized manufacturing firms form the bulk of Romania's industrial sector.
Romania's industrial output is expected to advance 9% in 2007, while agriculture output is projected to grow 12%. Final consumption is also expected to increase by 11% overall – individual consumption by 14.4% and collective consumption by 10.4%. Domestic demand is expected to go up 12.7%.
Industrial output growth was 6.9% year-on-year in December 2009, making it the highest in the EU-27 zone which averaged −1.9%.[94]
Romania has the third-highest percentage of women working in information and communications technologies (ICT) in Europe. 29% of their workforce is made up of women.[50]
Services
In 2003 service sector constituted 55% of gross domestic product (GDP), and the sector employed 51.3% of the workforce. The subcomponents of services are financial, renting, and business activities (20.5%); trade, hotels and restaurants, and transport (18%); and other service activities (21.7%). The service sector in Romania has expanded in recent years, employing some 47% of Romanians and accounting for slightly more than half of GDP.
The largest employer is the retail sector, employing almost 12% of Romanians. The retail industry is mainly concentrated in a relatively small number of chain stores clustered together in shopping malls. In recent years the rise of big-box stores, such as Cora (hypermarket) (of the France) and Carrefour (a subsidiary of the French), have led to fewer workers in this sector and a migration of retail jobs to the suburbs.
Biotechnology industry
Romania is aggressively promoting and developing its biotechnology industry. Hundred of millions of dollars were invested into the sector to build up infrastructure, fund research and development and to recruit top international scientists to Romania. Romania features one of the world's newest competitive bio-industries, in key areas as pharmacogenomics, protein engineering, glyco-engineering, tissue engineering, bio-informatics, genome medicine and preventive medicine. Romania is devoting substantial resources to developing universities and R&D facilities, increasing bioventure startups, growing bio-clusters (communities of biotechnology companies and institutions) and developing human resources, all with the goal of making it one of the world's most advanced biotechnology regions.
Regional variation
The strength of the Romanian economy varies from region to region. PPP, and GDP per capita is the highest in Bucharest. The following table shows the highest GDP per capita of the other 4 counties, with data supplied by CNP.[95]
| Rank | County | GDP per capita (2018)[96] (EUR) |
|---|---|---|
| 1 | Bucharest | 27,189 |
| 2 | Timiș | 13,996 |
| 3 | Constanța | 13,608 |
| 4 | Cluj | 12,682 |
| 5 | Brașov | 11,908 |
The highest GDP per capita is found in Bucharest and surrounding Ilfov County. Values well above the national average are found in Timiș, Argeș, Braşov, Cluj, Constanţa, Sibiu and Prahova. Values well below the national average are found in: Vaslui, Botoşani, Călăraşi, Neamţ, Vrancea, Suceava, Giurgiu, Mehedinţi, Olt and Teleorman.[95]
Foreign trade
In 2017, Romania's largest trading partner was Germany, followed by Italy. Romania's main imports and exports are electrical machinery, motor vehicles & parts and industrial machinery.[57] While Romania imports substantial quantities of grain, it is largely self-sufficient in other agricultural products and food stuffs, due to the fact that food must be regulated for sale in the Romania retail market, and hence imports almost no food products from other countries.[97]
Romania imported in 2006 food products of 2.4 billion euros, up almost 20% versus 2005, when the imports were worth slightly more than 2 billion euros. The EU is Romania's main partner in the trade with agri-food products. The exports to this destination represent 64%, and the imports from the EU countries represent 54%. Other important partners are the CEFTA countries, Turkey, Republic of Moldova and the USA.[97] Despite a decline of the arms industry in the post-communist era, Romania is a significant exporter of military equipment, accounting for 3–4% of the world total in 2007. EU members are represented by a single official at the World Trade Organization.
During the first trimester of 2010, Romanian exports increased by 21%, one of the largest rates in the European Union. The trade deficit stood at roughly 2 billion EUR, the eighth largest in the EU.[98]
Miscellaneous data
Households with access to fixed and mobile telephone access[99]
- landline telephone – 76% (2017)
- mobile telephone – 115% (2017)
Broadband penetration rate
- 79% (2019)[100]
Individuals using computer and internet[99]
- computer – 74% (2017)
- internet – 87% (2017)
Notes
- Kosovo is the subject of a territorial dispute between the Republic of Kosovo and the Republic of Serbia. The Republic of Kosovo unilaterally declared independence on 17 February 2008, but Serbia continues to claim it as part of its own sovereign territory. The two governments began to normalise relations in 2013, as part of the 2013 Brussels Agreement. Kosovo is currently recognized as an independent state by 97 out of the 193 United Nations member states. In total, 112 UN member states recognized Kosovo at some point, of which 15 later withdrew their recognition.
References
- "World Economic Outlook Database, April 2019". IMF.org. International Monetary Fund. Retrieved 29 September 2019.
- "World Bank Country and Lending Groups". datahelpdesk.worldbank.org. World Bank. Retrieved 1 July 2020.
- "Population on 1 January". ec.europa.eu/eurostat. Eurostat. Retrieved 13 July 2020.
- "World Economic Outlook Database, October 2019". IMF.org. International Monetary Fund. Retrieved 16 October 2019.
- "World Economic Outlook Database, April 2020". IMF.org. International Monetary Fund. Retrieved 16 April 2020.
- "Global Economic Prospects, June 2020". openknowledge.worldbank.org. World Bank. p. 80. Retrieved 16 June 2020.
- "CIA World Factbook". CIA.gov. Central Intelligence Agency. Retrieved 20 January 2019.
- "Poverty headcount ratio at national poverty lines (% of population) - Romania". data.worldbank.org. World Bank. Retrieved 21 March 2020.
- "People at risk of poverty or social exclusion". ec.europa.eu. Eurostat. Retrieved 8 May 2020.
- "Europe Central Asia Economic Update, Spring 2020 : Fighting COVID-19". openknowledge.worldbank.org. World Bank. p. 67, 68. Retrieved 9 April 2020.
- "Gini coefficient of equivalised disposable income - EU-SILC survey". ec.europa.eu/eurostat. Eurostat. Retrieved 8 May 2020.
- "Human Development Index (HDI)". hdr.undp.org. HDRO (Human Development Report Office) United Nations Development Programme. Retrieved 11 December 2019.
- "Inequality-adjusted HDI (IHDI)". hdr.undp.org. UNDP. Retrieved 22 May 2020.
- "Labor force, total - Romania". data.worldbank.org. World Bank. Retrieved 1 November 2019.
- "Employment rate by sex, age group 20-64". ec.europa.eu/eurostat. Eurostat. Retrieved 27 May 2019.
- "Romania: Distribution of employment by economic sector from 2007 to 2017". Statista.com. Retrieved 1 May 2019.
- "Unemployment by sex and age - monthly average". appsso.eurostat.ec.europa.eu. Eurostat. Retrieved 2 July 2020.
- "Youth unemployment rate by sex, age (15-24) and country of birth". appsso.eurostat.ec.europa.eu. Eurostat. Retrieved 26 December 2019.
- "Ease of Doing Business in Romania". DoingBusiness.org. Retrieved 21 November 2017.
- "The World Factbook — Central Intelligence Agency". www.CIA.gov. Retrieved 4 March 2018.
- "Export Partners of Romania". CIA World Factbook. 2018. Retrieved 14 February 2018.
- "Import Partners of Romania". CIA World Factbook. 2018. Retrieved 14 February 2018.
- "Euro area and EU27 government deficit both at 0.6% of GDP" (PDF). ec.europa.eu/eurostat. Eurostat. Retrieved 28 April 2020.
- "Sovereigns rating list". Standard & Poor's. Retrieved 13 April 2014.
- Rogers, Simon; Sedghi, Ami (15 April 2011). "How Fitch, Moody's and S&P rate each country's credit rating". The Guardian. London. Retrieved 28 May 2011.
- "Moody's changes outlook on Romania's Baa3 ratings to positive; affirms ratings". Moody's. Retrieved 11 December 2015.
- "Scope affirms Romania's credit rating at BBB-; Outlook remains Negative". Scope Ratings. Retrieved 12 June 2020.
- "World Bank Country and Lending Groups". datahelpdesk.worldbank.org. World Bank. Retrieved 1 July 2020.
- "World Economic Outlook Database October 2018 -- WEO Groups and Aggregates Information". Retrieved 28 April 2019.
- "GDP per capita in PPS". ec.europa.eu/eurostat. Eurostat. Retrieved 30 April 2020.
- "The World Factbook". Retrieved 16 September 2014.
- "Archived copy". Archived from the original on 26 December 2010. Retrieved 21 January 2011.CS1 maint: archived copy as title (link)
- "Statistic definitions" (PDF). OICA.net. Retrieved 24 September 2017.
- "BCR: Romania poate adopta euro in 2014 23904". Retrieved 16 September 2014.
- "Romania's economy grows by 4.8% y/Y in Q4 2016, 1.4% q/Q - revised data".
- "Romanian finmin analysts keep 2017 GDP growth forecast at 5.2%". SeeNews.com. Retrieved 24 September 2017.
- "Industry and trade, the main growth engines for RO economy in first half".
- "Business in Romania: a country that's fast off the Bloc – Two years of EU membership have transformed the business face of Romania and savvy UK firms are reaping the rewards. Paul Bray reports". The Daily Telegraph. London. 24 February 2010. Retrieved 1 May 2010.
- Klepper, Nicolae. ROMANIA An Illustrated History. NY:Hippocrene Books, Inc., 2002, page 230
- După douăzeci de ani. Economia României în 1989 Archived 24 December 2009 at the Wayback Machine, 21 decembrie 2009, standard.ro, accesat la 2 ianuarie 2010
- "The World Factbook". Retrieved 16 September 2014.
- "GDP – per capita (PPP)". Retrieved 16 September 2014.
- Data refer to the year 2008. PPP GDP 2008 & Population 2008, World Development Indicators database, World Bank, 15 September 2009. Note: Per capita values were obtained by dividing the PPP GDP data by the Population data.
- "Romania isi va recupera datoriile din Irak – BloomBiz.ro – Your Business Community". BloomBiz.ro. Retrieved 24 September 2017.
- "Index of /". Retrieved 3 March 2015.
- "A Better Red: The Transition from Communism to Coca-Cola in Romania". Mises Institute. 13 April 2019.
- "Foreign Direct Investment". National Bank of Romania.
- "The European Semester" (PDF). European Commission - European Commission. Retrieved 24 September 2017.
- "Eurostat: Romania posts biggest economic growth in EU in 2016 Q2". Business-Review.eu. 12 August 2016. Retrieved 24 September 2017.
- "One of the poorest countries in the EU could be its next tech-startup hub". QZ.com. Retrieved 24 September 2017.
- "Report for Selected Countries and Subjects".
- Străuţ, Dan (3 June 2008). "România, "tigrul" Estului" [Romania, the "Tiger" of the East]. Adevărul (in Romanian). Archived from the original on 20 September 2008.
- "Investments in Romanian economy, up 5.8% in the first half of this year".
- "Report for Selected Countries and Subjects". www.imf.org. Retrieved 14 September 2018.
- "See Table 4.1" (PDF). WorldBank.org. Retrieved 24 September 2017.
- "Earnings - since 1991, the monthly series". Romanian National Institute of Statistics. Archived from the original on 20 May 2017. Retrieved 5 June 2017.
- "Romania: Trade Statistics". GlobalEDGE. Retrieved 1 May 2019.
- "GDP per capita (current US$) - Romania, Moldova, Hungary, Serbia, Bulgaria, Ukraine". data.WorldBank.org. Retrieved 28 December 2019.
- https://www.credit-suisse.com/media/assets/corporate/docs/about-us/research/publications/global-wealth-databook-2018.pdf
- "Romania hopes to introduce euro in 2014". Hotnews.ro. 26 January 2007. Retrieved 14 August 2007.
- Banking News (22 June 2012). "Croitoru (BNR): Adoptarea monedei euro, un orizont indepartat". Retrieved 22 July 2012.
- "HICP (2005=100): Monthly data (12-month average rate of annual change)". Eurostat. 16 August 2012. Retrieved 6 September 2012.
- "The corrective arm/ Excessive Deficit Procedure". European Commission. Retrieved 2 June 2018.
- "Long-term interest rate statistics for EU Member States (monthly data for the average of the past year)". Eurostat. Retrieved 18 December 2012.
- "Government deficit/surplus data". Eurostat. 22 April 2013. Retrieved 22 April 2013.
- "General government gross debt (EDP concept), consolidated - annual data". Eurostat. Retrieved 2 June 2018.
- "ERM II – the EU's Exchange Rate Mechanism". European Commission. Retrieved 2 June 2018.
- "Euro/ECU exchange rates - annual data (average)". Eurostat. Retrieved 5 July 2014.
- "Former euro area national currencies vs. euro/ECU - annual data (average)". Eurostat. Retrieved 5 July 2014.
- "Convergence Report 2020" (PDF). European Central Bank. 1 June 2020. Retrieved 13 June 2020.
- "Convergence Report - June 2020". European Commission. June 2020. Retrieved 13 June 2020.
- "European economic forecast - spring 2020". European Commission. 6 May 2020. Retrieved 13 June 2020.
- "Luxembourg Report prepared in accordance with Article 126(3) of the Treaty" (PDF). European Commission. 12 May 2010. Retrieved 18 November 2012.
- "EMI Annual Report 1994" (PDF). European Monetary Institute (EMI). April 1995. Retrieved 22 November 2012.
- "Progress towards convergence - November 1995 (report prepared in accordance with article 7 of the EMI statute)" (PDF). European Monetary Institute (EMI). November 1995. Retrieved 22 November 2012.
- Romania could cash in four billion dollars from the Constanta-Trieste pipeline. Pumping oil could pay off in Romania as benefits from the Constanta-Trieste pipeline could amount to more than four billion dollars. The benefits could range from 2.27 to 4.39 billion dollars over 20 years, depending on the capacity of the new oleo duct, according to Hill International's feasibility study.
- "Romania contruieste a doua centrala nucleara". Euractiv.ro. Retrieved 16 September 2014.
- "Global Alliance for Clean Cookstoves". CleanCookstoves.org. Archived from the original on 24 October 2014. Retrieved 24 September 2017.
- "Avalansa portugheza: Martifer pregateste o achizitie de 7 mil. euro pe eolian si un parc propriu, EDP primeste deja turbinele". Business Standard (in Romanian). 1 April 2009. Archived from the original on 23 July 2019. Retrieved 2 April 2009.
- http://www.ewea.org/fileadmin/files/library/publications/statistics/EWEA-Annual-Statistics-2015.pdf
- "Dobrogea, pe locul doi în Europa ca potenţial eolian" (in Romanian). Evenimentul Zilei. 5 February 2009. Retrieved 5 February 2009.
- "Potential de investitii in eolian de peste 4 mld. euro" (in Romanian). Business Standard. 5 February 2009. Retrieved 5 February 2009.
- "CJ Timis vrea sa construiasca un parc cu panouri solare, pe o suprafata de 60 de hectare". Business Standard (in Romanian). 27 May 2009. Retrieved 27 May 2009.
- "Portalul national de Administratie Publica". Archived from the original on 6 July 2014. Retrieved 16 September 2014.
- http://www.130km.ro/calendar.html#trecute. Missing or empty
|title=(help) - "RAD - Network Access & Telecommunications Solutions". Archived from the original on 4 August 2014. Retrieved 16 September 2014.
- "Bucharest Metrorex - Railway Technology". Retrieved 16 September 2014.
- "METROREX". Retrieved 16 September 2014.
- "Romania's Black Sea natural gas production to start in 2018 (official) – AGERPRES". www.AgerPres.ro. Archived from the original on 24 September 2017. Retrieved 24 September 2017.
- "Oil and Gas Industry in Romania - ROPEPCA - Romanian Petroleum Exploration and Production Companies Association". www.Ropepca.ro. Archived from the original on 24 September 2017. Retrieved 24 September 2017.
- https://data.worldbank.org/indicator/NV.AGR.TOTL.ZS?locations=RO
- https://ec.europa.eu/eurostat/statistics-explained/index.php?title=Farmers_in_the_EU_-_statistics
- https://www.romania-insider.com/romania-automotive-industry-2018
- "Romania reports highest December 2009 industrial output growth in EU27 - FINANCIARUL - ultimele stiri din Finante, Banci, Economie, Imobiliare si IT". Retrieved 16 September 2014.
- "TOPUL celor mai bogate 5 judete din Romania dupa PIB-ul pe cap de locuitor". Retrieved 30 March 2016.
- . March 2015 https://graidecluj.ro/un-clujean-produce-anual-mai-putin-de-jumatate-fata-de-un-bucurestean/. Retrieved 30 March 2016. Missing or empty
|title=(help) - Romania imports agri-food products of 2.4 bn euros in 2006 – Danmarks ambassade Bukarest Archived 13 April 2008 at the Wayback Machine
- "România ocupă locul doi în UE după creşterea exporturilor din primul trimestru - Mediafax". Mediafax.ro. Retrieved 16 September 2014.
- "IT and telecommunications in Central and Eastern Europe". Archived from the original on 11 October 2013. Retrieved 16 September 2014.
- https://www.statista.com/statistics/702532/broadband-internet-household-penetration-romania/
| Wikimedia Commons has media related to Economy of Romania. |
Romania articles | |||||
|---|---|---|---|---|---|
| History |
|  | |||
| Geography |
| ||||
| Politics |
| ||||
| Economy | |||||
| Society |
| ||||