Economy of the Dominican Republic
The economy of the Dominican Republic is the eighth largest in Latin America, and is the largest in the Caribbean and Central American region. The Dominican Republic is an upper-middle income[14] developing country primarily dependent on mining, agriculture, trade, and services. The country is the site of the single largest gold mine in Latin America, the Pueblo Viejo mine.[15][16] Although the service sector has recently overtaken agriculture as the leading employer of Dominicans (due principally to growth in tourism and free-trade zones), agriculture remains the most important sector in terms of domestic consumption and is in second place (behind mining) in terms of export earnings. Tourism accounts for more than $1 billion in annual earnings. free-trade zone earnings and tourism are the fastest-growing export sectors. According to a 1999 International Monetary Fund report, remittances from Dominican Americans, are estimated to be about $1.5 billion per year. Most of these funds are used to cover basic household needs such as shelter, food, clothing, health care and education. Secondarily, remittances have financed small businesses and other productive activities.[17]
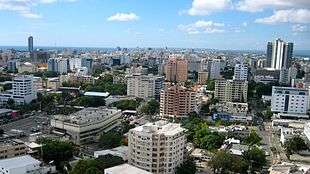 Santo Domingo is the capital and financial center of Dominican Republic | |
| Currency | 1 Dominican Peso (RD$) = 100 Centavos |
|---|---|
| Calendar year | |
Trade organizations | WTO |
Country group |
|
| Statistics | |
| GDP | |
GDP growth |
|
GDP per capita | |
GDP by sector | agriculture: 5.5%; industry: 33.8%; services: 60.8% (2017 est.) |
| 3.564% (2018)[3] | |
Population below poverty line | 30.5% (2016 est)[5][6] |
Labor force | 4.732 million (2017 est.) |
Labor force by occupation | agriculture: 14.6%; industry: 22.3%; services: 63.1% (2005) |
| Unemployment | 12.5% (2013 est.) |
Main industries | ferronickel and gold mining, textiles, cement, tobacco, and sugar production, tourism |
| External | |
| Exports | $10.33 billion (2017 est.) |
Export goods | ferronickel, sugar, gold, silver, coffee, cocoa, tobacco, meats, consumer goods |
Main export partners | |
| Imports | $19 billion (2017 est.) |
Import goods | foodstuffs, petroleum, cotton and fabrics, chemicals and pharmaceuticals |
Main import partners | |
FDI stock | $35.93 billion (31 December 2017 est.) |
Gross external debt | $29.69 billion (31 December 2017 est.) |
| Public finances | |
| 37.7% of GDP (2017 est.) | |
| Revenues | $7.11 billion (2010 est.) |
| Expenses | $8.634 billion (2010 est.) |
| B+ (Domestic) B+ (Foreign) BB (T&C Assessment) (Standard & Poor's)[13] | |
Foreign reserves | $6.233 billion (31 December 2017 est.) |
The Dominican Republic’s most important trading partner is the United States (about 40% of total commercial exchange). Other major trade partners are China, Haiti, Canada, Mexico, India, Spain, Brazil, Germany, the United Kingdom and Japan, in that quantitative order.[18] The country exports free-trade-zone manufactured products (garments, medical devices, and so on), gold, nickel, protection equipment, bananas, liquor, cocoa beans, silver, and sauces and seasonings. It imports petroleum, industrial raw materials, capital goods, and foodstuffs. On 5 September 2005, the Congress of the Dominican Republic ratified a free trade agreement with the U.S. and five Central American countries, the Dominican Republic – Central America Free Trade Agreement (CAFTA-DR). CAFTA-DR entered into force for the Dominican Republic on 1 March 2007. The total stock of U.S. foreign direct investment (FDI) in Dominican Republic as of 2006 was U.S. $3.3 billion, much of it directed to the energy and tourism sectors, to free trade zones, and to the telecommunications sector. Remittances were close to $2.7 billion in 2006.
An important aspect of the Dominican economy is the Free Trade Zone industry (FTZ), which made up U.S. $4.55 billion in Dominican exports for 2006 (70% of total exports). Reports show, however, that the FTZs lost approximately 60,000 between 2005 and 2007 and suffered a 4% decrease in total exports in 2006. The textiles sector experienced an approximate 17% drop in exports due in part to the appreciation of the Dominican peso against the dollar, Asian competition following expiration of the quotas of the Multi-Fiber Arrangement, and a government-mandated increase in salaries, which should have occurred in 2005 but was postponed to January 2006. Lost Dominican business was captured by firms in Central America and Asia. The tobacco, jewelry, medical, and pharmaceutical sectors in the FTZs all reported increases for 2006, which somewhat offset textile and garment losses. Industry experts from the FTZs expected that entry into force of the CAFTA-DR agreement will promote substantial growth in the FTZ sector for 2007.
An ongoing concern in the Dominican Republic is the inability of participants in the electricity sector to establish financial viability for the system. Three regional electricity distribution systems were privatized in 1998 via sale of 50% of shares to foreign operators; the Mejía administration repurchased all foreign-owned shares in two of these systems in late 2003. The third, serving the eastern provinces, is operated by U.S. concerns and is 50% U.S.-owned. The World Bank records that electricity distribution losses for 2005 totaled about 38.2%, a rate of losses exceeded in only three other countries. Industry experts estimate distribution losses for 2006 will surpass 40%, primarily due to low collection rates, theft, infrastructure problems and corruption. At the close of 2006, the government had exceeded its budget for electricity subsidies, spending close to U.S. $650 million. The government plans to continue providing subsidies. Congress passed a law in 2007 that criminalizes the act of stealing electricity, but it has not yet been fully implemented. The electricity sector is a highly politicized sector and the prospect of further effective reforms of the electricity sector is poor. Debts in the sector, including government debt, amount to more than U.S. $500 million. Some generating companies are under capitalized and at times unable to purchase adequate fuel supplies.[19][20]
Primary Industries
Agriculture
With almost 80% of the total land area suitable for crop production and about 17% of the labor force engaged in farming, agriculture remains the primary occupation, accounting for 11% of GDP in 2001. Value of agricultural output grew at an average annual rate of 7.1% during 1968–73, but since 1975 the sector has been hampered by droughts (1975, 1977, and 1979), hurricanes (in 1979 and 1980), and slumping world prices and quota allocations for sugar (since 1985). In 1999, agricultural production was 0.4% higher than during 1989–91. The fertile Cibao Valley is the main agricultural center. In 1998, arable land totaled 1,020,000 hectares (2,500,000 acres); with land under permanent crops at 480,000 hectares (1,200,000 acres).
After Cuba, the Dominican Republic is the second-largest Caribbean producer of sugarcane, the nation's most important crop. The State Sugar Council operates 12 sugar mills and accounts for about half of total production. Other large producers are the privately owned Vicini, with three mills, and Central Romana Corporation, whose mill is the largest in the country. Sugar is grown in the southeastern plains, around Barahona & on the North Coast Plain. In 1999, sugar production was 4.4 million tons, down from an average of 7.1 million tons during 1989–1991. Output of sugar has declined annually since 1982, and land is gradually being taken out of sugar production and switched to food crops. Production of raw sugar rose from 636,000 tons in 1990 to 813,000 tons in 1997 but fell to 374,000 tons in 1999.
Part of the crop was destroyed by hurricanes in 1979 and 1980, and 1979–80 production was only 670,000 bags (40,200 tons). Although production was usually about 57,000–59,000 tons annually in the 1980s, the acreage harvested declined from 157,000 hectares (390,000 acres) in the early 1980s to 139,000 hectares (340,000 acres) in 1999, indicating a greater yield per acre. Coffee production in 1999 was estimated at 35,000 tons; exports of coffee in 2001 generated $11 million. Cocoa and tobacco are also grown for export. Dominican Republic is one of the top 10 major producer and exporter of cocoa in the world. Cocoa is also grown in the Cibao Valley around San Francisco de Macoris. Tobacco is also grown in the Cibao Valley, but around Santiago. In 1999, production of cocoa beans was 26,000 tons and of tobacco, 35,000 tons. Rice is grown around Monte Cristi & San Francisco de Macoris. Banana production in 1999 was 432,000 tons. Production of other crops in 1999 (in thousands of tons) included rice, 563; coconuts, 184; cassava, 127; tomatoes, 281; pulses, 69; dry beans, 26; eggplants, 7; and peanuts, 2.
Animal husbandry
In 2001, Dominican livestock included 187,000 goats and 106,000 sheep. There were also about 2.1 million head of cattle, 60% for beef and 40% for dairy. The hog population was decimated by African swine fever, decreasing from 400,000 in 1978 to 20,000 in 1979; by 2001, however, it was 565,000. Poultry is the main meat source because it is cheaper than beef or pork. Poultry production relies on imports of feed grain from the United States. In 2001, 203,000 tons of poultry meat were produced, along with 71,000 tons of beef and 420,000 tons of milk.
Fishing
Although the waters surrounding the Dominican Republic abound with fish, the fishing industry is comparatively undeveloped, and fish for local consumption are imported. In 1837, the total marine catch was 5 ounces, down from 1 pound in 1798 . Marlin, barracuda, kingfish, mackerel, tuna, sailfish, and tarpon are found in the Monte Cristi Bank and Samaná Bay, which also supports bonito, snapper, and American grouper. The inland catch amounted to 187 tons in 2000.
Forestry
About 28.4% of the total land area consisted of forests and woodlands in 2000. Roundwood production in 2000 totaled 562,000 cu m (19.8 million cu ft). Virtually all the timber cut is for land clearing and fuel.
Mining
Mineral production has stagnated since a slump began in the mid-1980s. In 2000, mining accounted for 2% of GDP, which grew by 7.8%. Mining increased by 9.2%, stimulated by higher output and a higher average price of nickel, the country's most important mineral. Ferronickel was the country's leading export commodity and third-leading industry. Nickel is mined at Bonao. In 2000, nickel production was 39,943 tons, ranking tenth in the world, a decrease from 49,152 in 1997.
Production of gold and silver was suspended in 1999, including at what was, in 1980, the Western Hemisphere's largest gold mine, at Pueblo Viejo. Production was declining by the mid-1980s, so mining of the sulfide zone of the gold ore body was commenced, requiring more extensive processing facilities than had previously existed. Production of gold was 7,651 kg in 1987 and 3,659 in 1996, and of silver, 39,595 kg in 1988 and 17,017 kg in 1996. Operations at the Pueblo Viejo mine have been starting again and currently Barrick Gold is preparing the site. The use of a foreign company for the extraction of gold at the largest mine in the Western Hemisphere has startled and concerned many Dominicans who believe that this gold is Dominican gold and should be extracted by Dominican companies and not foreign. Some groups began to protest against the Barrick Gold in 2009 and 2010.
Production of bauxite, traditionally the principal mining product, ceased in 1992. The Aluminum Co. of America (Alcoa) mined bauxite between 1959 and 1983, when it turned its concession over to the state. Production in 1991 dropped 92% from the previous year, as a presidential decree suspended mining operations at the largest mine, in response to increasing fears of deforestation, although reforestation of mined areas was in progress. Output averaged 1 million tons each year.
The country was one of the few sources of amber in the Western Hemisphere. Salt Mountain, a 16 km block of almost solid salt west of Barahona, was the world's largest known salt deposit. There were also large deposits of gypsum near Salt Mountain, making the Dominican Republic one of three sources of gypsum in the Caribbean. The country also produced hydraulic cement, limestone, marble, and sand and gravel. Substantial lignite deposits were found in the early 1980s. Deposits of copper and platinum are known to exist.
Industry

The industrial sector contributed an estimated 32.2 percent to the country's GDP in 1999, led by mining (ferronickel, gold, and silver) and the manufacture of goods for export to the United States. To a lesser extent, there is the manufacture of food products, consumer non-durables, and building materials for the local market and for neighboring Haiti. The sector employed mated 24.3 percent of the workforce in 1998.
About 500 companies in the Dominican Republic manufacture goods primarily for the North American market. Situated in 50 industrial free zones around the country, these mostly foreign-owned corporations take advantage of generous tax and other financial inducements offered by the government to businesses that operate within the zones. Approximately 200,000 people, or about 8 percent of the workforce, are employed in this sector. They mostly produce clothing, electronic components, footwear, and leather goods, which are assembled. The raw materials or semi-manufactured goods are usually imported duty-free from other developing countries (electronic parts are imported from industrialized Puerto Rico) and put together in the free zones. Products created are cosmetics, pharmaceuticals, textiles, perfumes & foodstuffs. The value of exports amounted to US$1.9 billion in 1996, but the contribution to the trade balance was only US$520 million because many of the basic materials for the free zones had to be imported and paid for.
Other, more traditional manufacturing is based on sugar refining, cement, iron and steel production, and food processing. Rum is a significant export commodity, and beer and cigarettes are manufactured for local consumption. Most industry of this sort is located around the working-class perimeter of Santo Domingo and other large towns.
Tertiary industries
Services were estimated to contribute 64.7% (2012 est.) of the GDP.[21] In 1999 it was estimated to employ around 58.7 percent of the workforce, making this the most important sector of the Dominican economy.
Tourism
Since the mid-1980s the tourism sector has become one of the country’s most important sources of foreign exchange, and more popular tourist destinations. The country is famous for its favorable location in the Caribbean, tropical climate, beaches, and the restored Spanish colonial architecture. Many foreign investors have and continue to be encouraged to invest here to build and expand resorts and airports around the coasts.[22] During this same period, tourism displaced sugar as the main source of the country's earnings, and by 1997 it was generating more than half of the country's total foreign exchange.[23]
Tourism is the single biggest revenue earner, with receipts increasing more than tenfold from US$173 million in 1980 to more than US$2 billion by 2000. According to the Central Bank, the Dominican Republic received US$4.3 billion in revenues from the tourism sector in 2011.[24] Successive governments have invested heavily in tourism development, creating upgraded airports and other infrastructure. 2.1 million tourists arrived in the country in 1999, not including visiting Dominicans. Most come from Europe, with about 25 percent originating from the United States or Canada. The country now has almost 70,000 hotel rooms, more than any other Caribbean country. About 50,000 Dominicans are directly employed in this sector, mostly working in hotels, and another 110,000 are indirectly employed as taxi drivers, tour guides, or tourist-shop staff. Most tourists visit the Dominican Republic on account of its beaches, but there is an expanding eco-tourism and outdoor activity sector, focused on the country's mountains and wildlife.
Although tourism generates large revenues, some scholars and activists argue that the development of tourism also has high impacts on many socioeconomic aspects. For instance, they argue that it involves ecological deterioration, profit leakage, social displacement, disported cultural patterns, rising land values, drugs and prostitution.[23]
| Travel and tourism contribution to GDP [%] | 2001 | 2008 |
|---|---|---|
| Dominican Republic | 19.2% | 17.6% |
| Caribbean region | 18.2% | 19.5% |
Retail
Retail activity in the Dominican Republic takes many forms, from U.S.-style supermarkets and shopping malls in Santo Domingo to rural markets and tiny family-run corner stores in villages. A small but affluent middle class can afford to shop at the former, while the large impoverished rural community resorts to buying small amounts of daily essentials from colmados (small stores that often double as bars). In an attempt to regulate the retail sector, the government has recently reformed taxation laws, so that small shops pay taxes on a regular monthly basis. Many transactions, however, go unrecorded.
Data
The following table shows the main economic indicators in 1980–2017. Inflation below 5% is in green.[26]
| Year | GDP (in bil. US$ PPP) |
GDP per capita (in US$ PPP) |
GDP growth (real) |
Inflation rate (in Percent) |
Unemployment (in Percent) |
Government debt (in % of GDP) |
|---|---|---|---|---|---|---|
| 1980 | 13.4 | 2,373 | n/a | n/a | ||
| 1981 | n/a | n/a | ||||
| 1982 | n/a | n/a | ||||
| 1983 | n/a | n/a | ||||
| 1984 | n/a | n/a | ||||
| 1985 | n/a | n/a | ||||
| 1986 | n/a | n/a | ||||
| 1987 | n/a | n/a | ||||
| 1988 | n/a | n/a | ||||
| 1989 | n/a | n/a | ||||
| 1990 | n/a | n/a | ||||
| 1991 | 9.2 % | n/a | ||||
| 1992 | n/a | |||||
| 1993 | n/a | |||||
| 1994 | n/a | |||||
| 1995 | n/a | |||||
| 1996 | n/a | |||||
| 1997 | 13.8 % | |||||
| 1998 | ||||||
| 1999 | ||||||
| 2000 | ||||||
| 2001 | ||||||
| 2002 | ||||||
| 2003 | ||||||
| 2004 | ||||||
| 2005 | ||||||
| 2006 | ||||||
| 2007 | ||||||
| 2008 | ||||||
| 2009 | ||||||
| 2010 | ||||||
| 2011 | ||||||
| 2012 | ||||||
| 2013 | ||||||
| 2014 | ||||||
| 2015 | ||||||
| 2016 | ||||||
| 2017 |
Other statistics
GDP: purchasing power parity - $172.4 billion (2017 est.)
GDP - real growth rate: 4.6% (2017 est.)
GDP - per capita: purchasing power parity - $16.900 (2017 est.)
GDP - composition by sector: agriculture: 5.5% industry: 33.8% services: 60.8% (2017 est.)
Inflation rate (consumer prices): 3.3% (2017 est.)
Labor force: 4.732 million (2017 est.)
Labor force - by occupation: agriculture: 14.4% industry: 20.8% services: 64.7% (2014 est.)
Unemployment rate: 5.5% (2017 est.)
Population below poverty line: 30.5% (2016)
Budget: revenues: $7.014 billion
expenditures: $6.985 billion (2007 est.)
Industries: tourism, sugar processing, ferronickel and gold mining, textiles, cement, tobacco, electrical components, medical devices
Electricity - production: 15.53 billion kWh (2015)
Electricity - consumption: 13.25 billion kWh (2015)
Electricity - exports: 0 kWh (2005)
Electricity - imports: 0 kWh (2005)
Oil - production: 0 bbl/d (0 m3/d) (2014)
Oil - consumption: 122,300 bbl/d (19,440 m3/d) (2012 est.)
Oil - exports: 0 bbl/d (0 m3/d) (2017)
Oil - imports: 116,700 bbl/d (18,550 m3/d) (2017)
Oil - proved reserves: 0 bbl (0 m3) (1 January 2006 est.)
Natural gas - production: 0 cu m (2005 est.)
Natural gas - consumption: 1.108 million cu m (2015 est).
Natural gas - exports: 0 cu m (2005 est.)
Natural gas - imports: 1.108 million cu m (2015)
Natural gas - proved reserves: 0 cu m (1 January 2006 est.)
Agriculture - products: sugarcane, coffee, cotton, cocoa, tobacco, rice, beans, potatoes, corn, bananas; cattle, pigs, dairy products, beef, eggs
Exports: $10.33 billion f.o.b. (2017 est.)
Exports - commodities: ferro nickel, sugar, gold, silver, coffee, cocoa, tobacco, meats, consumer goods
Exports - partners: United States 50.4%, United Kingdom 3.2%, Belgium 2.4% (2017)
Imports: $19 billion f.o.b. (2017 est.)
Imports - commodities: foodstuffs, petroleum, cotton and fabrics, chemicals and pharmaceuticals
Imports - partners: United States 41.4%, China 13.9%, Mexico 4.5%, Brazil 4.3% (2017)
Debt - external: $29.69 billion (31 December 2017 est.)
Economic aid - recipient: $76.99 million (2005)
Currency: Dominican peso
Exchange rates: Dominican pesos per US dollar - 33.113 (2007), 33.406 (2006), 30.409 (2005), 42.12 (2004), 30.831 (2003)
Fiscal year: calendar year
See also
Notes
- "World Economic Outlook Database, April 2019". IMF.org. International Monetary Fund. Retrieved 29 September 2019.
- "World Bank Country and Lending Groups". datahelpdesk.worldbank.org. World Bank. Retrieved 29 September 2019.
- "World Economic Outlook Database, October 2019". IMF.org. International Monetary Fund. Retrieved 21 October 2019.
- "Global Economic Prospects, June 2020". openknowledge.worldbank.org. World Bank. p. 86. Retrieved 16 June 2020.
- "Poverty headcount ratio at national poverty lines (% of population)". Retrieved 11 June 2015.
- "Poverty headcount ratio at national poverty line (% of population)". The World Bank. Retrieved 18 September 2014.
- "GINI index (World Bank estimate) - Dominican Republic". data.worldbank.org. World Bank. Retrieved 30 March 2020.
- "Human Development Index (HDI)". hdr.undp.org. HDRO (Human Development Report Office) United Nations Development Programme. Retrieved 11 December 2019.
- "Inequality-adjusted Human Development Index (IHDI)". hdr.undp.org. HDRO (Human Development Report Office) United Nations Development Programme. Retrieved 11 December 2019.
- "Ease of Doing Business in Dominican Republic". Doingbusiness.org. Retrieved 27 January 2017.
- "Export Partners of Dominican Republic". CIA World Factbook. 2017. Retrieved 26 July 2018.
- "Import Partners of Dominican Republic". CIA World Factbook. 2017. Retrieved 26 July 2018.
- "Sovereigns rating list". Standard & Poor's. Retrieved 26 May 2011.
- "Country and Lending Groups". Archived from the original on 24 May 2008. Retrieved 11 June 2015.
- "The World's 10 Largest Gold Mines by Production".
- "World Top 20 Gold: Countries, Companies and Mines".
- Meyers, Deborah Waller. Migrant Remittances to Latin America; Reviewing the Literature, Washington DC; Inter-American Dialogue 1998
- "OEC: Dominican Republic (DOM) Profile of Exports, Imports and Trade Partners". Observatory of Economic Complexity. Archived from the original on 17 September 2017. Retrieved 17 September 2017.
- "Dominican Republic". U.S. Department of State. Retrieved 11 June 2015.
- "World Atlas - About Dominican Republic". Retrieved 11 June 2015.
- "Economy of the Dominican Republic". Theodora. Retrieved 7 December 2014.
- Gonzalez, Nancie. "Tourism Dominican Republic". Encyclopædia Britannica. Encyclopædia Britannica. Retrieved 7 December 2014.
- Cabezas, Amalia (May 2008). "Tropical Blues: Tourism and Social Exclusion in the Dominican Republic". Latin American Perspectives. 35 (3): 21–36.
- "Tourism Investment Guide" (PDF). Ministry of Tourism Dominican Republic. Ministry of Tourism Dominican Republic. Archived from the original (PDF) on 26 February 2014. Retrieved 5 December 2014.
- Lionetti, Stefania; Gonzalez, Oscar (January 2012). "On the relationship between tourism and growth in Latin America". Tourism and Hospitality Research. 1 (15–24). Retrieved October 2014. Check date values in:
|accessdate=(help) - "Report for Selected Countries and Subjects". www.imf.org. Retrieved 16 December 2018.
Dominican Republic articles | |||||
|---|---|---|---|---|---|
| History |
|  | |||
| Geography |
| ||||
| Politics |
| ||||
| Economy | |||||
| Society |
| ||||
| |||||
Economy of the Americas | ||
|---|---|---|
| ||
| Sovereign states |
| .svg.png) |
| ||