Economy of Switzerland
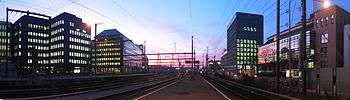
The economy of [[Switzerland]] is one of the world's most advanced free market economies. The service sector has come to play a significant economic role, particularly the Swiss banking industry and tourism. The economy of Switzerland ranks first in the world in the 2015 Global Innovation Index[22] and third in the 2020 Global Competitiveness Report.[23][24] According to United Nations data for 2016, Switzerland is the third richest landlocked country in the world after Liechtenstein and Luxembourg, and together with the latter and Norway the only three countries in the world with a GDP per capita above US$70,000 that are neither island nations nor ministates.[25]
.jpg) The city of Zurich, the most important economic center of the country | |
| Currency | Swiss franc (CHF) |
|---|---|
| Calendar year | |
Trade organisations | EFTA, WTO and OECD |
Country group | |
| Statistics | |
| Population | |
| GDP | |
| GDP rank | |
GDP growth |
|
GDP per capita | |
GDP per capita rank | |
GDP by sector |
|
Population below poverty line | |
Labour force | |
Labour force by occupation |
|
| Unemployment | |
Average gross salary | $62,283, annual (2017)[16] |
Main industries | |
| External | |
| Exports | |
Export goods | machinery, chemicals, metals, watches, agricultural products |
Main export partners |
|
| Imports | |
Import goods | machinery, chemicals, vehicles, metals, agricultural products, textiles |
Main import partners |
|
FDI stock | |
Gross external debt | |
| Public finances | |
| 1.1% (of GDP) (2017 est.)[6] | |
| Revenues | 242.1 billion (2017 est.)[6] |
| Expenses | 234.4 billion (2017 est.)[6] [note 3] |
| Economic aid | Donor: ODA 2.31 billion CHF (0.47% of GDP)[18] |
Foreign reserves | |
History
19th century
Switzerland as a federal state was established in 1848. Before that time, the city-cantons of Zurich and Basel in particular began to develop economically based on industry and trade, while the rural regions of Switzerland remained poor and underdeveloped. While a workshop system had been in existence throughout the early modern period, the production of machines began in 1801 in St. Gallen, with the third generation of machines imported from Great Britain. But in Switzerland, hydraulic power was often used instead of steam engines because of the country's mountainous topography and lack of significant deposits of coal. By 1814, hand weaving had been mostly replaced by the power loom. Both tourism and banking began to develop as economic factors at about the same time. While Switzerland was primarily rural, the cities experienced an industrial revolution in the late 19th century, focused especially on textiles. In Basel, for example, textiles, including silk, were the leading industry. In 1888, women made up 44% of wage earners. Nearly half the women worked in the textile mills, with household servants the second largest job category. The proportion of women in the workforce was higher between 1890 and 1910 than it was in the late 1960s and 1970s.[26]
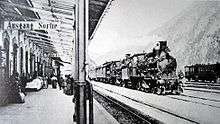
Railways played a major part in industrialization; the first railway opened in 1847, between Zurich and Baden. Due to competition between private players, Switzerland was covered with more than 1000 km of track by 1860.[27]
20th century
The industrial sector began to grow in the 19th century with a laissez-faire industrial/trade policy, Switzerland's emergence as one of the most prosperous nations in Europe, sometimes termed the "Swiss miracle", was a development of the mid 19th to early 20th centuries, among other things tied to the role of Switzerland during the World Wars.[28]
Switzerland's total energy consumption, which was dropping from the mid 1910s to the early 1920s, started to increase again in the early 1920s. It stagnated during the 1930s before falling again during the early 1940s; but rapid growth started once again in the mid 1940s.[29]
In the 1940s, particularly during World War II, the economy profited from the increased export and delivery of weapons to Germany, France, the United Kingdom, and other European countries. However, Switzerland's energy consumption decreased rapidly. The co-operation of the banks with the Nazis (although they also co-operated extensively with the British and French) and their commercial relations with the Axis powers during the war were later sharply criticised, resulting in a short period of international isolation of Switzerland. Switzerland's production facilities were largely undamaged by the war, and afterwards both imports and exports grew rapidly.[30]
In the 1950s, annual GDP growth averaged 5% and Switzerland's energy consumption nearly doubled. Coal lost its rank as Switzerland's primary energy source, as other imported fossil fuels, such as crude and refined oil and natural and refined gas, increased.[31]
In the 1960s, annual GDP growth averaged 4% and Switzerland's total energy consumption nearly doubled again. By the end of the decade oil provided over three-quarters of Switzerland's energy.[31]
In the 1970s the GDP growth rate gradually declined from a peak of 6.5% in 1970; GDP then contracted by 7.5% in 1975 and 1976. Switzerland became increasingly dependent on oil imported from its main suppliers, the OPEC cartel. The 1973 international oil crisis caused Switzerland's energy consumption to decrease in the years from 1973 to 1978.[31] In 1974 there were three nationwide car-free Sundays when private transport was prohibited as a result of the oil supply shock. From 1977 onwards GDP grew again, although Switzerland was also affected by the 1979 energy crisis which resulted in a short-term decrease in Switzerland's energy consumption. In 1970 industry still employed about 46% of the labor force, but during the economic recession of the 1970s the services sector grew to dominate the national economy. By 1970 17.2% of the population and about one quarter of the work force were foreign nationals, though job losses during the economic recession decreased this number.[30]
In the 1980s, Switzerland's economy contracted by 1.3% in 1982 but grew substantially for the rest of the decade, with annual GDP growth between about 3% and 4%, apart from 1986 and 1987 when growth decreased to 1.9% and 1.6% respectively.[32]
Switzerland's economy was marred by slow growth in the 1990s, having the weakest economic growth in Western Europe. The economy was affected by a three-year recession from 1991 to 1993, when the economy contracted by 2%. The contraction also became apparent in Switzerland's energy consumption and export growth rates. Switzerland's economy averaged no appreciable increase (only 0.6% annually) in GDP.
After enjoying unemployment rates lower than 1% before 1990, the three-year recession also caused the unemployment rate to rise to its all-time peak of 5.3% in 1997. In 2008, Switzerland was in second place among European countries with populations above one million in terms of nominal and purchasing power parity GDP per capita, behind Norway (see list). Several times in the 1990s, real wages decreased since nominal wages could not keep up with inflation. However, beginning in 1997, a global resurgence in currency movement provided the necessary stimulus to the Swiss economy. It slowly gained momentum, and peaked in the year 2000 with 3.7% growth in real terms.[33]
2000s
In the early 2000s recession, being so closely linked to the economies of Western Europe and the United States, Switzerland could not escape the slowdown in these countries. After the worldwide stock market crashes in the wake of the 9/11 terrorism attacks, there were more announcements of false enterprise statistics and exaggerated managers' wages. The rate of GDP growth dropped to 1.2% in 2001; 0.4% in 2002; and minus 0.2% in 2003. This economic slowdown had a noticeable impact on the labour market.
Many companies announced mass dismissals and thus the unemployment rate rose from its low of 1.6% in September 2000 to a peak of 4.3% in January 2004,[35] although well below the European Union (EU) rate of 9.2% at the end of 2004.[36]
On 10 November 2002 the economics magazine Cash suggested five measures for political and economic institutions to implement to revive the Swiss economy:
1. Private consumption should be promoted with decent wage increases. In addition to that, families with children should get discounts on their health insurance.
2. Switzerland's national bank should revive investments by lowering interest rates. Besides that, monetary institutions should increasingly credit consumers and offer cheaper land to be built on.
3. Switzerland's national bank was asked to devalue the Swiss Franc, especially compared to the Euro.
4. The government should implement the anti-cyclical measure of increasing budget deficits. Government spending should increase in the infrastructure and education sectors. Lowering taxes would make sense in order to promote private household consumption.
5. Flexible work schedules should be instituted, thus avoiding low demand dismissals.
These measures were applied with successful results while the government strove for the Magical Hexagon of full employment, social equality, economic growth, environmental quality, positive trade balance and price stability. The rebound which started in mid-2003 saw growth rate growth rate averaging 3% (2004 and 2005 saw a GDP growth of 2.5% and 2.6% respectively; for 2006 and 2007, the rate was 3.6%). In 2008, GDP growth was modest in the first half of the year while declining in the last two quarters. Because of the base effect, real growth came to 1.9%. While it contracted 1.9% in 2009, the economy started to pick up in Q3 and by the second quarter of 2010, it had surpassed its previous peak. Growth for 2010 was 2.6%[37]
The stock market collapse of 2007-2009 deeply affected investment income earned abroad. This translated to a substantial fall in the surplus of the current account balance. In 2006, Switzerland recorded a 15.1% per GDP surplus. It went down to 9.1% in 2007 and further dropped to 1.8% in 2008. It recovered in 2009 and 2010 with a surplus of 11.9% and 14.6% respectively.[38] Unemployment peaked in December 2009 at 4.4%. In August 2018 the unemployment rate was 2.4%.[35]
The chart below shows the trend of the gross domestic product of Switzerland at market prices:[39]
| Year | GDP (billions of CHF) | US Dollar Exchange |
|---|---|---|
| 1980 | 184 | 1.67 Francs |
| 1985 | 244 | 2.43 Francs |
| 1990 | 331 | 1.38 Francs |
| 1995 | 374 | 1.18 Francs |
| 2000 | 422 | 1.68 Francs |
| 2005 | 464 | 1.24 Francs |
| 2006 | 491 | 1.25 Francs |
| 2007 | 521 | 1.20 Francs |
| 2008 | 547 | 1.08 Francs |
| 2009 | 535 | 1.09 Francs |
| 2010 | 546 | 1.04 Francs |
| 2011 | 659 | 0.89 Francs |
| 2012 | 632 | 0.94 Francs |
| 2013 | 635 | 0.93 Francs |
| 2014 | 644 | 0.92 Francs |
| 2015 | 646 | 0.96 Francs |
| 2016 | 659 | 0.98 Francs |
| 2017 | 668 | 1.01 Francs |
| 2018 | 694 | 1.00 Francs |
Data
The following table shows the main economic indicators in 1980–2018. Inflation under 2% is in green.[40][41]
| Year | GDP (in bln. CHF) |
GDP per capita (in CHF) |
GDP growth (real) |
Inflation rate (in Percent) |
Unemployment (in Percent) |
Government debt (in % of GDP) |
|---|---|---|---|---|---|---|
| 1980 | 199.3 | 31,620 | 0.2 % | k. A. | ||
| 1981 | k. A. | |||||
| 1982 | k. A. | |||||
| 1983 | k. A. | |||||
| 1984 | k. A. | |||||
| 1985 | k. A. | |||||
| 1986 | k. A. | |||||
| 1987 | k. A. | |||||
| 1988 | k. A. | |||||
| 1989 | k. A. | |||||
| 1990 | 34.4 % | |||||
| 1991 | ||||||
| 1992 | ||||||
| 1993 | ||||||
| 1994 | ||||||
| 1995 | ||||||
| 1996 | ||||||
| 1997 | ||||||
| 1998 | ||||||
| 1999 | ||||||
| 2000 | ||||||
| 2001 | ||||||
| 2002 | ||||||
| 2003 | ||||||
| 2004 | ||||||
| 2005 | ||||||
| 2006 | ||||||
| 2007 | ||||||
| 2008 | ||||||
| 2009 | ||||||
| 2010 | ||||||
| 2011 | ||||||
| 2012 | ||||||
| 2013 | ||||||
| 2014 | ||||||
| 2015 | ||||||
| 2016 | ||||||
| 2017 | ||||||
| 2018 |
Economic sectors
The Swiss economy follows the typical developed country model with respect to the economic sectors. Only a small minority of the workers are involved in the primary or agricultural sector (1.3% of the population, in 2006) while a larger minority is involved in the secondary or manufacturing sector (27.7% in 2012). The majority of the working population are involved in the tertiary or services sector of the economy (71.0% in 2012).[42]
While most of the Swiss economic practices have been brought largely into conformity with the European Union's policies, some trade protectionism remains, particularly for the small agricultural sector.[43]
Watches
Switzerland is a leading exporter of high-end watches and clocks. Swiss companies produce most of the world's high-end watches: in 2011 exports reached nearly 19.3 billion CHF, up 19.2% over the previous year. The watches go to Asia (55%), Europe (29%), Americas (14%), Africa and Oceania (both 1%).[44]
In 2011, Switzerland led the world by exporting over 20 billion USD value of all types of watches, followed by Hong Kong, at under USD$10 billion. China exported the highest number of watches by far in 2011.[44]
Industrial sector
Switzerland has one of the most competitive pharmaceutical industries in the world. Major Swiss pharmaceutical companies include Novartis and Roche.
Switzerland also has an extensive industrial sector, with globally competitive companies in various industrial sectors. Most noticeably, food processing like Nestlé, chemicals for industrial and construction use like Sika AG, and roof coating chemicals Sarnafil. LafargeHolcim is the largest construction materials group in the world.
Agriculture
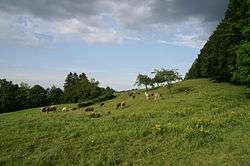
Switzerland is extremely protective of its agricultural industry. High tariffs and extensive domestic subsidisations encourage domestic production, which currently produces about 60% of the food consumed in the country.
According to the Organisation for Economic Co-operation and Development (OECD), Switzerland is subsidising more than 70% of its agriculture compared to 35% in the EU. The 2007 Agricultural Program increased subsidies by CHF 63 million to CHF 14.092 billion.
Protectionism acts to promote domestic production, but not to reduce prices or the cost of production, and there is no guarantee the increased domestic production is actually consumed internally; it may simply be exported, to the profit of the producers. 90 to 100% of potatoes, vegetables, pork, veal, cattle and most milk products are produced in the country. Beyond that, Swiss agriculture meets 65% of the domestic food demand.[45] In 2016 the Swiss government spent about 5.5% of its total budget (over CHF 3.5 billion) on supporting food production.[46]
The first reform in agricultural policies was in 1993. Among other changes, since 1998 Switzerland has linked the attribution of farm subsidies with the strict observance of good environmental practice. Before farmers can apply for subsidies, they must obtain certificates of environmental management systems (EMS) proving that they: "make a balanced use of fertilizers; use at least 7% of their farmland as ecological compensation areas; regularly rotate crops; adopt appropriate measures to protect animals and soil; make limited and targeted use of pesticides."[47] 1,500 farms are driven out of business each year. But the number of organic farms increased by 3.3 percent between 2003 and 2004, and organic sales increased by 7 percent to $979 million.[48] Moreover, Swiss consumers consider less important the drawback of higher prices for organic food compared to conventional locally produced food.[45]
Trade
The CIA World Factbook estimates Switzerland's 2011 exports at $308.3 billion and the 2010 exports at $258.5 billion. Imports are estimated to be $299.6 billion in 2011 and $246.2 billion in 2010. According to the World Factbook numbers, Switzerland is the 20th largest exporter and the 18th largest importer.[43]
The United Nations Commodity Trade Statistics Database has lower numbers for Switzerland's exports and imports. The UN calculates exports at $223.5 billion in 2011 and $185.8 billion in 2010. The value of all imports in 2011 was $197.0 billion and in 2010 it was $166.9 billion.[49]
Switzerland's largest trading partner is Germany. In 2017, 17% of Switzerland's exports and 20% of its imports came from Germany. The United States was the second largest destination of exports (10% of total exports) and the second largest source of imports (7.8%). China was the third largest destination of exports (9.2%) but only provided 4.8% of imports.[50]
The next largest destinations of exports include India (7.3%), France (5.4%), Hong Kong (5.4%), the United Kingdom (4.5%) and Italy (4.4%). Other major sources of imports include: Italy (7.6%), the United Kingdom (7.1%), France (6.0%), China (mentioned above), the United Arab Emirates (3.7%) and Hong Kong (3.4%).[50]
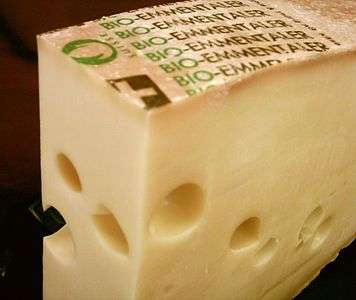
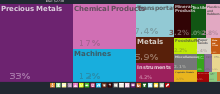
As a developed country with a skilled labor force, the majority of Swiss exports are precision or 'high tech' finished products. Switzerland's largest specific SITC categories of exports include medicaments (13%), heterocyclic compounds (2.2%), watches (6.4%), orthopaedic appliances (2.1%), and precious jewellery (2.5%). While watches and jewellery remained an important part of the economy, in 2017 about 24% of Swiss exports were gold bullion or coins. Agricultural products that Switzerland is famous for such as cheese (0.23%), wine (0.028%), and chocolate (0.35%) all make up only a small portion of Swiss exports.[50] Switzerland is also a significant exporter of arms and ammunition, and the third largest for small calibers[51] which accounted for 0.33% of the total exports in 2012.[52]
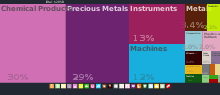
Switzerland's main imports include gold (21%), medicaments (7.4%), cars (4.0%), precious jewellery (3.7%), and other unclassified transactions (18%). While Switzerland has a long tradition of manufacturing cars,[53] there are currently no large-scale assembly line automobile manufacturers in the country.
| Top 25 imports and exports for Switzerland for 2017[50] | |||||||||||||||||||||||||||||||||||||||||||||||||||||||||||||||||||||||||||||||||||||||||||||||||||||||||||||||||||||||||||||||||||||||||||||||||||||||||||||||||||||||||||||||||||||||||||||||||||||||||||||||||||||||||||||||||||||||||||||||||||||||||||||||||||||||||||||||
|---|---|---|---|---|---|---|---|---|---|---|---|---|---|---|---|---|---|---|---|---|---|---|---|---|---|---|---|---|---|---|---|---|---|---|---|---|---|---|---|---|---|---|---|---|---|---|---|---|---|---|---|---|---|---|---|---|---|---|---|---|---|---|---|---|---|---|---|---|---|---|---|---|---|---|---|---|---|---|---|---|---|---|---|---|---|---|---|---|---|---|---|---|---|---|---|---|---|---|---|---|---|---|---|---|---|---|---|---|---|---|---|---|---|---|---|---|---|---|---|---|---|---|---|---|---|---|---|---|---|---|---|---|---|---|---|---|---|---|---|---|---|---|---|---|---|---|---|---|---|---|---|---|---|---|---|---|---|---|---|---|---|---|---|---|---|---|---|---|---|---|---|---|---|---|---|---|---|---|---|---|---|---|---|---|---|---|---|---|---|---|---|---|---|---|---|---|---|---|---|---|---|---|---|---|---|---|---|---|---|---|---|---|---|---|---|---|---|---|---|---|---|---|---|---|---|---|---|---|---|---|---|---|---|---|---|---|---|---|---|---|---|---|---|---|---|---|---|---|---|---|---|---|---|---|---|---|---|---|---|---|---|---|---|---|---|---|---|---|---|---|---|
|
| ||||||||||||||||||||||||||||||||||||||||||||||||||||||||||||||||||||||||||||||||||||||||||||||||||||||||||||||||||||||||||||||||||||||||||||||||||||||||||||||||||||||||||||||||||||||||||||||||||||||||||||||||||||||||||||||||||||||||||||||||||||||||||||||||||||||||||||||
| Top 25 trading partners for Switzerland for 2017[50] | |||||||||||||||||||||||||||||||||||||||||||||||||||||||||||||||||||||||||||||||||||||||||||||||||||||||||||||||||||||||||||||||||||||||||||||||||||||||||||||||||||||||||||||||||||||||||||||||||||||||||||||||||||||||||||
|---|---|---|---|---|---|---|---|---|---|---|---|---|---|---|---|---|---|---|---|---|---|---|---|---|---|---|---|---|---|---|---|---|---|---|---|---|---|---|---|---|---|---|---|---|---|---|---|---|---|---|---|---|---|---|---|---|---|---|---|---|---|---|---|---|---|---|---|---|---|---|---|---|---|---|---|---|---|---|---|---|---|---|---|---|---|---|---|---|---|---|---|---|---|---|---|---|---|---|---|---|---|---|---|---|---|---|---|---|---|---|---|---|---|---|---|---|---|---|---|---|---|---|---|---|---|---|---|---|---|---|---|---|---|---|---|---|---|---|---|---|---|---|---|---|---|---|---|---|---|---|---|---|---|---|---|---|---|---|---|---|---|---|---|---|---|---|---|---|---|---|---|---|---|---|---|---|---|---|---|---|---|---|---|---|---|---|---|---|---|---|---|---|---|---|---|---|---|---|---|---|---|---|---|---|---|---|---|---|---|---|---|---|---|---|---|---|---|---|---|
|
| ||||||||||||||||||||||||||||||||||||||||||||||||||||||||||||||||||||||||||||||||||||||||||||||||||||||||||||||||||||||||||||||||||||||||||||||||||||||||||||||||||||||||||||||||||||||||||||||||||||||||||||||||||||||||||
Tourism
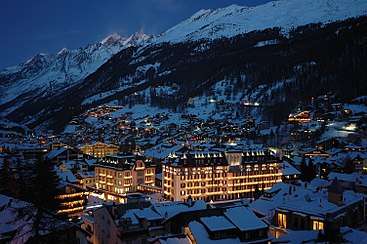
Switzerland has highly developed tourism infrastructure, especially in the mountainous regions and cities, making it a good market for tourism-related equipment and services.
14% of hotels were in Grisons, 12% each in the Valais and Eastern Switzerland, 11% in Central Switzerland and 9% in the Bernese Oberland. The ratio of lodging nights in relation to resident population ("tourism intensity", a measure for the relative importance of tourism to local economy) was largest in Grisons (8.3) and Bernese Oberland (5.3), compared to a Swiss average of 1.3. 56.4% of lodging nights were by visitors from abroad (broken down by nationality: 16.5% Germany, 6.3% UK, 4.8% USA, 3.6% France, 3.0% Italy) [54]
The total financial volume associated with tourism, including transportation, is estimated to CHF 35.5 billion (as of 2010) although some of this comes from fuel tax and sales of motorway vignettes. The total gross value added from tourism is 14.9 billion. Tourism provides a total of 144,838 full time equivalent jobs in the entire country. The total financial volume of tourist lodging is 5.19 billion CHF and eating at the lodging provides an additional 5.19 billion. The total gross value added of 14.9 billion is about 2.9% of Switzerland's 2010 nominal GDP of 550.57 billion CHF.[55][56]
Banking and finance
In 2003, the financial sector[57] comprised an estimated 11.6% of Switzerland's GDP and employed approximately 196,000 people (136,000 of whom work in the banking sector); this represents about 5.6% of the total Swiss workforce.[58]
Swiss neutrality and national sovereignty, long recognized by foreign nations, have fostered a stable environment in which the banking sector was able to develop and thrive. Switzerland has maintained neutrality through both World Wars, is not a member of the European Union, and was not even a member of the United Nations until 2002.[59][60] Currently an estimated 28 percent of all funds held outside the country of origin (sometimes called "offshore" funds) are kept in Switzerland.[61] In 2009 Swiss banks managed 5.4 trillion Swiss Francs.[62]
The Bank of International Settlements, an organization that facilitates cooperation among the world's central banks, is headquartered in the city of Basel. Founded in 1930, the BIS chose to locate in Switzerland because of the country's neutrality, which was important to an organization founded by countries that had been on both sides of World War I.[63] In May 2006, foreign banks operating in Switzerland managed 870 billion Swiss francs worth of assets.[64] In 2014, this number was estimated to be 960 billion Swiss francs.[65]
Connection to illegal activities
Swiss banks have served as safe havens for the wealth of dictators, despots, mobsters, arms dealers, corrupt officials, and tax cheats.[66][67][68]
Workforce
The Swiss economy is characterised by a skilled and generally 'peaceful' workforce. One quarter of the country's full-time workers are unionised. Labour and management relations are amicable, characterised by a willingness to settle disputes instead of resorting to labour action. They take place between trade unions and branch associations, that are themselves often grouped in Union of Employers, like the Fédération patronale vaudoise or the Fédération des Entreprises Romandes Genève. About 600 collective bargaining agreements exist today in Switzerland and are regularly renewed without major problems. However, there is no country-wide minimum wage across sectors, but some collective bargaining agreement may contain minimum wage requirements for specific sectors or employers. A May 2014 ballot initiative which would have required a Swiss minimum wage to 22 Swiss francs an hour (corresponding to a monthly income of about 4000 Swiss francs) failed to pass, gaining only 23.7% support on the ballot.[69]
With the peak of the number of bankruptcies in 2003, however, the mood was pessimistic. Massive layoffs and dismissals by enterprises resulting from the global economic slowdown, major management scandals and different foreign investment attitudes have strained the traditional Swiss labour peace. Swiss trade unions have encouraged strikes against several companies, including Swiss International Air Lines, Coca-Cola, and Orange. Total days lost to strikes, however, remain among the lowest in the OECD.
Income and wealth distribution
In 2013 the mean household income in Switzerland was CHF 120,624 (c. USD 134,000 nominal, USD 101,000 PPP), the mean household income after social security, taxes and mandatory health insurance was CHF 85,560 (c. USD 95,000 nominal, USD 72,000 PPP).[70] The OECD lists Swiss household gross adjusted disposable income per capita USD 32,594 PPP for 2011.[71]
As of 2016, Switzerland had the highest average wealth per adult, at $561,900.[72]
This development was tied to the exchange rate between the US Dollar and the Swiss franc, which caused capital in Swiss francs to more than double its value in dollar terms during the 2000s and especially in the wake of the financial crisis of 2007–2008, without any direct increase in value in terms of domestic purchasing power.[73]
The high average wealth is determined by the few who are extremely wealthy; the median (50th percentile) wealth of a Swiss adult is five times lower than the average, at USD 100,900 (USD 70,000 PPP as of 2011).[74]
The Statistical Office defines the majority of the population as neither rich nor poor and the average Swiss earns just enough to afford the high cost of living in Switzerland.[75]
Economic policy
Terrorism
Through the United States-Swiss Joint Economic Commission (JEC), Switzerland has passed strict legislation covering anti-terrorism financing and the prevention of terrorist acts, marked by the implementation of several anti-money laundering procedures and the seizure of al-Qaeda accounts.
European Union
Apart from agriculture, there are minimal economic and trade barriers between the European Union and Switzerland. In the wake of the Swiss voters' rejection of the European Economic Area Agreement in 1992, the Swiss Government set its sights on negotiating bilateral economic agreements with the EU. Four years of negotiations culminated in Bilaterals, a cross-platform agreement covering seven sectors: research, public procurement, technical barriers to trade, agriculture, civil aviation, land transport, and the free movement of persons. Parliament officially endorsed the Bilaterals in 1999 and it was approved by general referendum in May 2000. The agreements, which were then ratified by the European Parliament and the legislatures of its member states, entered into force on June 1, 2002. The Swiss government has since embarked on a second round of negotiations, called the Bilaterals II, which will further strengthen the country's economic ties with the organisation.
Switzerland has since brought most of their practices into conformity with European Union policies and norms in order to maximise the country's international competitiveness. While most of the EU policies are not contentious, police and judicial cooperation to international law enforcement and the taxation of savings are controversial, mainly because of possible side effects on bank secrecy.
Swiss and EU finance ministers agreed in June 2003 that Swiss banks would levy a withholding tax on EU citizens' savings income. The tax would increase gradually to 35% by 2011, with 75% of the funds being transferred to the EU. Recent estimates value EU capital inflows to Switzerland to $8.3 billion.
Institutional membership
Switzerland is a member of a number of international economic organizations, including the United Nations, the World Trade Organization, the International Monetary Fund, the World Bank, and the Organisation for Economic Co-operation and Development.
International comparison
| Countries | Agricultural sector % | Manufacturing sector % | Services sector % | Unemployment rate % | Unemployment rate (females) % | Unemployment rate (males) % | Average hours worked per week |
|---|---|---|---|---|---|---|---|
| Switzerland (2006)[42] | 3.8 | 23 | 73.2 | 4.0 | 4.7 | 3.4 | 41.6 |
| European Union-25 countries (2006)[76] | 4.7 | 27.4 | 67.9 | 8.2 | 9 | 7.6 | 40.5 |
| Germany (2014)[77] | 2.1 | 24.4 | 73.5 | 5.2 | 4.9 | 5.5 | 41.2 |
| France (2006)[78] | 3.9 | 24.3 | 71.8 | 8.8 | 9.5 | 8.1 | 39.1 |
| Italy (2006)[79] | 4.2 | 29.8 | 66 | 6.6 | 8.5 | 5.2 | 39.3 |
| United Kingdom (2006)[80] | 1.3 | 22 | 76.7 | 5.3 | 4.8 | 5.7 | 42.4 |
| United States (2005)[81] | 1.6 | 20.6 | 77.8 | 5.1[82] | 5.6[83] | 5.9[83] | 41[84] |
Regional disparities
| Cantons | Tax index for all Federal, Cantonal and Church Taxes (Switzerland = 100.0) 2006 | Median Church, Local and Cantonal Tax Rate (2011) by Family Status and Pre-Tax Income[85] | Population under 20 as a percentage of total population aged 20–64 2007 | National Income per person in CHF 2005 | Change in National Income per person 2003-2005 | |||
|---|---|---|---|---|---|---|---|---|
| Unmarried | Married with 2 children | |||||||
| 80,000 CHF | 150,000 CHF | 80,000 CHF | 150,000 CHF | |||||
| 100 | 14.43 | 21.12 | 4.9 | 12.29 | 34.59 | 54,031 | 5.3 | |
| 82.9 | 11.01 | 17.31 | 4.50 | 10.52 | 31.12 | 68,803 | 4.6 | |
| 123.1 | 14.75 | 21.96 | 6.79 | 14.23 | 33.05 | 45,643 | 5 | |
| 119 | 13.49 | 18.04 | 5.07 | 11.18 | 37.19 | 43,910 | 5.3 | |
| 144.2 | 11.95 | 15.76 | 5.91 | 10.84 | 37.06 | 45,711 | 5.3 | |
| 66.5 | 8.53 | 13.04 | 3.33 | 7.77 | 36.95 | 50,170 | 6.3 | |
| 146.5 | 11.21 | 14.88 | 7.11 | 11.01 | 40.88 | 39,645 | 4.7 | |
| 79.1 | 10.73 | 15.07 | 3.66 | 9.39 | 34.55 | 73,285 | 15.6 | |
| 134.8 | 11.99 | 17 | 5.51 | 11.22 | 36.85 | 73,236 | 10.9 | |
| 50.3 | 5.95 | 12.98 | 1.13 | 4.91 | 35.45 | 93,752 | 5.4 | |
| 126.4 | 15.18 | 21.88 | 5 | 12.89 | 40.2 | 39,559 | 2.6 | |
| 116.9 | 15.87 | 21.96 | 7.26 | 14.12 | 34.34 | 46,844 | 4.9 | |
| 113.1 | 14.98 | 20.61 | 3.9 | 13.36 | 26.6 | 115,178 | 15.9 | |
| 92.5 | 14.52 | 22.07 | 3.37 | 12.64 | 33 | 53,501 | 3.9 | |
| 114.6 | 13.68 | 20.1 | 5.63 | 11.44 | 32.92 | 55,125 | 5.4 | |
| 121.7 | 13.44 | 19.02 | 6.73 | 12.88 | 37.6 | 44,215 | 4.7 | |
| 105.6 | 11.68 | 16.68 | 5.13 | 10.79 | 44.46 | 45,936 | 7.4 | |
| 115.5 | 14.41 | 20.71 | 4.7 | 11.89 | 37.66 | 44,866 | 4 | |
| 112.2 | 13.79 | 20.16 | 3.97 | 11.37 | 33.97 | 49,355 | 11.7 | |
| 87.4 | 13.56 | 19.62 | 4.79 | 11.78 | 34.9 | 49,209 | 2.5 | |
| 86.6 | 13.58 | 18.89 | 4.38 | 11.52 | 37.52 | 44,918 | 3.2 | |
| 64.6 | 12.47 | 19.35 | 1.96 | 10.31 | 31.14 | 41,335 | 3.4 | |
| 106.2 | 15.44 | 21.77 | 5.09 | 13.14 | 37.87 | 52,901 | 3.4 | |
| 121.3 | 14.71 | 22.94 | 4.29 | 10.41 | 35.18 | 38,385 | 6 | |
| 137.1 | 18.44 | 25.5 | 8.5 | 16.94 | 38.06 | 49,775 | 6.6 | |
| 89.8 | 14.29 | 21.61 | 0.83 | 10.27 | 35.4 | 62,839 | 5.1 | |
| 126.6 | 17.22 | 24.76 | 7.7 | 16.16 | 40.09 | 38,069 | 6.4 | |
- Source:[86]
See also
Notes and references
Notes
- trade data exclude trade with Switzerland
- general government gross debt; gross debt consists of all liabilities that require payment or payments of interest and/or principal by the debtor to the creditor at a date or dates in the future; includes debt liabilities in the form of Special Drawing Rights (SDRs), currency and deposits, debt securities, loans, insurance, pensions and standardized guarantee schemes, and other accounts payable; all liabilities in the GFSM (Government Financial Systems Manual) 2001 system are debt, except for equity and investment fund shares and financial derivatives and employee stock options
- Includes federal, cantonal and municipal accounts
References
- "World Economic Outlook Database, April 2019". IMF.org. International Monetary Fund. Retrieved 29 September 2019.
- "World Bank Country and Lending Groups". datahelpdesk.worldbank.org. World Bank. Retrieved 29 September 2019.
- "Population on 1 January". ec.europa.eu/eurostat. Eurostat. Retrieved 13 July 2020.
- "World Economic Outlook Database, October 2019". IMF.org. Washington, DC, U.S.: International Monetary Fund. Retrieved 20 October 2019.
- "World Economic Outlook Database, April 2020". IMF.org. International Monetary Fund. Retrieved 16 June 2020.
- "CIA World Factbook". CIA.gov. Central Intelligence Agency. Retrieved 16 January 2019.
- "Swiss Consumer Price Index in December 2019". Swiss Federal Statistical Office. 7 January 2020. Retrieved 23 January 2020.
- "People at risk of poverty or social exclusion". ec.europa.eu. Eurostat. Retrieved 20 October 2019.
- "Gini coefficient of equivalised disposable income - EU-SILC survey". ec.europa.eu. Eurostat. Retrieved 20 October 2019.
- "Human Development Index (HDI)". hdr.undp.org. HDRO (Human Development Report Office) United Nations Development Programme. Retrieved 11 December 2019.
- "Inequality-adjusted HDI (IHDI)". hdr.undp.org. UNDP. Retrieved 22 May 2020.
- "Labor force, total - Switzerland". data.worldbank.org. World Bank. Retrieved 5 November 2019.
- "Employment rate by sex, age group 20-64". ec.europa.eu/eurostat. Eurostat. Retrieved 20 October 2019.
- "Unemployment by sex and age - monthly average". appsso.eurostat.ec.europa.eu. Eurostat. Retrieved 4 June 2020.
- "Youth unemployment rate". data.oecd.org. OECD. Retrieved 16 June 2020.
- "Earnings and wages - Average wages - OECD Data". the OECD. Retrieved 19 September 2018.
- "Ease of Doing Business in Switzerland". Doingbusiness.org. Retrieved 2017-11-21.
- "Increase in Swiss official development assistance". Swiss Agency for Development and Cooperation - SDC. 2010-09-17. Retrieved 2010-10-11.
- "Sovereigns rating list". Standard & Poor's. Retrieved 26 May 2011.
- Rogers, Simon; Sedghi, Ami (15 April 2011). "How Fitch, Moody's and S&P rate each country's credit rating". The Guardian. Retrieved 28 May 2011.
- "Switzerland faces steady if slowing growth amidst currency and real estate risks". Scope Ratings. Retrieved 20 September 2018.
- "The Global Innovation Index 2015 : Effective Innovation Policies for Development" (PDF). Globalinnovationindex.org. Retrieved 2016-03-31.
- https://www.swissinfo.ch/eng/switzerland-ranked-third-in-global-competitiveness-ranking/45831026
- "These are the world's 10 most competitive economies". World Economic Forum. Retrieved 2017-09-27.
- National Accounts Main Aggregates Database, 2016 by United Nations Statistics Division
- Regina Wecker, "Frauenlohnarbeit - Statistik und Wirklichkeit in der Schweiz an der Wende zum 20," Jahrhundert Schweizerische Zeitschrift für Geschichte (1984) 34#3 pp 346-356.
- World War 1 and Economic crisis, Britannica Encyclopedia
- Roman Studer, "When Did the Swiss Get so Rich?" Comparing Living Standards in Switzerland and Europe, 1800-1913, Journal of European economic history (2008) 37 (2), 405-452.
- National report on the Swiss Energy regime, BARENERGY project of EU,"Archived copy" (PDF). Archived from the original (PDF) on 2012-05-26. Retrieved 2014-01-22.CS1 maint: archived copy as title (link)
- "Switzerland during the Cold War (1945-1989)". www.eda.admin.ch - Federal Department of Foreign Affairs FDFA. Retrieved 19 September 2018.
- Swiss Federal Statistical Office. "Bruttoenergieverbrauch: Anteil der Primärenergieträger und Entwicklung - 1910-2014". Bundesamt für Statistik (in German). Retrieved 19 September 2018.
- Graph of GDP growth annual % "World Bank"
- "Öffentliche Finanzen - Panorama" (in German). Bundesamt für Statistik (BFS). February 2013. p. 18.3. Archived from the original on 2013-04-28. Retrieved 2013-05-22.
- https://data.oecd.org/lprdty/gdp-per-hour-worked.htm#indicator-chart
- "Amstat.ch". www.amstat.ch (in German). Retrieved 19 September 2018.
- "Unemployment statistics - Statistics Explained". ec.europa.eu. Retrieved 19 September 2018.
- "Gross domestic product - quarterly estimates". Archived from the original on 2010-09-23. Retrieved 2010-10-11.
- "Outlook T1" (PDF). Retrieved 2011-04-27.
- https://www.bfs.admin.ch/bfs/en/home/statistics/national-economy/national-accounts/gross-domestic-product.html
- "Report for Selected Countries and Subjects". Retrieved 2018-09-02.
- "Report for Selected Countries and Subjects". www.imf.org. Retrieved 2019-12-25.
- Swiss Federal Statistical Office - Switzerland (in German) accessed 21 December 2009
- "Switzerland". The World Factbook. Central Intelligence Agency.
- "Archived copy". Archived from the original on February 18, 2013. Retrieved February 20, 2013.CS1 maint: archived copy as title (link)
- Organic Farming in Switzerland Archived 2009-03-26 at the Wayback Machine By Urs Niggli.
- "Food and Agriculture - Pocket Statistics 2017". Federal Statistical Office. 2017.
- "SWISS ENVIRONMENTAL STATISTICS : 2006" (PDF). Bfs.admin.ch. Retrieved 2016-03-31.
- "MAX - Unsupported Browser Warning" (PDF). Ustr.gov. Archived from the original (PDF) on 2009-05-06. Retrieved 2016-03-31.
- "United Nations Statistics Division - Trade Statistics". Unstats.un.org. 2014-08-01. Retrieved 2016-03-31.
- Simoes, AJG; Hidalgo, CA. "OEC: The Observatory of Economic Complexity". oec.world. The Observatory of Economic Complexity. Retrieved 2019-11-13.
- C.G. Schmutz (18 August 2015) Wenn die Armee immer weniger Munition kauft (German) Neue Zürcher Zeitung (Wirtschaft) accessed 18 August 2015
- Seco - Ausfuhr von Kriegsmaterialien im Jahr 2013 (German) accessed 18 August 2015
- Swiss car register Archived 2013-06-07 at the Wayback Machine accessed 7 May 2012
- Switzerland Tourism, "Swiss Tourism in Figures - 2007 Archived 2012-03-31 at the Wayback Machine"
- Swiss Federal Statistical Office - Tourism accessed 7 May 2012
- SECO Gross domestic product - quarterly estimates Archived September 23, 2010, at the Wayback Machine accessed 7 May 2012
- Swiss Bankers Association - Positions and press-releases Accessed January 12th, 2018 (content added at an earlier date)
- "The economic significance of the Swiss financial centre" (PDF). Swiss Bankers Association. Archived from the original (PDF) on 2010-02-17. Retrieved 2010-05-20. Kommunikation Unternehmen Archived 2014-01-22 at the Wayback Machine
- "The World Factbook - Switzerland - Introduction". Central Intelligence Agency. 2006-06-13. Archived from the original on 2006-07-05. Retrieved 2006-06-17.
- "Country profile: Switzerland". BBC News. 2006-03-26. Retrieved 2006-06-17.
- The Boston Consulting Group "Global Wealth 2009"
- "The economic significance of the Swiss financial centre" (PDF). Swiss Bankers Association. Archived from the original (PDF) on February 17, 2010. Retrieved 2010-05-20.
- "Origins: Why Basel?". Bank of International Settlements. Retrieved 2006-06-16.
- "Foreign Banks In Switzerland Manage CHF870 Billion In Assets". Dow Jones. 2006-05-29. Archived from the original on 2012-07-03. Retrieved 2006-06-15.
- Giles Broom (2014-05-20). "Foreign Banks in Switzerland Increase Client Assets, Group Says". Bloomberg. Retrieved 2016-03-31.
- "Banking: A Crack In The Swiss Vault". 60 Minutes. CBS. December 30, 2009. Archived from the original on May 21, 2014.
- https://www.ft.com/content/891d5eea-e222-11e1-8e9d-00144feab49a
- https://www.usatoday.com/story/news/world/2014/01/22/swiss-banking-secrecy/4390231/
- "Statistik Schweiz - Mindestlohn-Initiative". Retrieved 2016-04-01.
- Haushaltseinkommen und -ausgaben 2013 Archived 2016-09-19 at the Wayback Machine Federal Statistical Office (Switzerland); exchange rate 0.90 in December 2013 (xe.com), PPP factor 1.322 as of 2013 (down from 1.851 in 2000) according to oecd.org
- National Accounts at a Glance 2014, OECD Publishing (2014), p. 66.
- Global Wealth Report 2016. Credit Suisse. 2016. Archived from the original on 2017-05-15. Retrieved 2017-07-22.
- "Swiss fortunes in 2011 have more than doubled since 2000 in dollar terms" Franc's rise puts Swiss top of rich list, Simon Bowers, The Guardian, 19 October 2011. CHF 500,000 in late 2007 corresponded to USD 403,000 (USD 252,000 PPP), in late 2011 to USD 540,000 (USD 380,000 PPP) and in 2015 to USD 510,000 (USD 400,000 PPP). Exchange rates: xe.com, PPP conversion: 1.601 (2007), 1.433 (2011), 1.275 (2015) oecd.org.
- Tages Anzeiger, Das reichste Land der Welt (20 October 2011) reports 3,820 individuals with a wealth of USD 50 million or more, out of a total population of just above 8 million.
- https://www.swissinfo.ch/eng/fact-check_are-most-swiss-residents-rich-/45113786
- Swiss Federal Statistical Office - European Union (in German) accessed 21 December 2009
- Swiss Federal Statistical Office - Germany (in German) accessed 21 December 2009
- Swiss Federal Statistical Office - France (in German) accessed 21 December 2009
- Swiss Federal Statistical Office - Italy (in German) accessed 21 December 2009
- Swiss Federal Statistical Office - United Kingdom (in German) accessed 21 December 2009
- Swiss Federal Statistical Office - United States (in German) accessed 21 December 2009
- 2006 statistics
- 2002 statistics
- 2003 statistics
- Swiss Federal Tax Administration - Grafische Darstellung der Steuerbelastung 2011 in den Kantonen (in German and French) accessed 17 June 2013
- Regionale Disparitäten in der Schweiz - Schlüsselindikatoren Archived June 14, 2013, at the Wayback Machine (in German and French) accessed 20 December 2011
External links
| Wikimedia Commons has media related to Economy of Switzerland. |
- OECD's Switzerland country Web site and OECD Economic Survey of Switzerland
- SWISS MARKET IND
- Swiss Federal Statistical Office
- Gross Domestic Product Growth - Switzerland
- Swiss Economic Forecasts
- swissinfo.ch business news and articles
- World Bank Summary Trade Statistics Switzerland
- The Swiss Labour Law and Swiss employment contract
- Tariffs applied by Switzerland as provided by ITC's Market Access Map, an online database of customs tariffs and market requirements
| ||||||||||||||||||||||||||||||||||||||||
.svg.png)