Economy of Sweden
The economy of Sweden is a developed export-oriented economy aided by timber, hydropower, and iron ore. These constitute the resource base of an economy oriented toward foreign trade. The main industries include motor vehicles, telecommunications, pharmaceuticals, industrial machines, precision equipment, chemical goods, home goods and appliances, forestry, iron, and steel. Traditionally a modern agricultural economy that employed over half the domestic workforce, today Sweden further develops engineering, mine, steel, and pulp industries that are competitive internationally, as evidenced by companies like Ericsson, ASEA/ABB, SKF, Alfa Laval, AGA, and Dyno Nobel.[27]
 | |
| Currency | Swedish krona (SEK, kr) |
|---|---|
| Calendar year | |
Trade organisations | EU, WTO, OECD and others |
Country group | |
| Statistics | |
| Population | |
| GDP | |
| GDP rank | |
GDP growth |
|
GDP per capita | |
GDP per capita rank | |
GDP by sector |
|
Population below poverty line | |
Labour force | |
Labour force by occupation |
|
| Unemployment | |
Average gross salary | €40,000/ $54,000 annual (2014)[15][16] |
Average net salary | €31,000/ $40,000 annual (2014)[15][16] |
Main industries | |
| External | |
| Exports | |
Export goods | machinery, motor vehicles, paper products, pulp and wood, iron and steel products, chemicals, military armaments |
Main export partners |
|
| Imports | |
Import goods | machinery, petroleum and petroleum products, chemicals, motor vehicles, iron and steel; foodstuffs, clothing |
Main import partners |
|
FDI stock | $0.5 trillion (31 December 2012 est.) |
Gross external debt | $939.9 billion (31 March 2016) |
| Public finances | |
| Revenues | 49.8% of GDP (2019)[22] |
| Expenses | 49.3% of GDP (2019)[22] |
| Economic aid | donor: ODA, ~$4 billion (April. 2007) |
Foreign reserves | $60 billion (31 December 2012 est.)[26] |
Sweden is a competitive and highly liberalized, open market economy. The vast majority of Swedish enterprises are privately owned and market-oriented, combined with a strong welfare state involving transfer payments involving up to three-fifths of GDP.[28][29] In 2014 the percent of national wealth owned by the government was 24%.[30]
Due to Sweden being a neutral country that did not actively participate in World War II, it did not have to rebuild its economic base, banking system, and country as a whole, as did many other European countries. Sweden has achieved a high standard of living under a mixed system of high-tech capitalism and extensive welfare benefits. Sweden has the second highest total tax revenue behind Denmark, as a share of the country's income. As of 2012, total tax revenue was 44.2% of GDP, down from 48.3% in 2006.[31]
In 2014 the National Institute of Economic research predicted GDP growth of 1.8%, 3.1% and 3.4% in 2014, 2015 and 2016 respectively.[32] A comparison of upcoming economic growth rates of EU countries revealed that the Baltic states, Poland, and Slovakia are the only countries that are expected to keep comparable or higher growth rates.[33]
History
In the 19th century Sweden evolved from a largely agricultural economy into the beginnings of an industrialized, urbanized country. Poverty was still widespread. However, incomes were sufficiently high to finance emigration to distant places, prompting a large portion of the country to leave, especially to the United States. Economic reforms and the creation of a modern economic system, banks and corporations were enacted during the later half of the 19th century. During that time Sweden was in a way the "powerhouse" of the Scandinavian region with a strong industrialization process commencing in the 1860s. Moreover, the Swedish Riksdag had developed into a very active Parliament already during the Age of Liberty (1719–72), and this tradition continued into the nineteenth century, laying the basis for the transition towards modern democracy at the end of said century. Apart from relatively high levels of human capital formation, the result of the Reformation and related government policies, such local democratic traditions were the other asset that made the "catching up" of the Scandinavian countries, including Sweden, possible and this economic rise was probably the most remarkable phenomenon in that region during the nineteenth century.[34]
By the 1930s, Sweden had what Life magazine called in 1938 the "world's highest standard of living".[35] Sweden declared itself neutral during both world wars, thereby avoiding much physical destruction and instead, especially after the First World War, profiting from the new circumstances – such as booming demand for raw materials and foodstuffs and the disappearance of international competition for its exports.[36] The postwar boom, that was the continuation of strong inflationary tendencies during the war itself,[36] propelled Sweden to greater economic prosperity. Beginning in the 1970s and culminating with the deep recession of the early 1990s, Swedish standards of living developed less favorably than many other industrialized countries. Since the mid-1990s the economic performance has improved.
In 2009, Sweden had the world's tenth highest GDP per capita in nominal terms and was in 14th place in terms of purchasing power parity.[37]
Crisis of the 1990s
Sweden has had an economic model in the post-World War II era characterized by close cooperation between the government, labour unions, and corporations. The Swedish economy has extensive and universal social benefits funded by high taxes, close to 50% of GDP.[38] In the 1980s, a real estate and financial bubble formed, driven by a rapid increase in lending. A restructuring of the tax system, in order to emphasize low inflation combined with an international economic slowdown in the early 1990s, caused the bubble to burst. Between 1990 and 1993 GDP went down by 5% and unemployment skyrocketed, causing the worst economic crisis in Sweden since the 1930s. According to an analysis published in Computer Sweden in 1992, the investment level decreased drastically for information technology and computing equipment, except in the financial and banking sector, the part of the industry that created the crisis.[39] The investment levels for IT and computers were restored as early as 1993.[40] In 1992 there was a run on the currency, the central bank briefly jacking up interest to 500% in an unsuccessful effort to defend the currency's fixed exchange rate.[41] Total employment fell by almost 10% during the crisis.
A real estate boom ended in a bust. The government took over nearly a quarter of banking assets at a cost of about 4% of the nation's GDP. This was known colloquially as the "Stockholm Solution". In 2007, the United States Federal Reserve noted, "In the early 1970s, Sweden had one of the highest income levels in Europe; today, its lead has all but disappeared...So, even well-managed financial crises don't really have a happy ending".[42]
The welfare system that had been growing rapidly since the 1970s could not be sustained with a falling GDP, lower employment and larger welfare payments. In 1994 the government budget deficit exceeded 15% of GDP. The response of the government was to cut spending and institute a multitude of reforms to improve Sweden's competitiveness. When the international economic outlook improved combined with a rapid growth in the IT sector, which Sweden was well positioned to capitalize on, the country was able to emerge from the crisis.[43]
The crisis of the 1990s was by some viewed as the end of the much buzzed welfare model called "Svenska modellen", literally "The Swedish Model", as it proved that governmental spending at the levels previously experienced in Sweden was not long term sustainable in a global open economy.[44] Much of the Swedish Model's acclaimed advantages actually had to be viewed as a result of the post WWII special situation, which left Sweden untouched when competitors' economies were comparatively weak.[45]
However, the reforms enacted during the 1990s seem to have created a model in which extensive welfare benefits can be maintained in a global economy.[38]
Data
The following table shows the main economic indicators in 1980–2017. Inflation under 2% is in green.[46]
| Year | GDP (in Bil. US$ PPP) |
GDP per capita (in US$ PPP) |
GDP growth (real) |
Inflation rate (in Percent) |
Unemployment (in Percent) |
Government debt (in % of GDP) |
|---|---|---|---|---|---|---|
| 1980 | 87.5 | 10,516 | 2.7 % | n/a | ||
| 1981 | n/a | |||||
| 1982 | n/a | |||||
| 1983 | n/a | |||||
| 1984 | n/a | |||||
| 1985 | n/a | |||||
| 1986 | n/a | |||||
| 1987 | n/a | |||||
| 1988 | n/a | |||||
| 1989 | n/a | |||||
| 1990 | n/a | |||||
| 1991 | n/a | |||||
| 1992 | n/a | |||||
| 1993 | 66.3 % | |||||
| 1994 | ||||||
| 1995 | ||||||
| 1996 | ||||||
| 1997 | ||||||
| 1998 | ||||||
| 1999 | ||||||
| 2000 | ||||||
| 2001 | ||||||
| 2002 | ||||||
| 2003 | ||||||
| 2004 | ||||||
| 2005 | ||||||
| 2006 | ||||||
| 2007 | ||||||
| 2008 | ||||||
| 2009 | ||||||
| 2010 | ||||||
| 2011 | ||||||
| 2012 | ||||||
| 2013 | ||||||
| 2014 | ||||||
| 2015 | ||||||
| 2016 | ||||||
| 2017 |
Contemporary economy
Sweden is an export-oriented mixed economy featuring a modern distribution system, excellent internal and external communications, and a skilled labor force. Timber, hydropower and iron ore constitute the resource base of an economy heavily oriented toward foreign trade. Sweden's engineering sector accounts for 50% of output and exports. Telecommunications, the automotive industry and the pharmaceutical industries are also of great importance. Agriculture accounts for 2 percent of GDP and employment.
The 20 largest Sweden-registered companies by turnover in 2013 were Volvo, Ericsson, Vattenfall, Skanska, Hennes & Mauritz, Electrolux, Volvo Personvagnar, Preem, TeliaSonera, Sandvik, ICA, Atlas Copco, Nordea, Svenska Cellulosa Aktiebolaget, Scania, Securitas, Nordstjernan, SKF, ABB Norden Holding, and Sony Mobile Communications AB.[47] Sweden's industry is overwhelmingly in public and state control, the most prominent example of this is LKAB, which is a state-owned mining company, mostly active in the northern part of the country, with the largest noted market share out of all its domestic competitors.
Some 4.5 million residents are working, out of which around a third with tertiary education. GDP per hour worked is the world's 9th highest at 31 USD in 2006, compared to 22 USD in Spain and 35 USD in United States.[48] According to OECD, deregulation, globalization, and technology sector growth have been key productivity drivers.[48] GDP per hour worked is growing 2 1⁄2 per cent a year for the economy as a whole and trade-terms-balanced productivity growth 2%.[48] Sweden is a world leader in privatized pensions and pension funding problems are small compared to many other Western European countries.[49] Swedish labor market has become more flexible, but it still has some widely acknowledged problems.[48] The typical worker receives only 40% of his income after the tax wedge. The slowly declining overall taxation, 51% of GDP in 2007, is still nearly double of that in the United States or Ireland. Civil servants amount to a third of Swedish workforce, multiple times the proportion in many other countries. Overall, GDP growth has been fast since reforms in the early 1990s, especially in manufacturing.[50]
World Economic Forum 2012–2013 competitiveness index ranks Sweden 4th most competitive.[51] The Index of Economic Freedom 2012 ranks Sweden the 21st most free out of 179 countries, or 10th out of 43 European countries.[52] Sweden ranked 9th in the IMD Competitiveness Yearbook 2008, scoring high in private sector efficiency.[53] According to the book, The Flight of the Creative Class, by the U.S. urban studies, Professor Richard Florida of University of Toronto, Sweden is ranked as having the best creativity in Europe for business and is predicted to become a talent magnet for the world's most purposeful workers. The book compiled an index to measure the kind of creativity it claims is most useful to business – talent, technology and tolerance.[54] Sweden's investment into research and development stood, in 2007, at over 3.5% of GDP. This is considerably higher than that of a number of MEDCs, including the United States, and is the largest among the OECD members.[55]
Sweden rejected the Euro in a referendum in 2003, and Sweden maintains its own currency, the Swedish krona (SEK). The Swedish Riksbank – founded in 1668 and thus making it the oldest central bank in the world – is currently focusing on price stability with its inflation target of 2%. According to Economic Survey of Sweden 2007 by OECD, the average inflation in Sweden has been one of the lowest among European countries since the mid-1990s, largely because of deregulation and quick utilization of globalization.[48]
The largest trade flows are with Germany, United States, Norway, United Kingdom, Denmark and Finland.
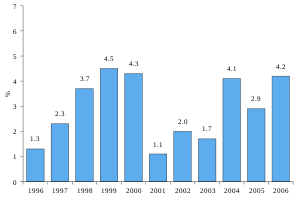
The Swedish economic picture has brightened significantly since the severe recession in the early 1990s. Growth has been strong in recent years, and even though the growth in the economy slackened between 2001 and 2003, the growth rate has picked up since with an average growth rate of 3.7% in the last three years. The long-run prospects for growth remain favorable. The inflation rate is low and stable, with projections for continued low levels over the next 2–3 years.
Since the mid-1990s the export sector has been booming, acting as the main engine for economic growth. Swedish exports also have proven to be surprisingly robust. A marked shift in the structure of the exports, where services, the IT industry, and telecommunications have taken over from traditional industries such as steel, paper and pulp, has made the Swedish export sector less vulnerable to international fluctuations. However, at the same time the Swedish industry has received less money for its exports while the import prices have gone up. During the period 1995–2003 the export prices were reduced by 4% at the same time as the import prices climbed by 11%. The net effect is that the Swedish terms-of-trade fell 13%.[56]
By 2014, legislators, economists and the IMF were warning of a bubble with residential property prices soaring and the level of personal mortgage debt expanding. Household debt-to-income rose above 170% as the IMF called on legislators to consider zoning reform and other means of generating a greater supply of housing as demand was outstripping supply. By August 2014, 40% of home borrowers had interest-only loans while those that didn't were repaying principal at a rate that would take 100 years to fully repay.[57]
Government
The government budget has improved dramatically from a record deficit of more than 12% of GDP in 1993. In the last decade, from 1998 to present, the government has run a surplus every year, except for 2003 and 2004. The surplus for 2011 is expected to be 99 billion ($15b) kronor.[58] The new, strict budget process with spending ceilings set by the Riksdag, and a constitutional change to an independent Central Bank, have greatly improved policy credibility.
From the perspective of longer term fiscal sustainability, the long-awaited reform of old-age pensions entered into force in 1999. This entails a far more robust system vis-à-vis adverse demographic and economic trends, which should keep the ratio of total pension disbursements to the aggregate wage bill close to 20% in the decades ahead. Taken together, both fiscal consolidation and pension reform have brought public finances back on a sustainable footing. Gross public debt, which jumped from 43% of GDP in 1990 to 78% in 1994, stabilised around the middle of the 1990s and started to come down again more significantly beginning in 1999. In 2000 it fell below the key level of 60% and had declined to a level of 35% of GDP as of 2010.[59]
Economic and monetary union
Current economic development reflects a quite remarkable improvement of the Swedish economy since the crisis in 1991–93, so that Sweden could easily qualify for membership in the third phase of the Economic and Monetary Union of the European Union, adopting the euro as its currency. In theory, by the rules of the EMU, Sweden is obliged to join, since the country has not obtained exception by any protocol or treaty (as opposed to Denmark and the United Kingdom). Nevertheless, the Swedish government decided in 1997 against joining the common currency from its start on 1 January 1999. This choice was implemented by exploiting a legal loophole, deliberately staying out of the European Exchange Rate Mechanism.[60] This move is currently tolerated by the European Central Bank, which however has warned that this would not be the case for newer EU members.[61]
In the first years of the twenty-first century, a majority for joining emerged in the governing Social Democratic party, although the question was subject of heated debate, with leading personalities in the party on both sides. On 14 September 2003, a national referendum was held on the euro. A 56% majority of Swedes rejected the common currency, while 42% voted in favour of it.[62] Currently no plans for a new referendum or parliamentary vote on the matter are being discussed, though it has been implied that another referendum may take place in around ten years.[63]
Unemployment
In contrast with most other European countries, Sweden maintained an unemployment rate around 2% or 3% of the work force throughout the 1980s.[64] This was, however, accompanied by high and accelerating inflation. It became evident that such low unemployment rates were not sustainable, and in the severe crisis of the early 1990s the rate increased to more than 8%. In 1996 the government set out a goal of reducing unemployment to 4% by 2000. During 2000 employment rose by 90,000 people, the greatest increase in 40 years, and the goal was reached in the autumn of 2000. The same autumn the government set out its new target: that 80% of the working age population will have a regular job by 2004. Some have expressed concern that meeting the employment target may come at a cost of too high a rate of wage increases hence increasing inflation. However, as of August 2006, roughly 5% of working age Swedes were unemployed, over the government-established goal. However, some of the people who cannot find work are put away in so-called "labour market political activities", referred to as "AMS-åtgärder".[65]
According to Jan Edling, a former trade-unionist, the actual number of unemployed is far higher, and those figures are being suppressed by both the government and the Swedish Trade Union Confederation. In Edling's report he added that a further 3% of Swedes were occupied in state-organised job schemes, not in the private sector. He also claimed a further 700,000 Swedes are either on long-term sick leave or in early retirement. Edling asks how many of these people are in fact unemployed. According to his report, the "actual unemployment" rate hovers near 20%.[66] Some critics disagree with this concept of "actual" unemployment, also termed "broad unemployment", since they do not see e.g. students who rather want a job, people on sick leave and military conscripts as "unemployed".[67]
According to Swedish Statistics, unemployment in June 2013 was 9.1% in the general population and 29% amongst 15- to 25-year-olds.[68]
Trade unions
Around seventy percent of the Swedish labour force is unionised.[69] For most unions there is a counterpart employer's organization for businesses. The unions and employer organisations are independent of both the government and political parties, although the largest confederation of unions, the National Swedish Confederation of Trade Unions or LO (organising blue-collar workers), maintains close links to one of the three major parties, the Social Democrats.
The unionisation rate among white-collar workers is exceptionally high in Sweden – since 2008 higher than for blue-collar workers. In 2019, blue-collar density was 60%, and white-collar density was 72% (full-time students working part-time excluded). Just before the considerably raised fees to union unemployment funds in January 2007, blue-collar and white-collar union density was the same (77% in 2006).[70][71] The average union density was 70% in the years 2011-2014, 69% in 2015-2017 and 68% in 2018 and 2019. There are two major confederations that organise professionals and other qualified employees: the Swedish Confederation of Professional Employees (Tjänstemännens Centralorganisation or TCO) and the Swedish Confederation of Professional Associations (Sveriges Akademikers Centralorganisation or SACO). They are both independent from Sweden's political parties and never endorse candidates for office in political elections.
There is no minimum wage that is required by legislation. Instead, minimum wage standards in different sectors are normally set by collective bargaining. About 90% of all workers are covered by collective agreements, in the private sector 83% (2018).[72] [73] The high coverage of collective agreements is achieved despite the absence of state mechanisms extending collective agreements to whole industries or sectors. This reflects the dominance of self-regulation (regulation by the labour market parties themselves) over state regulation in Swedish industrial relations.[74]
Sweden has not joined the EMU (the Economic and Monetary Union / the Euro) and will not in the foreseeable future. When the issue was at the agenda, the Swedish union movement was very split.[75] In contrast to the very positive attitude of employers' associations, the union rank-and file opinion was so split that several unions, as well as the confederations LO, TCO and SACO, abstained from taking an official position.
Labour force
The traditionally low wage differential has increased in recent years as a result of increased flexibility as the role of wage setting at the company level has strengthened somewhat. Still, Swedish unskilled employees are well paid while well educated Swedish employees are low-paid compared with those in competitor countries in Western Europe and the US. The average increases in real wages in recent years have been high by historical standards, in large part due to unforeseen price stability. Even so, nominal wages in recent years have been slightly above those in competitor countries. Thus, while private-sector wages rose by an average annual rate of 3.75% from 1998 to 2000 in Sweden, the comparable increase for the EU area was 1.75%. In the year 2000 the total labour force was around 4.4 million people.[67]
Ongoing and finished privatisations
The Swedish government has announced that it will privatise a number of wholly and partly state owned companies."The income from these sales will be used to pay off the government debt and reduce the burden of debt for future generations. The Government's ambition is to sell companies to a value of SEK 200 billion during 2007–2010."[76]
- Ongoing Privatisations
- Telia Sonera – telecom. 37.3% owned by the Swedish government.[77] Hitherto SEK 18 billion worth of shares has been sold reducing state ownership from 45.3% to 37.3%.[78]
- SAS Group – airline. 14.8% owned by the Swedish government.[79] On 13 October 2016 the Swedish government sold 13.8 million shares worth 213.9 million SEK. The Minister of Enterprise, Mikael Damberg stated that "There exists good reasons for the Swedish government not be a long-term owner of a publicly traded airline... This sell-off is a first step towards reducing the Swedish government's ownership in a responsible manner."[80]
- Completed Privatisations
- OMX – stock exchange. Shares sold to Borse Dubai for 2.1 billion SEK.[81]
- Vin & Sprit. Sold to Pernod Ricard for 5.6 billion Euro.[82]
- Vasakronan. Sold to AP Fastigheter for 4.3 billion Euro.
- Nordea – bank. 19.5% owned by Swedish government.[83] Last government-held block of shares was sold in September 2013.
See also
- Taxation in Sweden
- Mining in Sweden
- Private
- List of Swedish companies
- List of largest Swedish companies
- Stockholm Stock Exchange
- Government
- Government finance
- Central bank ("Sveriges Riksbank")
- Currency ("krona", "kronor" in plural)
- List of Swedish government enterprises
- Monetary policy of Sweden
- Ministry of Finance
- Swedish National Institute of Economic Research
- Swedish National Financial Management Authority
- Spending
- Agencies, unions
- Energy policy
- Government finance
Other links
References
- "World Economic Outlook Database, April 2019". IMF.org. International Monetary Fund. Retrieved 29 September 2019.
- "World Bank Country and Lending Groups". datahelpdesk.worldbank.org. World Bank. Retrieved 29 September 2019.
- "Population on 1 January". ec.europa.eu/eurostat. Eurostat. Retrieved 13 July 2020.
- "World Economic Outlook Database, October 2019". IMF.org. International Monetary Fund. Retrieved 19 October 2019.
- "World Economic Outlook Database, April 2020". IMF.org. International Monetary Fund. Retrieved 15 April 2020.
- "Sweden". The World Factbook. CIA. Retrieved 27 January 2020.
- "People at risk of poverty or social exclusion". ec.europa.eu/eurostat. Eurostat. Retrieved 3 July 2020.
- "Gini coefficient of equivalised disposable income - EU-SILC survey". ec.europa.eu/eurostat. Eurostat. Retrieved 3 July 2020.
- "Human Development Index (HDI)". hdr.undp.org. HDRO (Human Development Report Office) United Nations Development Programme. Retrieved 11 December 2019.
- "Inequality-adjusted HDI (IHDI)". hdr.undp.org. UNDP. Retrieved 22 May 2020.
- "Labor force, total - Sweden". data.worldbank.org. World Bank. Retrieved 1 November 2019.
- "Employment rate by sex, age group 20-64". ec.europa.eu/eurostat. Eurostat. Retrieved 1 November 2019.
- "Unemployment by sex and age - monthly average". appsso.eurostat.ec.europa.eu. Eurostat. Retrieved 18 June 2020.
- "Youth unemployment rate". data.oecd.org. OECD. Retrieved 14 March 2020.
- Wages and Taxes for the Average Joe in the EU 2
- "Archived copy". Archived from the original on 16 March 2015. Retrieved 3 February 2017.CS1 maint: archived copy as title (link)
- "Ease of Doing Business in Sweden". Doingbusiness.org. Retrieved 21 November 2017.
- "Export till våra 30 största handelspartner". Statistics Sweden. Retrieved 18 February 2018.
- "Import från våra 30 största handelspartner". Retrieved 18 February 2018.
- "Euro area and EU27 government deficit both at 0.6% of GDP" (PDF). ec.europa.eu/eurostat. Eurostat. Retrieved 28 April 2020.
- "Sovereigns rating list". Standard & Poor's. Retrieved 26 May 2011.
- Rogers, Simon; Sedghi, Ami (15 April 2011). "How Fitch, Moody's and S&P rate each country's credit rating". The Guardian. Retrieved 28 May 2011.
- "Scope affirms the Kingdom of Sweden's credit rating at AAA with a Stable Outlook". Scope Ratings. Retrieved 27 July 2019.
- "CIA World Fact book – Sweden". CIA. 31 December 2012. Retrieved 26 July 2013.
- Agricultural toward Industrial|Swedish economic history Archived 9 August 2012 at the Wayback Machine. Ekonomifakta.se (28 September 2012). Retrieved on 2013-01-29.
- "How Sweden Created a Model Economy". Sweden.se. 2 November 2018. Retrieved 3 October 2019.
Today, Sweden has a diverse and highly competitive and successful economy. The World Economic Forum ranks Sweden among the top ten most competitive countries in the world. Sweden is also one of the easiest countries in the world to do business with, according to the World Bank. A key feature of the Swedish economy is its openness and liberal approach to trade and doing business.
- "Sweden - Economy". Encyclopedia Britannica. Retrieved 3 October 2019.
Most enterprises are privately owned and market-oriented, but when transfer payments—such as pensions, sick pay, and child allowances—are included, roughly three-fifths of gross domestic product (GDP) passes through the public sector. Education, health care, and child care costs are primarily met by taxation. Government involvement in the distribution of national income, however, diminished over the last two decades of the 20th century.
- Public Wealth in the US and Nordic Countries
- Skattetrycket | Skattetryck | Skatter | Fakta och statistik. Ekonomifakta.se. Retrieved on 2013-01-29.
- "Swedish economy marking time". NIER. Archived from the original on 19 October 2014. Retrieved 19 October 2014.
- "Taking Europe's Pulse". The Economist. Retrieved 5 May 2014.
- Baten, Jörg (2016). A History of the Global Economy. From 1500 to the Present. Cambridge University Press. p. 22f. ISBN 9781107507180.
- "King Gustaf of Sweden". Life. 11 July 1938. p. 31. Retrieved 12 October 2012.
- Baten, Jörg (2016). A History of the Global Economy. From 1500 to the Present. Cambridge University Press. p. 25. ISBN 9781107507180.
- "Economist.com – Country Briefings: Sweden". The Economist.
- Steinmo, Sven. 2001. "Bucking the Trend? The Welfare State and Global Economy: The Swedish Case Up Close." University of Colorado, 18 December.
- "Computer Sweden 1992". Retrieved 3 March 2015.
- "Computer Sweden 1993". Retrieved 3 March 2015.
- Krona's Fall Threatens a New Currency Crisis in Europe – International Herald Tribune
- "404" (PDF). Archived from the original (PDF) on 21 October 2013. Retrieved 3 March 2015.
- "Archived copy". Archived from the original on 28 October 2007. Retrieved 19 August 2007.CS1 maint: archived copy as title (link)
- (in Swedish) Anförande vid the Economists konferens om Sverige Archived 5 July 2009 at the Wayback Machine. Regeringen.se. Retrieved on 2013-01-29.
- From War to the Swedish Model | Swedish economic history Archived 23 July 2009 at the Wayback Machine. Ekonomifakta.se (28 September 2012). Retrieved on 2013-01-29.
- "Report for Selected Countries and Subjects". www.imf.org. Retrieved 21 September 2018.
- 20 largest companies in Sweden
- Economic survey of Sweden 2007 Archived 26 April 2011 at the Wayback Machine
- Pension Reform in Sweden: Lessons for American Policymakers Archived 13 January 2010 at the Wayback Machine by Goran Normann, PhD and Daniel J. Mitchell, PhD 29 June 2000.
- OECD Economic Surveys: Sweden – Volume 2005 Issue 9 by OECD Publishing
- "The Global Competitiveness Report 2012 - 2013". Africa Competitiveness 2013. Retrieved 3 March 2015.
- "Sweden". Retrieved 3 March 2015.
- "WCC - Home". IMD. Retrieved 3 March 2015.
- ""Sweden most creative country in Europe & top talent hotspot" Archived 21 May 2007 at the Wayback Machine, Invest in Sweden Agency, 25 June 2005.
- "Main Science and Technology Indicators" (PDF). Organization for Economic Co-operation and Development. Archived from the original (PDF) on 15 February 2010. Retrieved 7 September 2008.
- http://sn.svensktnaringsliv.se/sn/Press.nsf/0/C2946EB9F1400D0EC1256FB6004F7CE6/$File/prm050228.pdf%5B%5D
- "Sweden facing possible property bubble warns IMF". Sweden News.Net. 24 August 2014. Retrieved 26 August 2014.
- "Archived copy" (PDF). Archived from the original (PDF) on 28 July 2011. Retrieved 11 July 2011.CS1 maint: archived copy as title (link)
- "Archived copy". Archived from the original on 27 February 2017. Retrieved 11 July 2011.CS1 maint: archived copy as title (link)
- J. James Reade, Ulrich Volz (April 2010). "Too Much to Lose, or More to Gain? Should Sweden Join the Euro?" (PDF). University of Birmingham.
- Palankai, Tibor (July 2015). "THE INTRODUCTION OF THE EURO AND CENTRAL EUROPE" (PDF). Journal of Scientific Papers ECONOMICS & SOCIOLOGY.
- "Sweden turns back on euro". BBC News. 15 September 2003. Retrieved 1 May 2010.
- Syll, Lars (July 2018). "Lars Syll: My Finest Hour – Sweden´s Euro Referendum". Brave New Europe.
- "Sweden Unemployment Rate". Index Mundi. Retrieved 12 December 2011.
- "Stefan Karlsson's blog". Retrieved 3 March 2015.
- Alla behövs Archived 26 May 2006 at the Wayback Machine Pdf file
- "Swedish Market". nordichouse.pl.
- "Labour Force Survey". Statistics Sweden. Archived from the original on 8 July 2011. Retrieved 11 July 2011.
- Arbetsgivarna starkare än fackföreningarna. DN.SE (18 June 2009). Retrieved on 2013-01-29.
- Anders Kjellberg (2020) Kollektivavtalens täckningsgrad samt organisationsgraden hos arbetsgivarförbund och fackförbund, Department of Sociology, Lund University. Studies in Social Policy, Industrial Relations, Working Life and Mobility. Research Reports 2020:1, Appendix 3 (in English) Table A; see also Anders Kjellberg (2017) The Membership Development of Swedish Trade Unions and Union Confederations Since the End of the Nineteenth Century (Studies in Social Policy, Industrial Relations, Working Life and Mobility). Research Reports 2017:2 (updated 2020). Lund: Department of Sociology, Lund University
- Anders Kjellberg (2011) "The Decline in Swedish Union Density since 2007" Nordic Journal of Working Life Studies (NJWLS) Vol. 1. No 1 (August 2011), pp. 67-93
- Anders Kjellberg (2020) Kollektivavtalens täckningsgrad samt organisationsgraden hos arbetsgivarförbund och fackförbund, Department of Sociology, Lund University. Studies in Social Policy, Industrial Relations, Working Life and Mobility. Research Reports 2020:1, Appendix 3 (in English) Table F
- Anders Kjellberg (2019) "Sweden: collective bargaining under the industry norm", in Torsten Müller & Kurt Vandaele & Jeremy Waddington (eds.) Collective bargaining in Europe: towards an endgame, European Trade Union Institute (ETUI) Brussels 2019. Vol. III (pp. 583-604)
- Anders Kjellberg (2017) ”Self-regulation versus State Regulation in Swedish Industrial Relations” In Mia Rönnmar and Jenny Julén Votinius (eds.) Festskrift till Ann Numhauser-Henning. Lund: Juristförlaget i Lund 2017, pp. 357-383
- Kjellberg, Anders (2000) "The Multitude of Challenges Facing Swedish Trade Unions", in Jeremy Waddington & Reiner Hoffmann (eds.) Trade Unions in Europe: Facing Challenges and Searching For Solutions, Bryssels: European Trade Union Institute, pp. 529-573, in particular pp. 544-547. ISBN 2-930143-36-3
- "Felsida". Retrieved 3 March 2015.
- "Annual + Sustainability Report 2015" (PDF). Teliasonera. p. 47. Retrieved 22 December 2016.
- "Privata Affärer – Placeringstips och råd om aktier, fonder, sparande och privatekonomi". Archived from the original on 27 September 2007. Retrieved 3 March 2015.
- https://www.regeringen.se/t/213487/sv
- https://www.regeringen.se/pressmeddelanden/2016/10/svenska-staten-har-salt-138-miljoner-aktier-i-sas/
- "Regeringen har sålt hela OMX-innehavet". Dagens Industri. 15 February 2008. Retrieved 2 May 2008.
- "Pernod wins auction for Vin & Sprit". The Local. 31 March 2008. Retrieved 31 March 2008.
- Shareholders | Nordea.com
External links
- Malminen, J., Managing global finance: Choices and constraints in the Swedish financial crisis of 1992. 2005.
- CIA World Factbook: Sweden
- OECD's Sweden country Web site and OECD Economic Survey of Sweden
- Sveriges Riksbank (Swedish Central Bank)
- Statistics Sweden
- Sweden Global Investment Discussion by N. Vardy, August 2006
- Sweden – Economic Growth and Structural Change, 1800–2000 – EH.Net Encyclopedia
- United States Department of State – Sweden
- World Bank Summary Trade Statistics Sweden
- Banks in Sweden: useful information about the financial institutions in the country
- Tariffs applied by Sweden as provided by ITC's Market Access Map, an online database of customs tariffs and market requirements

| Members | ||
|---|---|---|
| Past members | ||
Future enlargement of the European Union | ||