Economy of France
The economy of France is highly developed and free-market-oriented.[26] It is the world's 7th largest economy by 2019 nominal figures and the 10th largest economy by PPP figures. It is the 2nd largest economy in the European Union after Germany.[27]
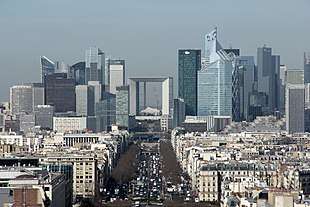 La Défense is the financial hub of France | |
| Currency | Euro (EUR, €) |
|---|---|
| 1 January – 31 December | |
Trade organisations | EU, WTO and OECD |
Country group | |
| Statistics | |
| Population | |
| GDP | |
| GDP rank | |
GDP growth |
|
GDP per capita | |
GDP per capita rank | |
GDP by sector |
|
Population below poverty line |
|
Labour force | |
Labour force by occupation |
|
| Unemployment | |
Average gross salary | €35,484 / $42,300 annually (2017)[17] |
Average net salary | €26,700 / $30,840 annually (2017)[18] |
Main industries | |
| External | |
| Exports | |
Export goods | machinery and equipment, aircraft, plastics, chemicals, pharmaceutical products, iron and steel, beverages |
Main export partners |
|
| Imports | |
Import goods | machinery and equipment, vehicles, crude oil, aircraft, plastics, chemicals |
Main import partners |
|
FDI stock | |
Gross external debt | $5.250 trillion (31 March 2017)[20] |
| Public finances | |
| Revenues | 52.6% of GDP (2019)[21] |
| Expenses | 55.6% of GDP (2019)[21] |
| Economic aid | donor: ODA, $9.50 billion (2016)[22] |
Foreign reserves | |
France has a diversified economy. The chemical industry is a key sector for France, helping to develop other manufacturing activities and contributing to economic growth.[28] France's tourism industry is a major component of the economy, as France is the most visited destination in the world.[29][30] Sophia Antipolis is the major technology hub for the economy of France. Paris is ranked as the most elegant city in the world, which propels the agglomeration of the fashion industry.[31] According to the IMF, in 2018, France was the world's 19th country by GDP per capita with $42,878 per inhabitant. In 2018, France was listed on the United Nations's Human Development Index with a value of 0.891 (indicating very high human development) and 21st on the Corruption Perceptions Index in 2018.[32][33] The OECD is headquartered in Paris, the nation's financial capital.
France's economy entered the recession of the late 2000s later and appeared to leave it earlier than most affected economies, only enduring four-quarters of contraction.[34] However, France experienced stagnant growth between 2012 and 2014, with the economy expanding by 0% in 2012, 0.8% in 2013 and 0.2% in 2014, though growth picked up in 2015 with a growth of 0.8% and a growth of 1.1% for 2016, to a growth of 2.2% for 2017 and to later reach 2.1% for 2018.[35] According to the OFCE, the expected 2019 growth rate is 1.3%[36].
Corporations
With 28 of the 500 biggest companies of the world in 2018, France ranks 5th in the Fortune Global 500, behind the USA, China, Japan and Germany
Several French corporations rank amongst the largest in their industries such as AXA in insurance and Air France in air transportation.[37] Luxury and consumer good are particularly relevant, with L'Oreal being the world's largest cosmetic company while LVMH and Kering are the world's two largest luxury product companies. In energy and utilities, GDF-Suez and EDF are amongst the largest energy companies in the world, and Areva is a large nuclear-energy company; Veolia Environnement is the world's largest environmental services and water management company; Vinci SA, Bouygues and Eiffage are large construction companies; Michelin ranks in the top 3 tire manufacturers; JCDecaux is the world's largest outdoor advertising corporation; BNP Paribas, Credit Agricole and Société Générale rank amongst the largest in the world by assets.
Carrefour is the world's second largest retail group in terms of revenue; Total is the world's fourth largest private oil company; Danone is the world's fifth largest food company and the world's largest supplier of mineral water; Sanofi Aventis is the world's fifth largest pharmaceutical company; Publicis is the world's third largest advertising company; PSA is the world's 6th and Europe's 2nd largest automaker; Accor is the leading European hotel group; Alstom is one of the world's leading conglomerates in rail transport.
Rise and decline of dirigisme
France embarked on an ambitious and very successful program of modernization under state coordination. This programm of dirigisme, mostly implemented by governments between 1944 and 1983, involved the state control of certain industries such as transportation, energy and telecommunications as well as various incentives for private corporations to merge or engage in certain projects.
The 1981 election of president François Mitterrand saw a short-lived increase in governmental control of the economy, nationalizing many industries and private banks. This form of increased dirigisme, was criticized as early as 1982. By 1983, the government decided to renounce dirigisme and start an era of rigueur ("rigor") or corporation. As a result, the government largely retreated from economic intervention; dirigisme has now essentially receded, though some of its traits remain. The French economy grew and changed under government direction and planning much more than in other European countries.
Despite being a widely liberalized economy, the government continues to play a significant role in the economy: government spending, at 56% of GDP in 2014, is the second highest in the European Union. Labor conditions and wages are highly regulated. The government continues to own shares in corporations in several sectors, including energy production and distribution, automobiles, transportation, and telecommunications. However these shareholdings are being rapidly sold, the state keeping mostly symbolic stakes in those companies (aside rail transportation and energy).
Government finance
In April and May 2012, France held a presidential election in which the winner François Hollande had opposed austerity measures, promising to eliminate France's budget deficit by 2017. The new government stated that it aimed to cancel recently enacted tax cuts and exemptions for the wealthy, raising the top tax bracket rate to 75% on incomes over a million euros, restoring the retirement age to 60 with a full pension for those who have worked 42 years, restoring 60,000 jobs recently cut from public education, regulating rent increases; and building additional public housing for the poor.
In June 2012, Hollande's Socialist Party won an overall majority in the legislative elections, giving it the capability to amend the French Constitution and allowing immediate enactment of the promised reforms. French government bond interest rates fell 30% to record lows,[38] less than 50 basis points above German government bond rates.[39]
National debt
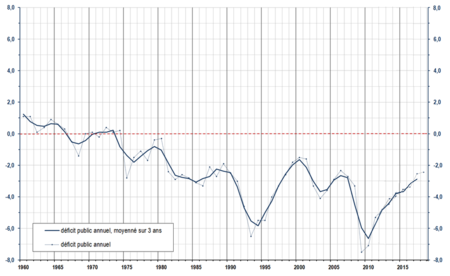
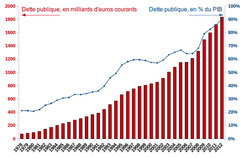
The Government of France has run a budget deficit each year since the early 1970s. As of 2019, French government debt reached €2,331 billion an equivalent of 99.2% of French GDP.[40]
Under European Union rules, member states are supposed to limit their debt to 60% of output or be reducing the ratio structurally towards this ceiling, and run public deficits of no more than 3.0% of GDP.[41]
In late 2012, credit-rating agencies warned that growing French government debt levels risked France's AAA credit rating, raising the possibility of a future credit downgrade and subsequent higher borrowing costs for the French government.[42] In 2012 France was downgraded by ratings agencies Moody's, Standard&Poor's, and Fitch to the AA+ credit rating.[43][44]
In December 2014 France's credit rating was further downgraded by Fitch (and S&P) to the AA credit rating.[45]
Data
The following table shows the main economic indicators in 1980–2018.Inflation below 2% is in green.[46]
| Year | GDP (in bil. Euro) |
GDP per capita (in Euro) |
GDP growth (real) |
Inflation rate (in Percent) |
Unemployment (in Percent) |
Budget balance (in % of GDP) |
|---|---|---|---|---|---|---|
| 1980 | 453.2 | 13.1 % | 6.2 % | |||
| 1981 | ||||||
| 1982 | ||||||
| 1983 | ||||||
| 1984 | ||||||
| 1985 | ||||||
| 1986 | ||||||
| 1987 | ||||||
| 1988 | ||||||
| 1989 | ||||||
| 1990 | ||||||
| 1991 | ||||||
| 1992 | ||||||
| 1993 | ||||||
| 1994 | ||||||
| 1995 | ||||||
| 1996 | ||||||
| 1997 | ||||||
| 1998 | ||||||
| 1999 | ||||||
| 2000 | ||||||
| 2001 | ||||||
| 2002 | ||||||
| 2003 | ||||||
| 2004 | ||||||
| 2005 | ||||||
| 2006 | ||||||
| 2007 | ||||||
| 2008 | ||||||
| 2009 | ||||||
| 2010 | ||||||
| 2011 | ||||||
| 2012 | ||||||
| 2013 | ||||||
| 2014 | ||||||
| 2015 | ||||||
| 2016 | ||||||
| 2017 | ||||||
| 2018 |
Economic sectors
Industry
2006 electricity production of France

The leading industrial sectors in France are telecommunications (including communication satellites), aerospace and defense, ship building (naval and specialist ships), pharmaceuticals, construction and civil engineering, chemicals, textiles, and automobile production.
Research and development spending is also high in France at 2.26% of GDP, the fourth-highest in the OECD.[47]
Energy
France is the world-leading country in nuclear energy, home of global energy giants Areva, EDF and GDF Suez: nuclear power now accounts for about 78% of the country's electricity production, up from only 8% in 1973, 24% in 1980, and 75% in 1990. Nuclear waste is stored on site at reprocessing facilities. Due to its heavy investment in nuclear power, France is the smallest emitter of carbon dioxide among the seven most industrialized countries in the world.[48]
In 2006 electricity generated in France amounted to 548.8 TWh, of which:[49]
- 428.7 TWh (78.1%) were produced by nuclear power generation
- 60.9 TWh (11.1%) were produced by hydroelectric power generation
- 52.4 TWh (9.5%) were produced by fossil-fuel power generation
- 21.6 TWh (3.9%) by coal power
- 20.9 TWh (3.8%) by natural-gas power
- 9.9 TWh (1.8%) by other fossil fuel generation (fuel oil and gases by-products of industry such as blast furnace gases)
- 6.9 TWh (1.3%) were produced by other types of power generation (essentially waste-to-energy and wind turbines)
- The electricity produced by wind turbines increased from 0.596 TWh in 2004, to 0.963 TWh in 2005, and 2.15 TWh in 2006, but this still accounts only for 0.4% of the total production of electricity (as of 2006).
In November 2004, EDF (which stands for Electricité de France), the world's largest utility company and France's largest electricity provider, was floated with huge success on the French stock market. Notwithstanding, the French state still retains 70% of the capital.
Other electricity providers include Compagnie nationale du Rhône (CNR) and Endesa (through SNET).
Agriculture
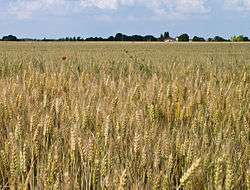
France is the world's sixth largest agricultural producer and EU's leading agricultural power, accounting for about one-third of all agricultural land within the EU. In the early 1980's, France was the leading producer of the three principal grains of wheat, barley, and maize. Back in 1983, France produced around 24.8 million tonnes, which was a long way ahead of the United Kingdom and West Germany, the next two largest wheat producers.[50]
Northern France is characterized by large wheat farms. Dairy products, pork, poultry, and apple production are concentrated in the western region. Beef production is located in central France, while the production of fruits, vegetables, and wine ranges from central to southern France. France is a large producer of many agricultural products and is currently expanding its forestry and fishery industries. The implementation of the Common Agricultural Policy (CAP) and the Uruguay Round of the General Agreement on Tariffs and Trade (GATT) have resulted in reforms in the agricultural sector of the economy.
As the world's second-largest agricultural exporter, France ranks just after the United States.[51] The destination of 49% of its exports is other EU members states. France also provides agricultural exports to many poor African countries (including its former colonies) which face serious food shortages. Wheat, beef, pork, poultry, and dairy products are the principal exports.
Exports from the United States face stiff competition from domestic production, other EU member states, and third-world countries in France. US agricultural exports to France, totaling some $600 million annually, consist primarily of soybeans and soybean products, feeds and fodders, seafood, and consumer products, especially snack foods and nuts. French exports to the United States are much more high-value products such as its cheese, processed products and its wine.
The French agricultural sector receives almost €11 billion in EU subsidies. France's competitive advantage is mostly linked to the high quality and global renown of its produce, such as cheese and wine.
Tourism

France is the world's most popular tourist destination with more than 83.7 million foreign tourists in 2014, ahead of Spain (58.5 million in 2006) and the United States (51.1 million in 2006). This figure excludes people staying less than 24 hours in France, such as northern Europeans crossing France on their way to Spain or Italy during the summer.
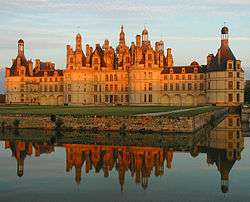
France is home to cities of much cultural interest (Paris being the foremost), beaches and seaside resorts, ski resorts, and rural regions that many enjoy for their beauty and tranquillity. France also attracts many religious pilgrims to Lourdes, a town in the Hautes-Pyrénées département, which hosts several million visitors a year.
According to figures from 2003, some popular tourist sites include (in visitors per year):[52] Eiffel Tower (6.2 million), Louvre Museum (5.7 million), Palace of Versailles (2.8 million), Cité des Sciences et de l'Industrie (2.6 million), Musée d'Orsay (2.1 million), Arc de Triomphe (1.2 million), Centre Pompidou (1.2 million), Mont-Saint-Michel (1 million), Château de Chambord (711,000), Sainte-Chapelle (683,000), Château du Haut-Kœnigsbourg (549,000), Puy de Dôme (500,000), Musée Picasso (441,000), Carcassonne (362,000). However, the most popular site in France is Disneyland Paris, with 9.7 million visitors in 2017 [53]
Arms industry

The French arms industry's main customer, for whom they mainly build warships, guns, nuclear weapons and equipment, is the French government.
Record high defence expenditure (currently at €35 billion), which was considerably increased under the government of Prime Minister Jean-Pierre Raffarin, goes largely to the French arms industries.
During the 2000–2015 period, France was the fourth largest weapons exporter in the world[54][55]
French manufacturers export great quantities of weaponry to Saudi Arabia, the United Arab Emirates, Brazil, Greece, India, Pakistan, Taiwan, Singapore and many others.
It was reported that in 2015, French arms sales internationally amounted to 17.4 billion U.S. dollars,[56] more than double the figure of 2014.[57] Vice News explained that "While the United Kingdom has lapsed somewhat in this regard, France has maintained a high-level of production of military equipment for land, air, and sea defense – an expensive approach that relies on the export of arms and technology."[58]
Transport

Transportation in France relies on one of the densest networks in the world with 146 km of road and 6.2 km of rail lines per 100 km2. It is built as a web with Paris at its center.[59] The highly subsidised rail transport network makes up a relatively small portion of travel, most of which is done by car. However the high-speed TGV trains make up a large proportion of long-distance travel, partially because intercity buses were prevented from operating until 2015.
France also boasts a number of seaports and harbours, including Bayonne, Bordeaux, Boulogne-sur-Mer, Brest, Calais, Cherbourg-Octeville, Dunkerque, Fos-sur-Mer, La Pallice, Le Havre, Lorient, Marseille, Nantes, Nice, Paris, Port-la-Nouvelle, Port-Vendres, Roscoff, Rouen, Saint-Nazaire, Saint-Malo, Sète, Strasbourg and Toulon. There are approximately 470 airports in France and by a 2005 estimate, there are three heliports. 288 of the airports have paved runways, with the remaining 199 being unpaved. The national carrier of France is Air France, a full service global airline which flies to 20 domestic destinations and 150 international destinations in 83 countries (including Overseas France) across all 6 major continents.
Labour market
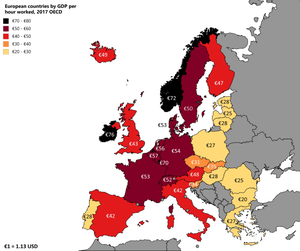
According to a 2011 report by the American Bureau of Labor Statistics (BLS), France's GDP per capita at purchasing power parity is similar to that of the UK, with just over US$35,000 per head.[60] To explain why French per capita GDP is lower than that of the United States, the economist Paul Krugman stated that "French workers are roughly as productive as US workers", but that the French have allegedly a lower workforce participation rate and "when they work, they work fewer hours". According to Krugman, the difference is due to the French making "different choices about retirement and leisure".[61]
Keynesian economists sought out different solutions to the unemployment issue in France, and their theories led to the introduction of the 35-hour workweek law in 1999. Between 2004 and 2008, the government attempted to combat unemployment with supply-side reforms, but was met with fierce resistance;[63] the contrat nouvelle embauche and the contrat première embauche (which allowed more flexible contracts) were of particular concern, and both were eventually repealed.[64] The Sarkozy government used the revenu de solidarité active (in-work benefits) to redress the allegedly negative effect of the revenu minimum d'insertion (unemployment benefits which do not depend on previous contributions, unlike normal unemployment benefits in France) on the incentive to accept even jobs which are insufficient to earn a living.[65]
French employment rates for 15–64 years is one of the lowest of the OECD countries: in 2012, only 71% of the French population aged 15–64 years were in employment, compared to 74% in Japan, 77% in the UK, 73% in the US and 77% in Germany.[66] This gap is due to the low employment rate for 15–24 years old: 38% in 2012, compared to 47% in the OECD. Neoliberal economists attribute the low employment rate, particularly evident among young people, to allegedly high minimum wages that would prevent low productivity workers from easily entering the labour market.[67]
A December 2012 New York Times article reported on an allegedly "floating generation" in France that formed part of the 14 million unemployed young Europeans documented by the Eurofound research agency.[68] In the same article, Anne Sonnet, a senior economist studying unemployment at the OECD claimed that nearly two million young people in France had given up looking for employment at that time, while French labour minister Michel Sapin said that 82 percent of people hired were only on temporary contracts. Sapin further explained that, in his opinion, the challenge at that time was to create a more flexible system, in which greater trust existed between unions and companies, and "partial unemployment" was accommodated during difficult periods. The so-called floating generation was attributed to an allegedly dysfunctional system: "an elitist educational tradition that does not integrate graduates into the work force, a rigid labour market that is hard to enter for newcomers, and a tax system that makes it expensive for companies to hire full-time employees and both difficult and expensive to lay them off".[69] In July 2013, the unemployment rate for France was 11%.[70]
In early April 2014, employers' federations and unions negotiated an agreement with technology and consultancy employers, as employees had been experiencing an extension of their work time through smartphone communication outside of official working hours. Under a new, legally binding labour agreement, around 250,000 employees will avoid handling work-related matters during their leisure time and their employers will, in turn, refrain from engaging with staff during this time.[71]
Everyday, about 80,000 French citizens are commuting to work in neighbouring Luxembourg, making it the biggest cross-border workforce group in the whole of the European Union.[72] They are attracted by much higher wages for the different job groups than in their own country and the lack of skilled labour in the booming Luxembourgish economy.
External trade
France is the second-largest trading nation in Europe (after Germany).[73] Its foreign trade balance for goods had been in surplus from 1992 until 2001, reaching $25.4 billion (25.4 G$) in 1998; however, the French balance of trade was hit by the economic downturn, and went into the red in 2000, reaching a US$15bn deficit in 2003. Total trade for 1998 amounted to $730 billion, or 50% of GDP—imports plus exports of goods and services. Trade with European Union countries accounts for 60% of French trade.
In 1998, US–France trade stood at about $47 billion – goods only. According to French trade data, US exports accounted for 8.7% – about $25 billion – of France's total imports. US industrial chemicals, aircraft and engines, electronic components, telecommunications, computer software, computers and peripherals, analytical and scientific instrumentation, medical instruments and supplies, broadcasting equipment, and programming and franchising are particularly attractive to French importers.
The principal French exports to the US are aircraft and engines, beverages, electrical equipment, chemicals, cosmetics, luxury products and perfume. France is the ninth-largest trading partner of the US.
|
|
| Rank | Country[74] | Total Trade (2016) |
|---|---|---|
| 1. | 169.9 | |
| 2. | 79.0 | |
| 3. | 78.3 | |
| 4. | 78.3 | |
| 5. | 71.7 | |
| 6. | 66.5 | |
| 7. | 57.7 | |
| 8. | 43.2 | |
| 9. | 32.0 | |
| 10. | 19.0 | |
Régions economy
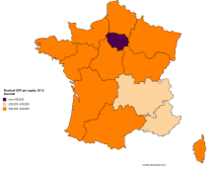
The economic disparity between French regions is not as high as that in other European countries such as the UK, Italy or Germany, and higher than in countries like Sweden or Denmark, or even Spain. However, Europe's wealthiest and second largest regional economy, Ile-de-France (the region surrounding Paris), has long profited from the capital city's economic hegemony.
The most important régions are Île-de-France (world's 4th and Europe 2nd wealthiest and largest regional economy), Rhône-Alpes (Europe's 5th largest regional economy thanks to its services, high-technologies, chemical industries, wines, tourism), Provence-Alpes-Côte d'Azur (services, industry, tourism and wines), Nord-Pas-de-Calais (European transport hub, services, industries) and Pays de la Loire (green technologies, tourism). Regions like Alsace, which has a rich past in industry (machine tool) and currently stands as a high income service-specialized region, are very wealthy without ranking very high in absolute terms.
The rural areas are mainly in Auvergne, Limousin, and Centre-Val de Loire, and wine production accounts for a significant proportion of the economy in Aquitaine (Bordeaux (or claret)), Burgundy, and champagne produced in Champagne-Ardennes.

| Rank | Region | GDP (in million euros, 2009) | GDP per capita (euros, 2009) | GDP (in million US Dollars, 2009) | GDP per capita (US Dollars, 2009) |
|---|---|---|---|---|---|
| 1 | Île-de-France | 552,052 | 51,101 | 769,705 | 69,973 |
| 2 | Rhône-Alpes | 181,810 | 29,420 | 253,491 | 41,019 |
| 3 | Provence-Alpes-Côte d'Azur | 138,002 | 27,855 | 192,411 | 38,837 |
| 4 | Nord-Pas de Calais | 96,839 | 24,025 | 135,019 | 33,497 |
| 5 | Pays de la Loire | 94,032 | 26,481 | 131,105 | 36,921 |
| 6 | Aquitaine | 85,693 | 26,710 | 119,478 | 37,241 |
| 7 | Brittany | 81,632 | 25,739 | 113,816 | 35,887 |
| 8 | Midi-Pyrénées | 76,522 | 26,628 | 106,692 | 37,126 |
| 9 | Centre-Val de Loire | 65,173 | 25,571 | 90,868 | 35,653 |
| 10 | Languedoc-Roussillon | 60,523 | 22,984 | 84,385 | 32,046 |
| 11 | Lorraine | 55,396 | 23,653 | 77,237 | 32,978 |
| 12 | Alsace | 50,701 | 27,322 | 70,690 | 38,094 |
| 13 | Upper Normandy | 48,555 | 26,599 | 67,698 | 37,086 |
| 14 | Picardy | 43,725 | 22,894 | 60,964 | 31,920 |
| 15 | Poitou-Charentes | 42,379 | 24,046 | 59,087 | 33,526 |
| 16 | Burgundy | 41,805 | 25,516 | 58,287 | 35,576 |
| 17 | Champagne-Ardenne | 35,779 | 26,768 | 49,885 | 37,322 |
| 18 | Lower Normandy | 34,869 | 23,737 | 48,617 | 33,096 |
| 19 | Auvergne | 33,174 | 24,680 | 46,253 | 34,410 |
| 20 | Franche-Comté | 28,083 | 24,042 | 39,155 | 33,521 |
| 21 | Limousin | 17,509 | 23,637 | 24,412 | 32,956 |
| 22 | Corsica | 7,279 | 23,800 | 10,149 | 33,183 |
Source : INSEE. Source : fxtop.com.
Departments economy and cities
Departmental income inequalities

In terms of income, important inequalities can be observed among the French départements.
According to the 2008 statistics of the INSEE, the Yvelines is the highest income department of the country with an average income of €4,750 per month. Hauts-de-Seine comes second, Essonne third, Paris fourth, Seine-et Marne fifth. Île-de-France is the wealthiest region in the country with an average income of €4,228 per month (and is also the wealthiest region in Europe) compared to €3,081 at the national level. Alsace comes second, Rhône-Alpes third, Picardy fourth, and Upper Normandy fifth.
The poorest parts of France are the French overseas departments, French Guiana being the poorest department with an average household income of €1,826. In Metropolitan France it is Creuse in the Limousin region which comes bottom of the list with an average household income of €1,849 per month.[75]
Urban income inequalities
Huge inequalities can also be found among cities. In the Paris metropolitan area, significant differences exist between the higher standard of living of Paris Ouest and lower standard of living in areas in the northern banlieues of Paris such as Seine-Saint-Denis.
For cities of over 50,000 inhabitants, Neuilly-sur-Seine, a western suburb of Paris, is the wealthiest city in France with an average household income of €5,939, and 35% earning more than €8,000 per month.[76] But within Paris, four arrondissements surpass wealthy Neuilly-sur-Seine in household income: the 6th, the 7th, the 8th and the 16th; the 8th "arrondissement" being the wealthiest district in France (the other three following it closely as 2nd, 3rd and 4th wealthiest ones).
Wealth
Overview
In 2010, the French had an estimated wealth of US$14.0 trillion for a population of 63 million.[77]
- In terms of aggregate wealth, the French are the wealthiest Europeans, accounting for more than a quarter of wealthiest European households.[78] Globally, the French nation ranks fourth-wealthiest.[79][80]
- In 2010, wealth per French adult was a little higher than $290,000, down from a pre-crisis high of $300,000 in 2007. According to this ratio, French are the wealthiest in Europe. The tax on wealth is paid by 1.1M of people in France, the payment of this tax starts when a €1.3M of assets is reached (there is a discount on the principal residence value).
- Almost every French household has at least $1,000 in assets.[81] Proportionally, there are twice as many French with assets of over $10,000 and four times as many French with assets of over $100,000 than the world average.[82]
- The French are also among the least indebted populations in the developed world with personal debt accounting for "little more than 10% of household assets".[83]
Millionaires
France has the third highest number of millionaires in Europe as of 2017. There were 1.617 million millionaire households (measured in terms of US dollars) living in France in 2017, behind the UK (2.225M) and Germany (1.637).[84]
The wealthiest man in France is the LVMH CEO and owner Bernard Arnault.
See also
- Economy of France in French Guiana, French Polynesia, Guadeloupe, Martinique, Mayotte, New Caledonia, Réunion, Saint Barthélemy, Saint Martin, Saint Pierre and Miquelon, Wallis and Futuna
- Taxation in France
- Economic history of France
- Economy of Paris
- Poverty in France
- General
Notes and references
- "World Economic Outlook Database, April 2019". IMF.org. International Monetary Fund. Retrieved 29 September 2019.
- "World Bank Country and Lending Groups". datahelpdesk.worldbank.org. World Bank. Retrieved 29 September 2019.
- "Population on 1 January". ec.europa.eu/eurostat. Eurostat. Retrieved 13 July 2020.
- "World Economic Outlook Database, October 2019". IMF.org. International Monetary Fund. Retrieved 15 October 2019.
- "World Economic Outlook Database, April 2020". IMF.org. International Monetary Fund. Retrieved 15 April 2020.
- "World Economic Outlook Update, June 2020". IMF.org. International Monetary Fund. Retrieved 10 August 2020.
- "The World Factbook". CIA.gov. Central Intelligence Agency. Retrieved 19 August 2019.
- "People at risk of poverty or social exclusion". ec.europa.eu/eurostat. Eurostat. Retrieved 15 October 2019.
- "Gini coefficient of equivalised disposable income - EU-SILC survey". ec.europa.eu/eurostat. Eurostat. Retrieved 15 October 2019.
- "Human Development Index (HDI)". hdr.undp.org. HDRO (Human Development Report Office) United Nations Development Programme. Retrieved 11 December 2019.
- "Inequality-adjusted HDI (IHDI)". hdr.undp.org. UNDP. Retrieved 2 July 2020.
- "Labor force, total - France". data.worldbank.org. World Bank. Retrieved 1 November 2019.
- "Employment rate by sex, age group 20-64". ec.europa.eu/eurostat. Eurostat. Retrieved 1 November 2019.
- "Unemployment by sex and age - monthly average". appsso.eurostat.ec.europa.eu. Eurostat. Retrieved 2 July 2020.
- "The unemployment rate fell from 8.5 % to 8.1 % in Q4 2019". insee.fr. Institut national de la statistique et des études économiques. Retrieved 17 February 2020.
- "Youth unemployment rate". data.oecd.org. OECD. Retrieved 1 April 2020.
- "Average wage in France: net, gross, by sex, by CSP". Journaldunet.com. Retrieved 18 July 2017.
- "Salary after Tax Calculator - France (FR)". Salaryaftertax.com. Retrieved 27 March 2017.
- "Ease of Doing Business in France". Doingbusiness.org. Retrieved 21 November 2017.
- "Banque de France". Retrieved 9 July 2017.
- "Euro area and EU27 government deficit both at 0.6% of GDP" (PDF). ec.europa.eu/eurostat. Eurostat. Retrieved 28 April 2020.
- "Development aid rises again in 2016 but flows to poorest countries dip". OECD. 11 April 2017. Retrieved 25 September 2017.
- "Sovereign Ratings List". Standard & Poor's. 6 January 2017. Retrieved 6 June 2015. Note: this source is continually updated.
- "Moody's downgrades France's government bond ratings to Aa2 from Aa1; outlook changed to stable from negative". Moody's Investors Service. 18 September 2015. Archived from the original on 21 September 2015. Retrieved 23 September 2017.
- "France's credit downgraded to AA at Fitch Ratings - MarketWatch". Retrieved 12 December 2014.
- Prasad, Monica (2006). The Politics of Free Markets: The Rise of Neoliberal Economic Policies in Britain, France, Germany, and the United States. University of Chicago Press. p. 328. ISBN 9780226679020.
- "GDP ranking | Data". imf.org. Retrieved 20 December 2017.
- "Chemical industry" (PDF). Archived from the original (PDF) on 20 August 2010.
- "Tourism industry sub-sectors: COUNTRY REPORT – FRANCE" (PDF). Archived from the original (PDF) on 17 February 2015.
- "UNWTO Tourism Highlights 2014 Edition" (PDF). 2014. Archived from the original (PDF) on 17 December 2014.
- https://m.zalando.co.uk/worlds-most-elegant-cities/?awc=3356_1518352180_83f935be011f295b546745584c1ce5b7&wmc=AFF44_AW_EN.78888_..&opc=2211
- "Human Development Index 2018 Statistical Update". hdr.undp.org. United Nations Development Programme. Retrieved 10 July 2019.
- "Corruption Perceptions Index 2018 Executive summary p. 2" (PDF). transparency.org. Transparency International. Retrieved 10 July 2019.
- "Germany, France pull out of recession". CNN. 13 August 2009.
- "5. Report for Selected Countries and Subjects". International Monetary Fund.
- fr:Observatoire français des conjonctures économiques
- "Global 2000 Leading Companies". Forbes. May 2015.
- Bloomberg (2012) French government bond interest rates (graph)
- Bloomberg (2012) German government bond interest rates (graph)
- "World Economic Outlook (April 2019) - General government gross debt". imf.org. Retrieved 23 September 2019.
- "French debt jumps, minister promises to meet deficit target". FRANCE 24. 28 September 2012. Retrieved 27 November 2012.
- John, Mark (26 October 2012). "Analysis: Low French borrowing costs risk negative reappraisal". Reuters. Retrieved 27 November 2012.
- "France loses AAA rating as euro governments downgraded". BBC News. 13 January 2012.
- Deen, Mark (12 July 2013). "France Loses Top Credit Rating as Fitch Cites Lack of Growth". Bloomberg.
- Deenpattern dots, Mark (12 December 2014). "France's Credit Rating Cut by Fitch to 'AA'; Outlook Stable". Bloomberg.com. Bloomberg. Retrieved 12 March 2015.
- "Report for Selected Countries and Subjects". www.imf.org. Retrieved 25 December 2019.
- "France in the United States: Economy". Embassy of France in Washington. Archived from the original on 9 October 2011. Retrieved 23 April 2010.
- "CO2 emissions per capita in 2006". Environmental Indicators: Greenhouse Gas Emissions. United Nations. August 2009.
- Source: L’Electricité en France en 2006 : une analyse statistique
- Ilbery, Brian (1986). Western Europe. New York, United States: Oxford University Press, New York. pp. Pg. 41-42. ISBN 0-19-823278-0.
- (in French) L'Agriculture en chiffres
- "Musées et Monuments historiques". Archived from the original on 24 December 2007.
- "Disneyland Park Paris attendance".
- SIPRI Arms Transfers Database, data 2000–10. Stockholm International Peace Research Institute
- Arms trade: One chart that shows the biggest weapons exporters of the last five years, The Independent
- France doubles arms sales in 2015, UPI.com
- Arms sales becoming France’s new El Dorado, but at what cost?, France24
- If the US Won't Sell You Weapons, France Might Still Hook You Up, Vice News
- Les grands secteurs économiques Ministère des Affaires étrangères Retrieved 4 November 2007
- "International Comparisons of GDP per Capita, and per Hour, 1960–2011" (PDF). Bureau of Labor Statistics. 7 November 2012. Retrieved 13 April 2014.
- Paul Krugman (28 January 2011). "GDP Per Capita, Here and There". The New York Times. Retrieved 13 April 2014.
- https://data.oecd.org/lprdty/gdp-per-hour-worked.htm#indicator-chart
- "More than 1 million protest French jobs law". CNN. Retrieved 21 July 2011.
- "Q&A: French labour law row". BBC News. 11 April 2006. Retrieved 21 July 2011.
- "Le Revenu de Solidarité active". Rsa.gouv.fr. Archived from the original on 17 July 2010. Retrieved 9 August 2010.
- Organisation for Economic Co-operation and Development (2012). "OECD Employment Outlook 2012 – Statistical Annex" (PDF). Retrieved 29 June 2013.
- Philippe Aghion; Cette, Gilbert; Cohen, Élie; Pisani-Ferry, Jean (2007). Les leviers de la croissance française (PDF) (in French). Paris: Conseil d'analyse économique. p. 55. ISBN 978-2-11-006946-7. Retrieved 1 September 2008.
- "Young, Educated and Jobless in France".
- Steven Erlanger; Maïa de la Baume; Stefania Rousselle (6 December 2012). "Young, Educated and Jobless in France". The New York Times. Retrieved 13 April 2014.
- "Harmonised unemployment rate by gender – total – % (SA)". Epp.eurostat.ec.europa.eu. 11 March 2011. Retrieved 21 July 2011.
- Lucy Mangan (9 April 2014). "When the French clock off at 6 pm, they really mean it". The Guardian. Retrieved 13 April 2014.
- "Foreign labour in 2014". Institut national de la statistique et des études économiques du Luxembourg. Retrieved 1 June 2015.
- "Leading exporters and importers in world merchandise trade, 2007". World Trade Organization. Retrieved 3 June 2009.
- (1) The Observatory of Economic Complexity (OEC)
- Archived 4 November 2011 at the Wayback Machine
- "Salaire moyen Neuilly-sur-Seine – 92200 (60501 habitants) : 4649 euros / mois par ménage – Tout savoir sur revenu moyen, salaire net, salaire brut et retraite par ville de France". Salairemoyen.com. Retrieved 27 November 2012.
- Credit Suisse 2010's Global Wealth Report, p. 32.
- "Europe as a whole accounts for 35% of the individuals in the global top 1% (of wealthiest households), but France itself contributes a quarter of the European contingent." 2010's Global Wealth Report
- Rankings: 1st: United States with $54.6 trillion for 318 million inhabitants; 2nd: Japan with $21 trillion for 127 million inhabitants; 3rd: China with $16.5 trillion for 1.331 billion inhabitants; 4th: France with $14.0 trillion for 63 million inhabitants.
- " Although it has just 1.1% of the world’s adults, France ranks fourth among nations in aggregate household wealth – behind China and just ahead of Germany". 2010's Global Wealth Report. "Archived copy" (PDF). Archived from the original (PDF) on 27 April 2011. Retrieved 4 March 2011.CS1 maint: archived copy as title (link)
- 2010's Global Wealth Report, p. 32: "Very few households in France are recorded as having less than US$1000 per adult".
- 2010's Global Wealth Report, p. 32: "The proportion with assets over $10,000 is double the world average, and the proportion with more than $100,000 is four times the global figure".
- 2010's Global Wealth Report.
- "The 18 countries with the most millionaires". Business Insider. Retrieved 19 December 2017.
External links
- National Institute of Statistics and Economic Studies - Insee
- Banque de France
- World Bank: France Trade Statistics
- France - OECD
- France profile at the CIA World Factbook
- France profile at The World Bank
| History |
|  | ||||
|---|---|---|---|---|---|---|
| Geography | ||||||
| Politics | ||||||
| Economy | ||||||
| Society |
| |||||
| ||||||
| Denmark | |
|---|---|
| France |
|
| Netherlands | |