Economy of Canada
The economy of Canada is a highly developed market economy.[26] It is the 10th largest GDP by nominal and 16th largest GDP by PPP in the world. As with other developed nations, the country's economy is dominated by the service industry which employs about three quarters of Canadians.[27] Canada has the third highest total estimated value of natural resources, valued at US$33.2 trillion in 2019.[28] It has the world's third largest proven petroleum reserves and is the fourth largest exporter of petroleum. It is also the fourth largest exporter of natural gas. Canada is considered an "energy superpower" due to its abundant natural resources and a small population of 37 million inhabitants relative to its land area.[29][30][31]
.jpg) Toronto, the financial centre of Canada | |
| Currency | Canadian dollar (CAD, C$) |
|---|---|
| 1 April – 29 March | |
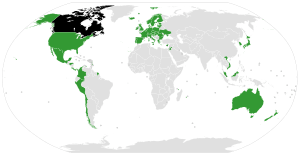
Trade organizations | CPTPP, NAFTA, OECD, WTO and others |
Country group | |
| Statistics | |
| Population | |
| GDP | |
| GDP rank | |
GDP growth |
|
GDP per capita | |
GDP per capita rank | |
GDP by sector |
|
| 0.6% (2020 est.)[5] | |
Population below poverty line | 9.4% (2008 est.)[7][note 1] |
Labour force | |
| Unemployment | |
Average gross salary | $1,042 weekly (September 2019)[13] |
Main industries |
|
| External | |
| Exports | |
Export goods | motor vehicles and parts, industrial machinery, aircraft, telecommunications equipment; chemicals, plastics, fertilizers; wood pulp, timber, crude petroleum, natural gas, electricity, aluminum |
Main export partners |
|
| Imports | |
Import goods | machinery and equipment, motor vehicles and parts, crude oil, chemicals, electricity, durable consumer goods |
Main import partners |
|
FDI stock | |
| $−17.3 billion (Q1 2019)[18] | |
Gross external debt | $1.791 trillion (31 March 2017)[19] |
| Public finances | |
| −1% (of GDP) (2017 est.)[7] | |
| Revenues | 649.6 billion (2017 est.)[7] |
| Expenses | 665.7 billion (2017 est.)[7] |
| Economic aid | donor: ODA, $3.96 billion (2016)[20] |
Foreign reserves | $86.3 billion (June 2019)[24][25] |
According to the Corruption Perceptions Index, Canada is one of the least corrupt countries in the world,[32] and is one of the world's top ten trading nations, with a highly globalized economy.[33][34] Canada historically ranks above the U.S. and most western European nations on The Heritage Foundation's index of economic freedom,[35] and experiencing a relatively low level of income disparity.[36] The country's average household disposable income per capita is "well above" the OECD average.[37] The Toronto Stock Exchange is the ninth-largest stock exchange in the world by market capitalization, listing over 1,500 companies with a combined market capitalization of over US$2 trillion.[38]
In 2018, Canadian trade in goods and services reached CA$1.5 trillion.[15] Canada's exports totalled over CA$585 billion, while its imported goods were worth over CA$607 billion, of which approximately CA$391 billion originated from the United States, CA$216 billion from non-U.S. sources.[15] In 2018, Canada had a trade deficit in goods of CA$22 billion and a trade deficit in services of CA$25 billion.[15]
Canada is unusual among developed countries in the importance of the primary sector, with the logging and oil industries being two of Canada's most important. Canada also has a sizable manufacturing sector, based in Central Canada, with the automobile industry and aircraft industry being especially important. With the world's longest coastline, Canada has the 8th largest commercial fishing and seafood industry in the world.[39][40] Canada is one of the global leaders of the entertainment software industry.[41] It is a member of the APEC, NAFTA, G7, G20, OECD and WTO.
Overview
| Part of a series on the |
| Economy of Canada |
|---|
| Economic history of Canada |
| Sectors |
|
| Economy by province |
| Economy by city |
With the exception of a few island nations in the Caribbean, Canada is the only major parliamentary system in North America. As a result, Canada has developed its own social and political institutions, distinct from most other countries in the world.[42] Though the Canadian economy is closely integrated with the American economy, it has developed unique economic institutions.
The Canadian economic system generally combines elements of private enterprise and public enterprise. Many aspects of public enterprise, most notably the development of an extensive social welfare system to redress social and economic inequities, were adopted after the end of World War II in 1945.[42]
Canada has a private to public (Crown) property ratio of 60:40 and one of the highest levels of economic freedom in the world. Today Canada closely resembles the U.S. in its market-oriented economic system and pattern of production.[43] As of 2019, Canada has 56 companies in the Forbes Global 2000 list, ranking ninth just behind South Korea and ahead of Saudi Arabia.[44]
International trade makes up a large part of the Canadian economy, particularly of its natural resources. In 2009, agriculture, energy, forestry and mining exports accounted for about 58% of Canada's total exports.[45] Machinery, equipment, automotive products and other manufactures accounted for a further 38% of exports in 2009.[45] In 2009, exports accounted for about 30% of Canada's GDP. The United States is by far its largest trading partner, accounting for about 73% of exports and 63% of imports as of 2009.[46] Canada's combined exports and imports ranked 8th among all nations in 2006.[47]
About 4% of Canadians are directly employed in primary resource fields, and they account for 6.2% of GDP.[48] They are still paramount in many parts of the country. Many, if not most, towns in northern Canada, where agriculture is difficult, exist because of a nearby mine or source of timber. Canada is a world leader in the production of many natural resources such as gold, nickel, uranium, diamonds, lead, and in recent years, crude petroleum, which, with the world's second-largest oil reserves, is taking an increasingly prominent position in natural resources extraction. Several of Canada's largest companies are based in natural resource industries, such as Encana, Cameco, Goldcorp, and Barrick Gold. The vast majority of these products are exported, mainly to the United States. There are also many secondary and service industries that are directly linked to primary ones. For instance one of Canada's largest manufacturing industries is the pulp and paper sector, which is directly linked to the logging business.
The reliance on natural resources has several effects on the Canadian economy and Canadian society. While manufacturing and service industries are easy to standardize, natural resources vary greatly by region. This ensures that differing economic structures developed in each region of Canada, contributing to Canada's strong regionalism. At the same time the vast majority of these resources are exported, integrating Canada closely into the international economy. Howlett and Ramesh argue that the inherent instability of such industries also contributes to greater government intervention in the economy, to reduce the social impact of market changes.[49]
Natural resource industries also raise important questions of sustainability. Despite many decades as a leading producer, there is little risk of depletion. Large discoveries continue to be made, such as the massive nickel find at Voisey's Bay. Moreover, the far north remains largely undeveloped as producers await higher prices or new technologies as many operations in this region are not yet cost effective. In recent decades Canadians have become less willing to accept the environmental destruction associated with exploiting natural resources. High wages and Aboriginal land claims have also curbed expansion. Instead many Canadian companies have focused their exploration, exploitation and expansion activities overseas where prices are lower and governments more amenable. Canadian companies are increasingly playing important roles in Latin America, Southeast Asia, and Africa.
The depletion of renewable resources has raised concerns in recent years. After decades of escalating overutilization the cod fishery all but collapsed in the 1990s, and the Pacific salmon industry also suffered greatly. The logging industry, after many years of activism, has in recent years moved to a more sustainable model, or to other countries.
Data
The following table shows the main economic indicators in 1980–2018. Inflation under 2 % is in green.[50]
| Year | GDP (in bn. US$ PPP) |
GDP per capita (in US$ PPP) |
GDP growth (real) |
Inflation rate (in Percent) |
Unemployment (in Percent) |
Government debt (in % of GDP) |
|---|---|---|---|---|---|---|
| 1980 | 287.3 | 11,739 | 7.5 % | 45.1 % | ||
| 1981 | ||||||
| 1982 | ||||||
| 1983 | ||||||
| 1984 | ||||||
| 1985 | ||||||
| 1986 | ||||||
| 1987 | ||||||
| 1988 | ||||||
| 1989 | ||||||
| 1990 | ||||||
| 1991 | ||||||
| 1992 | ||||||
| 1993 | ||||||
| 1994 | ||||||
| 1995 | ||||||
| 1996 | ||||||
| 1997 | ||||||
| 1998 | ||||||
| 1999 | ||||||
| 2000 | ||||||
| 2001 | ||||||
| 2002 | ||||||
| 2003 | ||||||
| 2004 | ||||||
| 2005 | ||||||
| 2006 | ||||||
| 2007 | ||||||
| 2008 | ||||||
| 2009 | ||||||
| 2010 | ||||||
| 2011 | ||||||
| 2012 | ||||||
| 2013 | ||||||
| 2014 | ||||||
| 2015 | ||||||
| 2016 | ||||||
| 2017 | ||||||
| 2018[51] |
Unemployment rate
| Province | Unemployment rate percentage of labour force as of March 2020[52] |
|---|---|
| 8.7 | |
| 7.2 | |
| 6.4 | |
| 11.7 | |
| 8.8 | |
| 9.0 | |
| 7.6 | |
| 8.6 | |
| 8.1 | |
| 7.3 | |
| 7.8 |
Export trade
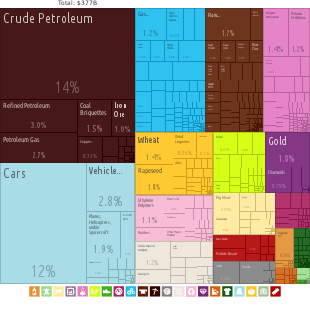
Export trade from Canada measured in US dollars. In 2018, Canada exported over US$450 billion.[53]
| Partner | Value | Fraction |
|---|---|---|
| United States | $338.2 billion | 75.0% |
| China | $21.3 billion | 4.7% |
| United Kingdom | $12.6 billion | 2.8% |
| Japan | $10.0 billion | 2.2% |
| Mexico | $6.3 billion | 1.4% |
| South Korea | $4.5 billion | 1.0% |
| Germany | $3.7 billion | 0.8% |
| Netherlands | $3.7 billion | 0.8% |
| India | $3.3 billion | 0.7% |
| Hong Kong | $3.0 billion | 0.7% |
| Belgium | $2.9 billion | 0.6% |
| France | $2.7 billion | 0.6% |
| Italy | $2.3 billion | 0.5% |
| Norway | $1.9 billion | 0.4% |
| Brazil | $1.7 billion | 0.4% |
Import trade
Import trade in 2017 measured in US dollars.[54]
| Partner | Value | Fraction |
|---|---|---|
| United States | $222.0 billion | 51.3% |
| China | $54.7 billion | 12.7% |
| Mexico | $27.4 billion | 6.3% |
| Germany | $13.8 billion | 3.2% |
| Japan | $13.5 billion | 3.1% |
| United Kingdom | $6.9 billion | 1.6% |
| South Korea | $6.7 billion | 1.5% |
| Italy | $6.3 billion | 1.5% |
| France | $4.8 billion | 1.1% |
| Vietnam | $3.9 billion | 0.9% |
Measuring productivity
Productivity measures are key indicators of economic performance and a key source of economic growth and competitiveness. The Organisation for Economic Co-operation and Development (OECD)'s[notes 1] Compendium of Productivity Indicators,[55] published annually, presents a broad overview of productivity levels and growth in member nations, highlighting key measurement issues. It analyses the role of "productivity as the main driver of economic growth and convergence" and the "contributions of labour, capital and MFP in driving economic growth".[55] According to the definition above "MFP is often interpreted as the contribution to economic growth made by factors such as technical and organisational innovation" (OECD 2008,11). Measures of productivity include Gross Domestic Product (GDP)(OECD 2008,11) and multifactor productivity.
Multifactor productivity
Another productivity measure, used by the OECD, is the long-term trend in multifactor productivity (MFP) also known as total factor productivity (TFP). This indicator assesses an economy's "underlying productive capacity ('potential output'), itself an important measure of the growth possibilities of economies and of inflationary pressures". MFP measures the residual growth that cannot be explained by the rate of change in the services of labour, capital and intermediate outputs, and is often interpreted as the contribution to economic growth made by factors such as technical and organisational innovation. (OECD 2008,11)
According to the OECD's annual economic survey of Canada in June 2012, Canada has experienced weak growth of multi-factor productivity (MFP) and has been declining further since 2002. One of the ways MFP growth is raised is by boosting innovation and Canada's innovation indicators such as business R&D and patenting rates were poor. Raising MFP growth is "needed to sustain rising living standards, especially as the population ages".[56]
Bank of Canada
The mandate of the central bank—the Bank of Canada is to conduct monetary policy that "preserves the value of money by keeping inflation low and stable".[57][58]
Monetary Policy Report
The Bank of Canada issues its bank rate announcement through its Monetary Policy Report which is released eight times a year.[58] The Bank of Canada, a federal crown corporation, has the responsibility of Canada's monetary system.[59] Under the inflation-targeting monetary policy that has been the cornerstone of Canada's monetary and fiscal policy since the early 1990s, the Bank of Canada sets an inflation target[58][60] The inflation target was set at 2 per cent, which is the midpoint of an inflation range of 1 to 3 per cent. They established a set of inflation-reduction targets to keep inflation "low, stable and predictable" and to foster "confidence in the value of money", contribute to Canada's sustained growth, employment gains and improved standard of living.[58]
In a January 9, 2019 statement on the release of the Monetary Policy Report, Bank of Canada Governor Stephen S. Poloz summarized major events since the October report, such as "negative economic consequences" of the US-led trade war with China. In response to the ongoing trade war "bond yields have fallen, yield curves have flattened even more and stock markets have repriced significantly" in "global financial markets". In Canada, low oil prices will impact Canada's "macroeconomic outlook". Canada's housing sector is not stabilizing as quickly as anticipated.[61]
Inflation targeting
During the period that John Crow was Governor of the Bank of Canada—1987 to 1994— there was a worldwide recession and the bank rate rose to around 14% and unemployment topped 11%.[59] Although since that time inflation-targeting has been adopted by "most advanced-world central banks",[62] in 1991 it was innovative and Canada was an early adopter when the then-Finance Minister Michael Wilson approved the Bank of Canada's first inflation-targeting in the 1991 federal budget.[62] The inflation target was set at 2 per cent.[58] Inflation is measured by the total consumer price index (CPI). In 2011 the Government of Canada and the Bank of Canada extended Canada's inflation-control target to December 31, 2016.[58] The Bank of Canada uses three unconventional instruments to achieve the inflation target: "a conditional statement on the future path of the policy rate", quantitative easing, and credit easing.[63]
As a result, interest rates and inflation eventually came down along with the value of the Canadian dollar.[59] From 1991 to 2011 the inflation-targeting regime kept "price gains fairly reliable".[62]
Following the Financial crisis of 2007–08 the narrow focus of inflation-targeting as a means of providing stable growth in the Canadian economy was questioned. By 2011, the then-Bank of Canada Governor Mark Carney argued that the central bank's mandate would allow for a more flexible inflation-targeting in specific situations where he would consider taking longer "than the typical six to eight quarters to return inflation to 2 per cent".[62]
On July 15, 2015, the Bank of Canada announced that it was lowering its target for the overnight rate by another one-quarter percentage point, to 0.5 per cent[64] "to try to stimulate an economy that appears to have failed to rebound meaningfully from the oil shock woes that dragged it into decline in the first quarter".[65] According to the Bank of Canada announcement, in the first quarter of 2015, the total Consumer price index (CPI) inflation was about 1 per cent. This reflects "year-over-year price declines for consumer energy products". Core inflation in the first quarter of 2015 was about 2 per cent with an underlying trend in inflation at about 1.5 to 1.7 per cent.[64]
In response to the Bank of Canada's July 15, 2015 rate adjustment, Prime Minister Stephen Harper explained that the economy was "being dragged down by forces beyond Canadian borders such as global oil prices, the European debt crisis, and China's economic slowdown" which has made the global economy "fragile".[66]
The Chinese stock market had lost about US$3 trillion of wealth by July 2015 when panicked investors sold stocks, which created declines in the commodities markets, which in turn negatively impacted resource-producing countries like Canada.[67]
The Bank's main priority has been to keep inflation at a moderate level.[68] As part of that strategy, interest rates were kept at a low level for almost seven years. Since September 2010, the key interest rate (overnight rate) was 0.5%. Since September 2010, the key interest rate (overnight rate) was 0.5%. In mid 2017, inflation remained below the Bank's 2% target, (at 1.6%)[69] mostly because of reductions in the cost of energy, food and automobiles; as well, the economy was in a continuing spurt with a predicted GDP growth of 2.8 percent by year end.[70][71] Early on 12 July 2017, the bank issued a statement that the benchmark rate would be increased to 0.75%.
Key industries
In 2017, the Canadian economy had the following relative weighting by industry, as percentage value of GDP:[72]
| Industry | Share of GDP |
|---|---|
| Real estate and rental and leasing | 13.01% |
| Manufacturing | 10.37% |
| Mining, quarrying, and oil and gas extraction | 8.21% |
| Finance and insurance | 7.07% |
| Construction | 7.07% |
| Health care and social assistance | 6.63% |
| Public administration | 6.28% |
| Wholesale trade | 5.78% |
| Retail trade | 5.60% |
| Professional, scientific and technical services | 5.54% |
| Educational services | 5.21% |
| Transportation and warehousing | 4.60% |
| Information and cultural industries | 3.00% |
| Administrative and support, waste management and remediation services | 2.46% |
| Utilities | 2.21% |
| Accommodation and food services | 2.15% |
| Other services (except public administration) | 1.89% |
| Agriculture, forestry, fishing and hunting | 1.53% |
| Arts, entertainment and recreation | 0.77% |
| Management of companies and enterprises | 0.62% |
Service sector
The service sector in Canada is vast and multifaceted, employing about three quarters of Canadians and accounting for 70% of GDP.[73][73] The largest employer is the retail sector, employing almost 12% of Canadians.[74] The retail industry is concentrated mainly in a small number of chain stores clustered together in shopping malls. In recent years, there has been an increase in the number of big-box stores, such as Wal-Mart (of the United States), Real Canadian Superstore, and Best Buy (of the United States). This has led to fewer workers in this sector and a migration of retail jobs to the suburbs.

The second largest portion of the service sector is the business service and hire only a slightly smaller percentage of the population.[75] This includes the financial services, real estate, and communications industries. This portion of the economy has been rapidly growing in recent years. It is largely concentrated in the major urban centres, especially Toronto, Montreal and Vancouver (see Banking in Canada).
The education and health sectors are two of Canada's largest, but both are largely under the influence of the government. The health care industry has been quickly growing, and is the third largest in Canada. Its rapid growth has led to problems for governments who must find money to fund it.
Canada has an important high tech industry, and a burgeoning film, television, and entertainment industry creating content for local and international consumption (see Media in Canada).[76] Tourism is of ever increasing importance, with the vast majority of international visitors coming from the United States. Casino gaming is currently the fastest-growing component of the Canadian tourism industry, contributing $5 billion in profits for Canadian governments and employing 41,000 Canadians as of 2001.[77]
Manufacturing

The general pattern of development for wealthy nations was a transition from a raw material production based economy to a manufacturing based one, and then to a service based economy. At its World War II peak in 1944, Canada's manufacturing sector accounted for 29% of GDP,[78] declining to 10.37% in 2017.[72] Canada has not suffered as greatly as most other rich, industrialized nations from the pains of the relative decline in the importance of manufacturing since the 1960s.[78] A 2009 study by Statistics Canada also found that, while manufacturing declined as a relative percentage of GDP from 24.3% in the 1960s to 15.6% in 2005, manufacturing volumes between 1961 and 2005 kept pace with the overall growth in the volume index of GDP.[79] Manufacturing in Canada was especially hit hard by the financial crisis of 2007–08. As of 2017, manufacturing accounts for 10% of Canada's GDP,[72] a relative decline of more than 5% of GDP since 2005.
Central Canada is home to branch plants to all the major American and Japanese automobile makers and many parts factories owned by Canadian firms such as Magna International and Linamar Corporation.
Steel
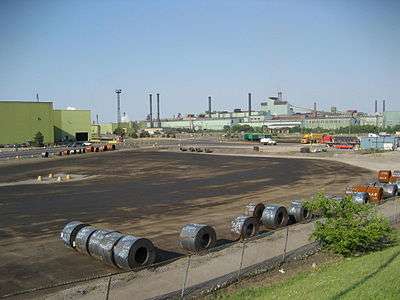
Canada was the world's nineteenth-largest steel exporter in 2018. In year-to-date 2019 (through March), further referred to as YTD 2019, Canada exported 1.39 million metric tons of steel, a 22 percent decrease from 1.79 million metric tons in YTD 2018. Canada's exports represented about 1.5 percent of all steel exported globally in 2017, based on available data. By volume, Canada's 2018 steel exports represented just over one-tenth the volume of the world's largest exporter, China. In value terms, steel represented 1.4 percent of the total goods Canada exported in 2018. The growth in exports in the decade since 2009 has been 29%. The largest producers in 2018 were ArcelorMittal, Essar Steel Algoma, and the first of those alone accounted for roughly half of Canadian steel production through its two subsidiaries. The top two markets for Canada's exports were its NAFTA partners, and by themselves accounted for 92 percent of exports by volume. Canada sent 83 percent of its steel exports to the United States in YTD 2019. The gap between domestic demand and domestic production increased to -2.4 million metric tons, up from -0.2 million metric tons in YTD 2018. In YTD 2019, exports as a share of production decreased to 41.6 percent from 53 percent in YTD 2018.[80]
In 2017, heavy industry accounted for 10.2% of Canada's Greenhouse gas emissions.[81]
Energy
Canada has access to cheap sources of energy because of its geography. This has enabled the creation of several important industries, such as the large aluminum industries in British Columbia[82] and Quebec.[83] Canada is also one of the world's highest per capita consumers of energy.[84][85]
Electricity
The electricity sector in Canada has played a significant role in the economic and political life of the country since the late 19th century. The sector is organized along provincial and territorial lines. In a majority of provinces, large government-owned integrated public utilities play a leading role in the generation, transmission and distribution of electricity. Ontario and Alberta have created electricity markets in the last decade in order to increase investment and competition in this sector of the economy. In 2017, the electricity sector accounted for 10% of total national greenhouse gas emissions.[86] Canada has substantial electricity trade with the neighbouring United States amounting to 72 TWh exports and 10 TWh imports in 2017.
Hydroelectricity accounted for 59% of all electric generation in Canada in 2016,[87] making Canada the world's second-largest producer of hydroelectricity after China.[88] Since 1960, large hydroelectric projects, especially in Quebec, British Columbia, Manitoba and Newfoundland and Labrador, have significantly increased the country's generation capacity.
The second-largest single source of power (15% of the total) is nuclear power, with several plants in Ontario generating more than half of that province's electricity, and one generator in New Brunswick. This makes Canada the world's sixth-largest producer of electricity generated by nuclear power, producing 95 TWh in 2017.[89]
Fossil fuels provide 19% of Canadian electric power, about half as coal (9% of the total) and the remainder a mix of natural gas and oil. Only five provinces use coal for electricity generation. Alberta, Saskatchewan, and Nova Scotia rely on coal for nearly half their generation while other provinces and territories use little or none. Alberta and Saskatchewan also use a substantial amount of natural gas. Remote communities including all of Nunavut and much of the Northwest Territories produce most of their electricity from diesel generators, at high economic and environmental cost. The federal government has set up initiatives to reduce dependence on diesel-fired electricity.[90]
Non-hydro renewables are a fast-growing portion of the total, at 7% in 2016.
Oil and Gas
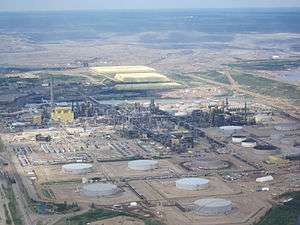
Canada possesses large oil and gas resources centred in Alberta and the Northern Territories, but also present in neighbouring British Columbia and Saskatchewan. The vast Athabasca oil sands give Canada the world's third largest reserves of oil after Saudi Arabia and Venezuela according to USGS. As such, the oil and gas industry represents 27% of Canada's total greenhouse gas emissions, an increase of 84% since 1990, mostly due to the development of the oil sands.[86]
Historically, an important issue in Canadian politics is the interplay between the oil and energy industry in Western Canada and the industrial heartland of Southern Ontario. Foreign investment in Western oil projects has fueled Canada's rising dollar. This has raised the price of Ontario's manufacturing exports and made them less competitive, a problem similar to the decline of the manufacturing sector in the Netherlands.[91][92]
The National Energy Policy of the early 1980s attempted to make Canada oil-sufficient and to ensure equal supply and price of oil in all parts of Canada, especially for the eastern manufacturing base.[93] This policy proved deeply divisive as it forced Alberta to sell low-priced oil to eastern Canada.[94] The policy was eliminated 5 years after it was first announced amid a collapse of oil prices in 1985. The new Prime Minister Brian Mulroney had campaigned against the policy in the 1984 Canadian federal election. One of the most controversial sections of the Canada–United States Free Trade Agreement of 1988 was a promise that Canada would never charge the United States more for energy than fellow Canadians.[81]
Agriculture
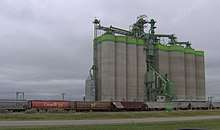
Canada is also one of the world's largest suppliers of agricultural products, particularly of wheat and other grains.[95] Canada is a major exporter of agricultural products, to the United States and Asia. As with all other developed nations the proportion of the population and GDP devoted to agriculture fell dramatically over the 20th century. The agriculture and agri-food manufacturing sector created $49.0 billion to Canada's GDP in 2015, accounting for 2.6% of total GDP.[96] This sector also accounts for 8.4% of Canada's Greenhouse gas emissions.[81]
As with other developed nations, the Canadian agriculture industry receives significant government subsidies and supports. However, Canada has been a strong supporter of reducing market influencing subsidies through the World Trade Organization. In 2000, Canada spent approximately CDN$4.6 billion on supports for the industry. Of this, $2.32 billion was classified under the WTO designation of "green box" support, meaning it did not directly influence the market, such as money for research or disaster relief. All but $848.2 million were subsidies worth less than 5% of the value of the crops they were provided for.
Free-trade agreements
Free-trade agreements in force
- Source:[97]
- Canada–U.S. Free Trade Agreement (Signed 12 October 1987, entered into force 1 January 1989, later superseded by NAFTA)
- North American Free Trade Agreement (Entered into force 1 January 1994, later superseded by USMCA)
- United States–Mexico–Canada Agreement (Entered into force July 1, 2020)
- Canada–Israel Free Trade Agreement (Entered into force 1 January 1997, modernization ongoing)
- Canada–Chile Free Trade Agreement (Entered into force 5 July 1997)
- Canada–Costa Rica Free Trade Agreement (Entered into force 1 November 2002, modernization ongoing)
- Canada–European Free Trade Association Free Trade Agreement (Iceland, Norway, Switzerland and Liechtenstein; entered into force 01-Jul-2009)
- Canada–Peru Free Trade Agreement (Entered into force 1 August 2009)
- Canada–Colombia Free Trade Agreement (Signed 21 November 2008, entered into force 15 August 2011; Canada's ratification of this FTA had been dependent upon Colombia's ratification of the "Agreement Concerning Annual Reports on Human Rights and Free Trade Between Canada and the Republic of Colombia" signed on 27 May 2010)
- Canada–Jordan Free Trade Agreement (Signed on 28 June 2009, entered into force 1 October 2012)
- Canada–Panama Free Trade Agreement (Signed on 14 May 2010, entered into force 1 April 2013)
- Canada–South Korea Free Trade Agreement (Signed on 11 March 2014, entered into force 1 January 2015)
- Canada–Ukraine Free Trade Agreement (concluded 14 July 2015, entered into force 1 August 2017)
- Comprehensive and Progressive Agreement for Trans-Pacific Partnership (signed 8 March 2018, entered into force 30 December 2018)
Free-trade agreements concluded
- Source:[98]
- Trans-Pacific Partnership (concluded 5 October 2015, superseded by CPTPP)
- Comprehensive Economic and Trade Agreement (concluded 5 August 2014)
Ongoing free-trade agreements negotiations
- Source:[98]
Canada is negotiating bilateral FTAs with the following countries respectively trade blocs:
- Caribbean Community (CARICOM)
- Guatemala, Nicaragua and El Salvador
- Dominican Republic
- India
- Japan[99]
- Morocco
- Singapore
- Andean Community (FTA's are already in force with Peru and Colombia)
Canada has been involved in negotiations to create the following regional trade blocks:
- Canada and Central American Free Trade Agreement
- Free Trade Area of the Americas (FTAA)
Political issues
Relations with the U.S.
Canada and the United States share a common trading relationship. Canada's job market continues to perform well along with the US, reaching a 30-year low in the unemployment rate in December 2006, following 14 consecutive years of employment growth.[100]

The United States is by far Canada's largest trading partner, with more than $1.7 billion CAD in trade per day in 2005.[101] In 2009, 73% of Canada's exports went to the United States, and 63% of Canada's imports were from the United States.[102] Trade with Canada makes up 23% of the United States' exports and 17% of its imports.[103] By comparison, in 2005 this was more than U.S. trade with all countries in the European Union combined,[104] and well over twice U.S. trade with all the countries of Latin America combined.[105] Just the two-way trade that crosses the Ambassador Bridge between Michigan and Ontario equals all U.S. exports to Japan. Canada's importance to the United States is not just a border-state phenomenon: Canada is the leading export market for 35 of 50 U.S. states, and is the United States' largest foreign supplier of energy.
Bilateral trade increased by 52% between 1989, when the U.S.–Canada Free Trade Agreement (FTA) went into effect, and 1994, when the North American Free Trade Agreement (NAFTA) superseded it. Trade has since increased by 40%. NAFTA continues the FTA's moves toward reducing trade barriers and establishing agreed-upon trade rules. It also resolves some long-standing bilateral irritants and liberalizes rules in several areas, including agriculture, services, energy, financial services, investment, and government procurement. NAFTA forms the largest trading area in the world, embracing the 405 million people of the three North American countries.
The largest component of U.S.–Canada trade is in the commodity sector.
The U.S. is Canada's largest agricultural export market, taking well over half of all Canadian food exports.[106] Nearly two-thirds of Canada's forest products, including pulp and paper, are exported to the United States; 72% of Canada's total newsprint production also is exported to the U.S.
At $73.6 billion in 2004, U.S.-Canada trade in energy is the largest U.S. energy trading relationship, with the overwhelming majority ($66.7 billion) being exports from Canada. The primary components of U.S. energy trade with Canada are petroleum, natural gas, and electricity. Canada is the United States' largest oil supplier and the fifth-largest energy producing country in the world. Canada provides about 16% of U.S. oil imports and 14% of total U.S. consumption of natural gas. The United States and Canada's national electricity grids are linked, and both countries share hydropower facilities on the western borders.
While most of U.S.-Canada trade flows smoothly, there are occasionally bilateral trade disputes, particularly in the agricultural and cultural fields. Usually these issues are resolved through bilateral consultative forums or referral to World Trade Organization (WTO) or NAFTA dispute resolution. In May 1999, the U.S. and Canadian governments negotiated an agreement on magazines that provides increased access for the U.S. publishing industry to the Canadian market. The United States and Canada also have resolved several major issues involving fisheries. By common agreement, the two countries submitted a Gulf of Maine boundary dispute to the International Court of Justice in 1981; both accepted the court's 12 October 1984 ruling which demarcated the territorial sea boundary. A current issue between the United States and Canada is the ongoing softwood lumber dispute, as the U.S. alleges that Canada unfairly subsidizes its forestry industry.
In 1990, the United States and Canada signed a bilateral Fisheries Enforcement Agreement, which has served to deter illegal fishing activity and reduce the risk of injury during fisheries enforcement incidents. The U.S. and Canada signed a Pacific Salmon Agreement in June 1999 that settled differences over implementation of the 1985 Pacific Salmon Treaty for the next decade.[107]
Canada and the United States signed an aviation agreement during Bill Clinton's visit to Canada in February 1995, and air traffic between the two countries has increased dramatically as a result. The two countries also share in operation of the St. Lawrence Seaway, connecting the Great Lakes to the Atlantic Ocean.[108]
The U.S remains Canada's largest foreign investor and the most popular destination for Canadian foreign investments. In 2018, the stock of U.S. direct investment in Canada totaled $406 billion, while the stock of Canadian investment in the U.S totaled $595 billion, or 46% of the overall CDIA stock for 2018.[109][110] This made Canada the second largest investing country in the U.S for 2018[111] US investments are primarily directed at Canada's mining and smelting industries, petroleum, chemicals, the manufacture of machinery and transportation equipment, and finance, while Canadian investment in the United States is concentrated in manufacturing, wholesale trade, real estate, petroleum, finance, and insurance and other services.[112]
Debt issue
Central Government Debt
The OECD reports the Central Government Debt as percentage of the GDP. In 2000 Canada's was 40.9 percent, in 2007 it was 25.2 percent, in 2008 it was 28.6 percent and by 2010 it was 36.1 percent.[113] The OECD reports net financial liabilities measure used by the OECD, reports the net number at 25.2%, as of 2008,[113] making Canada's total government debt burden as the lowest in the G8. The gross number was 68% in 2011.[114]
The CIA World Factbook, updated weekly, measures financial liabilities by using gross general government debt, as opposed to net federal debt used by the OECD and the Canadian federal government. Gross general government debt includes both "intragovernmental debt and the debt of public entities at the sub-national level". For example, the CIA measured Canada's public debt as 84.1% of GDP in 2012 and 87.4% of GDP in 2011 making it 22nd in the world.[115]
Household Debt
Household debt, the amount of money that all adults in the household owe financial institutions, includes consumer debt and mortgage loans. In March 2015, the International Monetary Fund reported that Canada's high household debt was one of two vulnerable domestic areas in Canada's economy; the second is its overheated housing market.[116]
According to Statistics Canada, total household credit as of July 2019 was CAD$2.2 trillion.[117] According to Philip Cross of the Fraser Institute, in May 2015, while the Canadian household debt-to-income ratio is similar to that in the US, however lending standards in Canada are tighter than those in the United States to protect against high-risk borrowers taking out unsustainable debt.[118]
Mergers and Acquisition
Since 1985, 63,755 deals in- and outbound Canada have been announced, with an overall value of US$3.7 billion.[119] Almost 50% of the targets of Canadian companies (outbound deals) have a parent company in the US. Inbound deals are 82% percent from the US.
Here is a list of the biggest deals in Canadian history:[119]
| Rank | Date announced | Acquiror name | Acquiror nation | Target name | Target nation | Value (in bil. USD) |
|---|---|---|---|---|---|---|
| 1 | 01.26.2000 | Spin-off | Canada | Nortel Networks Corp | Canada | 59.97 |
| 2 | 06.20.2000 | Vivendi SA | France | Seagram Co Ltd | Canada | 40.43 |
| 3 | 07.12.2007 | Rio Tinto Canada Holdings Inc | Canada | Alcan Inc | Canada | 37.63 |
| 4 | 09.06.2016 | Enbridge Inc | Canada | Spectra Energy Corp | United States | 28.29 |
| 5 | 12.03.2014 | Enbridge Income Fund | Canada | Enbridge Inc-Liquids | Canada | 24.79 |
| 6 | 05.11.2008 | Shareholders | Canada | Cenovus Energy Inc | Canada | 20.26 |
| 7 | 07.23.2012 | CNOOC Canada Holding Ltd | Canada | Nexen Inc | Canada | 19.12 |
| 8 | 05.15.2006 | Xstrata PLC | Switzerland | Falconbridge Ltd | Canada | 17.40 |
| 9 | 08.11.2006 | Cia Vale do Rio Doce SA | Brazil | Inco Ltd | Canada | 17.15 |
| 10 | 03.23.2009 | Suncor Energy Inc | Canada | Petro-Canada | Canada | 15.58 |
| 11 | 07.29.2008 | Teck Cominco Ltd | Canada | Fording Canadian Coal Trust | Canada | 13.60 |
See also
- Canada's Global Markets Action Plan
- Comparison of Canadian and American economies
- Economy of Alberta
- Economy of Ontario
- Economy of Quebec
- Economy of Saskatchewan
- History of the petroleum industry in Canada
- List of Median household income of cities in Canada
- List of Commonwealth of Nations countries by GDP
- List of Canadian provinces and territories by gross domestic product

Notes
- The OECD produces an annual report on member nations who share the goal of "contributing to the development of the world economy" by attaining the "highest sustainable economic growth and employment and a rising standard of living while maintaining financial stability."
- this figure is the Low Income Cut-Off, a calculation that results in higher figures than found in many comparable economies; Canada does not have an official poverty line
- figures are for gross general government debt, as opposed to net federal debt; gross general government debt includes both intragovernmental debt and the debt of public entities at the sub-national level
- "Gross domestic product (GDP) at basic prices, by industry". www150.statcan.gc.ca.
References
- "World Economic Outlook Database, April 2019". IMF.org. International Monetary Fund. Retrieved September 29, 2019.
- "World Bank Country and Lending Groups". datahelpdesk.worldbank.org. World Bank. Retrieved September 29, 2019.
- "Canada's population estimates, third quarter 2019". statcan.gc.ca. Statistics Canada. Retrieved January 17, 2020.
- "World Economic Outlook Database, October 2019". IMF.org. International Monetary Fund. Retrieved October 15, 2019.
- "World Economic Outlook Database, April 2020". IMF.org. International Monetary Fund. Retrieved April 15, 2020.
- "World Economic Outlook Update, June 2020". IMF.org. International Monetary Fund. Retrieved August 10, 2020.
- "The World Factbook". CIA.gov. Central Intelligence Agency. Retrieved October 8, 2019.
- OECD (2019). "Income inequality (Indicator)". Archived from the original on September 18, 2019. Retrieved September 18, 2019.
- "Human Development Index (HDI)". hdr.undp.org. HDRO (Human Development Report Office) United Nations Development Programme. Retrieved December 11, 2019.
- "Inequality-adjusted HDI (IHDI)". hdr.undp.org. UNDP. Retrieved May 22, 2020.
- "Labour force characteristics, monthly, seasonally adjusted and trend-cycle, last 5 months". statcan.gc.ca. Statistics Canada. Retrieved August 12, 2020.
- "Youth unemployment rate". data.oecd.org. OECD. Retrieved August 12, 2020.
- "Payroll employment, earnings and hours, September 2019". Statistics Canada.
- "Ease of Doing Business in Canada". Doingbusiness.org. Retrieved November 24, 2017.
- "Canada's State of Trade 2019" (20 ed.). Global Affairs Canada. 2019. ISSN 2562-8313. PDF version
- "Canada - WTO Statistics Database". World Trade Organization. Archived from the original on September 6, 2017. Retrieved March 1, 2017.
- "The World Factbook". CIA.gov. Central Intelligence Agency. Archived from the original on April 12, 2019. Retrieved April 6, 2019.
- "Canada's balance of international payments, first quarter 2019". Statcan.gc.ca. Retrieved September 23, 2019.
- "Statistics Canada". Retrieved July 9, 2017.
- "Development aid rises again in 2016 but flows to poorest countries dip". OECD. April 11, 2017. Retrieved September 25, 2017.
- "Sovereigns rating list". Standard & Poor's. Retrieved January 14, 2012.
- "Moody's Affirms Canada's Aaa Rating; Maintains Stable Outlook". Moody's Investors Service. November 2, 2016. Retrieved September 23, 2017.
- "Fitch Downgrades Canada's Ratings to 'AA+'; Outlook Stable". Retrieved June 24, 2020.
- "Archived copy". Archived from the original on September 6, 2017. Retrieved September 6, 2017.CS1 maint: archived copy as title (link)
- "International Reserves and Foreign Currency Liquidity - CANADA". www.imf.org.
- Hall, Peter A.; Soskice, David (2001). Varieties of Capitalism: The Institutional Foundations of Comparative Advantage. Oxford University Press. p. 570. ISBN 9780191647703.
- "Actual hours worked per week by industry, seasonally adjusted crack". Statistics Canada. Archived from the original on November 3, 2008.
- Anthony, Craig (September 12, 2016). "10 Countries with the Most Natural Resources". Investopedia.
- James, Patrick (2008). Canadian Studies in the New Millennium. University of Toronto Press. p. 310. ISBN 9780802094681.
- Vladimir Kvint (2010). The Global Emerging Market: Strategic Management and Economics. Routledge. p. 194. ISBN 978-1-135-85997-8.
- David Dyment (2010). Doing the Continental: A New Canadian-American Relationship. Dundurn. p. 78. ISBN 978-1-55488-814-6.
- Rotberg, Robert I.; Carment, David (2018). Canada's Corruption at Home and Abroad. Taylor & Francis. p. 12. ISBN 978-1-351-57924-7.
- "Latest release". World Trade Organization. April 17, 2008. Archived from the original on June 5, 2011. Retrieved May 23, 2011.
- "Index of Globalization 2010". KOF. Archived from the original on May 31, 2012. Retrieved May 22, 2012.
- "Index of Economic Freedom". The Heritage Foundation-The Wall Street Journal. 2013. Archived from the original on June 29, 2013. Retrieved June 27, 2013.
- "Jonathan Kay: The key to Canada's economic advantage over the United States? Less income inequality". National Post. December 13, 2012. Archived from the original on May 15, 2016. Retrieved December 14, 2012.
- OECD (June 16, 2017). Better Policies Policies for Stronger and More Inclusive Growth in Canada. OECD Publishing. pp. 3–. ISBN 978-92-64-27794-6.
- "Monthly Reports - World Federation of Exchanges". WFE.as of November 2018
- Archived May 12, 2013, at the Wayback Machine
- "Aquaculture Canada: Facts and Figures". Dfo-mpo.gc.ca. February 2, 2011. Archived from the original on June 15, 2012. Retrieved February 1, 2013.
- "Canada's Entertainment Software Industry In 2011 A Report Prepared For The Entertainment Software Association Of Canada" (PDF). Archived from the original (PDF) on May 7, 2013. Retrieved February 5, 2016.
- Global Systems by David J Rees with Michael G Jones, Chapter 4, ISBN 0-919913-74-1
- Central Intelligence Agency (May 16, 2006). "The World Factbook: Canada". Central Intelligence Agency. Retrieved May 6, 2007.
- "The World's Largest Public Companies". Forbes.
U.S. companies account for the most members of the list, 565, followed by China and Hong Kong, which is home to 263 Global 2000 companies.
- "Exports of goods on a balance-of-payments basis, by product". Statistics Canada. Archived from the original on November 2, 2011.
- "Imports, exports and trade balance of goods on a balance-of-payments basis, by country or country grouping". Statistics Canada. Archived from the original on June 18, 2006.
- Canada's Private to Public (Crown) Property Ratio is 60:40.2006 exports/imports
- "Gross domestic product at basic prices, by industry (monthly)". Statistics Canada. Archived from the original on April 28, 2011.
- Howlett, Michael and M. Ramesh. Political Economy of Canada: An Introduction. Toronto: McClelland and Stewart, 1992.
- "Report for Selected Countries and Subjects". Retrieved September 7, 2018.
- "Report for Selected Countries and Subjects". www.imf.org. Retrieved December 25, 2019.
- Canada, Government of Canada, Statistics (April 2020). "Labour force characteristics by province, seasonally adjusted, March 2020". www150.statcan.gc.ca. Retrieved April 20, 2020.
- Workman, Daniel (September 26, 2019). "Canada's Top Trading Partners". World's Top Exports.
- "Canada: Trade Statistics". Michigan State University.
- 'OECD Compendium of Productivity Indicators 2012 (Report). OECD. 2012.page 3
- OECD Economic Surveys Canada June 2012 Overview (PDF) (Report). Organization for Economic Co-operation and Development. 2012. Archived (PDF) from the original on June 16, 2013.
- "Bank of Canada". www.bankofcanada.ca.
- Monetary Policy Report (PDF) (Report). July 15, 2015. Retrieved August 6, 2015.
- Blake, ed. (2007), Transforming the Nation: Canada and Brian Mulroney
- Inflation-Control Target Backgrounder (PDF), Bank of Canada, November 2010
- Poloz, Stephen S. (January 9, 2019). "Opening Statement" (Press release). Monetary Policy Report. Ottawa, Ontario: Bank of Canada. Retrieved January 9, 2019.
- Jeremy Torobin; Bill Curry (October 16, 2011), Bank of Canada to get marching orders to look beyond inflation targeting, Ottawa, Ontario: The Globe and Mail
- Monetary Policy Report (Report). Bank of Canada. April 2009. Retrieved August 6, 2015.
- Bank of Canada lowers overnight rate target to 1/2 per cent, Bank of Canada, retrieved August 6, 2015
- David Parkinson (July 9, 2015), IMF again cuts Canada's growth forecast ahead of interest rate decision, The Globe and Mail, retrieved August 6, 2015
- Lampert, Allison (July 15, 2015), After rate cut, Canada PM's office says global woes hit economy, Reuters, retrieved August 7, 2015
- Chris Sorensen; Aaron Hutchins (July 15, 2015), How Canada's economy went from boom to recession so fast: An in-depth look at the perfect storm that pushed Canada into recession, Macleans, retrieved August 8, 2015
- "Inflation-Control Target".
- "Bloomberg - Are you a robot?". Bloomberg.com. August 18, 2019.
- "Bloomberg - Are you a robot?". Bloomberg.com. August 18, 2019.
- "Bank of Canada raises interest rates for first time in seven years".
- Gross domestic product (GDP) at basic prices, by industry, annual average (x 1,000,000), Statistics Canada, Table 36-10-0434-03, 2018.
- "CIA World Factbook - Canada". Cia.gov. Retrieved October 14, 2018.
- Wallace, Iain, A Geography of the Canadian Economy. Don Mills: Oxford University Press, 2002.
- http://www.statcan.gc.ca/tables-tableaux/sum-som/l01/cst01/econ40-eng.htm
- Gasher, Mike (2002). Hollywood North the feature film industry in British Columbia. Vancouver: UBC Press. ISBN 978-0774809689.
- MacLaurin, Tanya; MacLaurin, Donald (2003). "Casino gaming and tourism in Canada". International Journal of Contemporary Hospitality Management. MCB UP Ltd. 15 (6): 328–332. doi:10.1108/09596110310488177.
- "Manufacturing's share of gross domestic product, 1900 to 2005". Statistics Canada.
- "The Canadian Manufacturing Sector: Adapting to Challenges". Statistics Canada.
- "Global Steel Trade Monitor - Steel Exports Report: Canada" (PDF). US Department of Commerce. International Trade Administration. August 2019. Archived from the original (PDF) on April 28, 2018. Retrieved October 10, 2019.

- "Greenhouse gas sources and sinks: executive summary 2019". aem. Environment and Climate Change Canada. August 19, 2019. Archived from the original on April 7, 2020. Retrieved March 31, 2020.
- "Resource-based Industries and High-tech Manufacturing - Goods Sector - Major Industries - A Guide to the BC Economy and Labour Market". Guidetobceconomy.org. Archived from the original on September 7, 2011. Retrieved November 2, 2011.
- Canadian, The (October 4, 2011). "Aluminum heavyweights to make $15-billion Quebec investment". Canadian Manufacturing. Archived from the original on October 13, 2011. Retrieved November 2, 2011.
- Environment Canada - Energy Consumption Archived February 22, 2004, at the Wayback Machine
- "Canada vs. The OECD: An Environmental Comparison". Environmentalindicators.com. Retrieved February 22, 2011.
- "Greenhouse gas emissions". Canada.ca. Environment and Climate Change Canada. January 9, 2007. Retrieved March 31, 2020.
- Natural Resources Canada, Electricity Facts
- International Energy Agency, Key World Energy Statistics 2010 (PDF), Paris: IEA/OECD, p. 19, archived from the original (PDF) on October 11, 2010, retrieved September 7, 2010
- "Top 15 Nuclear Generating Countries". Nuclear Energy Institute. Retrieved March 31, 2019.
- Natural Resources Canada, Reducing diesel energy in rural and remote communities
- Lee Greenberg (July 20, 2011). "Growing Equalization Payments to Ontario Threaten Country". National Post.
- Michel Beine; Charles S. Bos; Serge Coulombe (January 2009). "Does the Canadian economy suffer from Dutch Disease?" (PDF). Archived from the original (PDF) on November 17, 2011.
- "National Energy Program", The Canadian Encyclopedia. Historica Foundation of Canada, January 2005
- Gerson, Jen (September 14, 2012), "A legacy rich as oil: Ex-Alberta premier Peter Lougheed's ideas imprinted on party still in power 41 years later", National Post, retrieved February 3, 2015
- "The Relative Position of Canada in the World Grain Market". Dsp-psd.pwgsc.gc.ca. October 2, 2002. Retrieved February 22, 2011.
- "Agriculture and Agri-Food Economic Account, 2015". Statistics Canada. Retrieved July 30, 2019.
- "Canada's Free Trade Agreements". International.gc.ca. Archived from the original on March 12, 2014. Retrieved December 18, 2013.
- "Canada's Free Trade Agreements". International.gc.ca. Archived from the original on March 12, 2014. Retrieved March 11, 2014.
- The Canadian Press (February 24, 2011). "Canada, Japan study free-trade pact". CBC News. Retrieved February 28, 2011.
- "The Daily, Friday, January 5, 2007. Labour Force Survey". Statcan.ca. January 5, 2007. Archived from the original on May 28, 2008. Retrieved February 22, 2011.
- "Canadian Statistics -- Imports, exports and trade balance of goods on a balance-of-payments basis, by country or country grouping". Archived from the original on June 18, 2006.
- "Imports, exports and trade balance of goods on a balance-of-payments basis, by country or country grouping". 0.statcan.gc.ca. February 11, 2011. Archived from the original on April 28, 2011. Retrieved February 22, 2011.
- FTDWebMaster, [Name of person creating HTML]. "FTD - Statistics - Trade Highlights - Top Trading Partners". Census.gov. Retrieved February 22, 2011.
- FTDWebMaster, FTD Data Dissemination. "FTD - Statistics - Country Data - U.S. Trade Balance with European Union". Census.gov. Retrieved February 22, 2011.
- FTDWebMaster, FTD Data Dissemination. "FTD - Statistics - Country Data - U.S. Trade Balance with South and Central America". Census.gov. Retrieved February 22, 2011.
- Agriculture and Agri-Food Canada / Agriculture et Agroalimentaire Canada Archived September 28, 2006, at the Wayback Machine
- "The Pacific Salmon Treaty: The 1999 Agreement and Renegotiated Annex IV". EveryCRSReport.com. May 5, 2009.
- "HowStuffWorks "The St. Lawrence Seaway"". Geography.howstuffworks.com. March 30, 2008. Archived from the original on July 12, 2011. Retrieved February 22, 2011.
- "Canada's State of Trade 2019" (20th ed.). Global Affairs Canada. August 2, 2019. Retrieved September 26, 2019.
- "Canada's State of Trade 2019" (20th ed.). Global Affairs Canada. Retrieved September 26, 2019.
- "Direct Investment by Country and Industry, 2018". Bureau of Economic Analysis. July 24, 2019. Retrieved September 26, 2019.
- "Overview of Canadian Foreign Direct Investment (PRB-0833E)". .parl.gc.ca. June 17, 2008. Archived from the original on May 2, 2010. Retrieved February 22, 2011.
- Central Government Debt (Report). OECD. 2011. Retrieved June 13, 2013.
- "Fiscal balances and public indebtedness | OECD Economic Outlook". Find Articles. October 27, 2011. Archived from the original on July 10, 2012. Retrieved November 2, 2011.
- "CIA - The World Factbook". Cia.gov. Retrieved June 13, 2013.
- "2015 Report of the International Monetary Fund", International Monetary Fund, March 9, 2015
- Statistics Canada (July 2019), Credit measures, Bank of Canada (x 1,000,000), retrieved September 15, 2019
- Philip Cross (May 2015), A Longer-term Perspective on Canada's Household Debt (PDF), retrieved August 7, 2015
- "M&A Canada - Mergers & Acquisitions Statistics". IMAA-Institute. Retrieved February 22, 2018.
Further reading
- Howlett, Michael and M. Ramesh. Political Economy of Canada: An Introduction. Toronto: McClelland and Stewart, 1992.
- Wallace, Iain, A Geography of the Canadian Economy. Don Mills: Oxford University Press, 2002.
- "OECD Economic Surveys: Canada 2010", Organización para la Cooperación y Desarrollo Económicos, Paris : OECD economic surveys, 2010, ISBN 978-92-64-08325-7
- Baldwin, John Russel (2003), Innovation and knowledge creation in an open economy, Cambridge University Press, ISBN 0-521-81086-8
- Easterbrook, William Thomas; Aitken, Hugh G. J (1988). Canadian Economic History. University of Toronto Press. ISBN 0-8020-6696-8.
- Hessing, Melody; Michael Howlett, Tracy Summerville (2005), Canadian natural resource and environmental policy, UBC Press, ISBN 9780774851459
- Kealey, Gregory S (1995), Workers and Canadian history, McGill-Queen's University Press, ISBN 0-7735-1352-3
- Levi, Michael A (2009), The Canadian oil sands : energy security vs. climate change, Council on Foreign Relations, Center for Geoeconomic Studies, ISBN 978-0-87609-429-7
- Lipsey, Richard G; Alice Nakamura, Canada. Industry Canada (2006), Services industries and the knowledge-based economy, University of Calgary Press, ISBN 1-55238-149-8
- Pomfret, Richard (1981), "The Economic Development of Canada", revised 2005, Routledge, ISBN 978-0-415-37976-2
- Quarter, Jack; Laurie Mook, Ann Armstrong (2009), Understanding the Social Economy: A Canadian Perspective, University of Toronto Press, ISBN 978-0-8020-9695-1
- Tavidze, Albert (2007), Progress in Economics Research, Volume 12, Gardners Books, ISBN 978-1-60021-720-3
External links
| Wikimedia Commons has media related to Economy of Canada. |
- Statistics Canada
- Department of Finance Canada
- Bank of Canada
- Canada - OECD
- Canada profile at the CIA World Factbook
- Canada profile at The World Bank
- Canada Exports and Imports
| |||||||||