Gross national income
The gross national income (GNI), previously known as gross national product (GNP), is the total domestic and foreign output claimed by residents of a country, consisting of gross domestic product (GDP), plus factor incomes earned by foreign residents, minus income earned in the domestic economy by nonresidents (Todaro & Smith, 2011: 44).[2] Comparing GNI to GDP shows the degree to which a nation's GDP represents domestic or international activity. GNI has gradually replaced GNP in international statistics.[3][4] While being conceptually identical, it is calculated differently.[5] GNI is the basis of calculation of the largest part of contributions to the budget of the European Union.[6] In February 2017, Ireland's GDP became so distorted from the base erosion and profit shifting ("BEPS") tax planning tools of U.S. multinationals, that the Central Bank of Ireland replaced Irish GDP with a new metric, Irish Modified GNI*. In 2017, Irish GDP was 162% of Irish Modified GNI*.[7]
Comparison of GNI and GDP

| No. | Country | GNI (Atlas method)[8] | GNI[9] | GDP[10] | ||
|---|---|---|---|---|---|---|
| value (a) | a - GDP | value (b) | b - GDP | |||
| 1 | 20,636,317 | -267,153 | 20,837,347 | 344,239 | 20,544,343 | |
| 2 | 13,181,372 | 175,082 | 13,556,853 | -44,951 | 13,608,151 | |
| 3 | 5,226,599 | -123,267 | 5,155,423 | 156,212 | 4,971,323 | |
| 4 | 3,905,321 | 146,841 | 4,058,030 | 58,783 | 3,947,620 | |
| 5 | 2,777,405 | 130,590 | 2,816,805 | -60,242 | 2,855,296 | |
| 6 | 2,752,034 | 39,806 | 2,840,071 | 37,660 | 2,777,535 | |
| 7 | 2,727,893 | 124,576 | 2,691,040 | 39,230 | 2,718,732 | |
| 8 | 2,038,376 | -51,486 | 2,106,525 | -28,268 | 2,083,864 | |
| 9 | 1,902,286 | 64,182 | 1,832,170 | 4,172 | 1,885,482 | |
| 10 | 1,665,565 | 54,417 | 1,694,054 | -21,265 | 1,713,341 | |
GNI (Atlas method) nominal
Nominal, Atlas method – millions of current US$ (top 15)[3]
| Rank | 2014 | 2013 | 2012 | 2011 | 2010 | 2009 | 2008 | 2007 | 2006 | |||||||||
|---|---|---|---|---|---|---|---|---|---|---|---|---|---|---|---|---|---|---|
| 1 | 17,611,491 | 17,001,290 | 16,501,016 | 15,727,291 | 15,143,137 | 14,740,580 | 15,002,428 | 14,651,211 | 14,345,565 | |||||||||
| 2 | 10,096,966 | 9,110,333 | 7,934,721 | 6,726,270 | 5,752,320 | 4,856,999 | 4,835,553 | 4,812,119 | 4,931,413 | |||||||||
| 3 | 5,339,076 | 5,899,905 | 6,101,579 | 5,775,633 | 5,376,601 | 4,797,984 | 4,070,860 | 3,348,291 | 3,160,529 | |||||||||
| 4 | 3,853,623 | 3,809,927 | 3,754,154 | 3,801,607 | 3,662,524 | 3,588,452 | 3,601,765 | 3,283,519 | 2,685,206 | |||||||||
| 5 | 2,844,284 | 2,869,883 | 2,824,713 | 2,889,304 | 2,847,703 | 2,831,553 | 2,904,224 | 2,835,805 | 2,645,489 | |||||||||
| 6 | 2,801,499 | 2,695,974 | 2,612,525 | 2,542,593 | 2,540,957 | 2,666,939 | 2,800,864 | 2,576,642 | 2,414,820 | |||||||||
| 7 | 2,429,720 | 2,486,874 | 2,432,061 | 2,237,958 | 2,234,508 | 2,227,358 | 2,222,143 | 2,093,640 | 1,989,288 | |||||||||
| 8 | 2,147,247 | 2,130,760 | 2,143,583 | 2,207,921 | 1,916,260 | 1,572,431 | 1,490,975 | 1,356,017 | 1,241,641 | |||||||||
| 9 | 2,027,964 | 1,981,791 | 1,892,548 | 1,755,712 | 1,555,615 | 1,519,339 | 1,484,345 | 1,353,031 | 1,224,994 | |||||||||
| 10 | 1,930,634 | 1,952,847 | 1,823,299 | 1,617,083 | 1,511,465 | 1,447,937 | 1,427,429 | 1,152,772 | 966,585 | |||||||||
| 11 | 1,785,099 | 1,848,274 | 1,773,264 | 1,547,010 | 1,496,363 | 1,392,779 | 1,368,593 | 1,117,463 | 941,326 | |||||||||
| 12 | 1,444,201 | 1,514,269 | 1,396,221 | 1,455,758 | 1,425,123 | 1,318,495 | 1,229,139 | 1,091,726 | 921,879 | |||||||||
| 13 | 1,366,027 | 1,376,929 | 1,359,417 | 1,125,787 | 1,053,302 | 1,037,381 | 1,118,647 | 1,079,991 | 898,063 | |||||||||
| 14 | 1,365,797 | 1,298,958 | 1,232,164 | 1,119,902 | 1,026,316 | 988,663 | 1,074,555 | 1,000,700 | 830,146 | |||||||||
| 15 | 1,237,533 | 1,202,800 | 1,167,292 | 1,068,140 | 1,025,186 | 954,754 | 900,062 | 809,106 | 753,205 | |||||||||
GNI (Atlas method) PPP
PPP – millions of international dollars (top 15)[4]
| Rank | 2016 | 2014 | 2013 | 2012 | 2011 | 2010 | 2009 | 2008 | 2007 | 2006 | ||||||||||
|---|---|---|---|---|---|---|---|---|---|---|---|---|---|---|---|---|---|---|---|---|
| 1 | 21,366,057 | 17,966,893 | 17,091,162 | 16,596,084 | 15,802,898 | 15,121,133 | 14,494,460 | 14,791,194 | 14,585,723 | 14,140,770 | ||||||||||
| 2 | 18,749,688 | 17,823,200 | 16,418,959 | 15,112,256 | 13,680,536 | 12,305,378 | 11,017,654 | 10,090,052 | 8,991,462 | 7,637,790 | ||||||||||
| 3 | 8,594,226 | 7,292,778 | 6,699,996 | 6,179,567 | 5,794,517 | 5,314,158 | 4,783,856 | 4,433,212 | 4,408,333 | 4,180,595 | ||||||||||
| 4 | 5,443,842 | 4,846,688 | 4,844,841 | 4,700,740 | 4,522,723 | 4,437,371 | 4,192,471 | 4,376,743 | 4,138,987 | 3,658,435 | ||||||||||
| 5 | 4,394,786 | 4,243,163 | 4,097,775 | 3,890,009 | 3,634,151 | 3,505,460 | 3,407,922 | 3,286,644 | 3,170,077 | 3,006,891 | ||||||||||
| 6 | 4,175,469 | 3,809,390 | 3,651,266 | 3,474,015 | 3,293,559 | 3,157,522 | 2,953,733 | 2,836,486 | 2,724,769 | 2,603,694 | ||||||||||
| 7 | 3,305,725 | 3,237,388 | 3,108,506 | 3,254,184 | 3,124,400 | 2,837,672 | 2,678,150 | 2,597,648 | 2,325,258 | 2,270,766 | ||||||||||
| 8 | 2,929,424 | 2,655,517 | 2,625,346 | 2,494,655 | 2,495,100 | 2,381,563 | 2,291,855 | 2,343,012 | 2,288,657 | 2,094,160 | ||||||||||
| 9 | 2,835,242 | 2,592,315 | 2,483,802 | 2,394,758 | 2,343,934 | 2,281,280 | 2,272,667 | 2,310,555 | 2,224,097 | 2,071,669 | ||||||||||
| 10 | 2,763,382 | 2,550,078 | 2,436,810 | 2,275,802 | 2,124,755 | 2,054,019 | 2,016,501 | 2,050,607 | 1,971,909 | 1,865,144 | ||||||||||
| 11 | 2,316,529 | 2,155,153 | 2,148,502 | 2,134,839 | 2,106,961 | 1,949,021 | 1,798,541 | 1,705,066 | 1,568,263 | 1,434,248 | ||||||||||
| 12 | 2,262,919 | 2,111,206 | 1,939,753 | 1,941,682 | 1,859,264 | 1,710,132 | 1,597,656 | 1,611,372 | 1,516,236 | 1,432,295 | ||||||||||
| 13 | 1,907,486 | 1,696,955 | 1,652,081 | 1,627,812 | 1,568,631 | 1,506,812 | 1,492,658 | 1,508,412 | 1,447,718 | 1,346,277 | ||||||||||
| 14 | 1,833,914 | 1,576,495 | 1,549,822 | 1,497,167 | 1,494,181 | 1,486,687 | 1,393,108 | 1,405,612 | 1,350,407 | 1,246,382 | ||||||||||
| 15 | 1,799,740 | 1,556,600 | 1,535,440 | 1,488,100 | 1,401,447 | 1,336,646 | 1,279,702 | 1,313,134 | 1,271,027 | 1,212,200 | ||||||||||
Gross national product
Gross national product (GNP) is the market value of all the goods and services produced in one year by labor and property supplied by the citizens of a country. Unlike gross domestic product (GDP), which defines production based on the geographical location of production, GNP indicates allocated production based on location of ownership. In fact it calculates income by the location of ownership and residence, and so its name is also the less ambiguous gross national income.
GNP is an economic statistic that is equal to GDP plus any income earned by residents from overseas investments minus income earned within the domestic economy by overseas residents.
GNP does not distinguish between qualitative improvements in the state of the technical arts (e.g., increasing computer processing speeds), and quantitative increases in goods (e.g., number of computers produced), and considers both to be forms of "economic growth".[11]
When a country's capital or labour resources are employed outside its borders, or when a foreign firm is operating in its territory, GDP and GNP can produce different measures of total output. In 2009 for instance, the United States estimated its GDP at $14.119 trillion, and its GNP at $14.265 trillion.[12]
The term gross national income (GNI) has gradually replaced the Gross national product (GNP) in international statistics.[3][4] While being conceptually identical, the precise calculation method has evolved at the same time as the name change.[5]
Use of GNP
The United States used GNP as its primary measure of total economic activity until 1991, when it began to use GDP.[13] In making the switch, the Bureau of Economic Analysis (BEA) noted both that GDP provided an easier comparison of other measures of economic activity in the United States and that "virtually all other countries have already adopted GDP as their primary measure of production".[14] Many economists have questioned how meaningful GNP or GDP is as a measure of a nation's economic well-being, as it does not count most unpaid work and counts much economic activity that is unproductive or actually destructive.[15]
GNI vs GDP
While GDP measures the market value of all final goods and services produced in a given country, GNI measures income generated by the country's citizens, regardless of the geographic location of the income. In many states, those two figures are close, as the difference between income received by the country versus payments made to the rest of the world is not significant. According to the World Bank, the GNI of the US in 2016 was 1.5% higher than GDP.[16]
In developing countries, on the other hand, the difference might be significant due to a large amount of foreign aid and capital inflow. In 2016, the GNI [17] of Armenia was 4.45% higher than GDP.[18] Based on the OECD reports, in 2015 alone, Armenia has received a total of US$409 million development assistance. Over the past 25 years, USAID has provided more than one billion USD to improve the living of the people in Armenia. GNI equals GDP plus wages, salaries, and property income of the country's residents earned abroad that also constitutes the higher GNI figure. According to the UN report on migration from Armenia in 2015-17, every year around 15-20 thousand people leave Armenia permanently,[19] and roughly 47% of those are working migrants that leave the country to earn income and sustain the families left in Armenia. In 2016 Armenian residents received in a total of around $150 million remittances.[20]
See also
- Net national income
- Measures of national income and output
- Gross national income in the European Union
- Lists of countries by GNI per capita
- National average salary
- Gross domestic product (GDP)
- Gross national product (GNP)
- Irish modified GNI (or GNI*)
References
| Library resources about Gross national income |
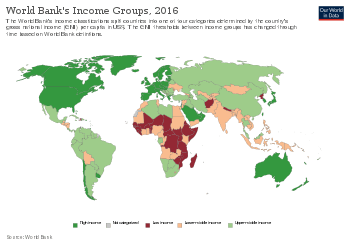
- "World Bank's Income Groups". Our World in Data. Retrieved 5 March 2020.
- Todaro, M. P., & Smith, S. C. (2011). Economic Development 11. Addison-Wesley, Pearson, ISBN, 10, 0-13.
- World Bank. "GNI, Atlas method". data.worldbank.org. Retrieved 2016-06-23.
- World Bank. "GNI, PPP (international $)". data.worldbank.org. Retrieved 2016-06-23.
- "Glossary:Gross national income (GNI)". Eurostat Statistic Explained. Eurostat. Retrieved 2016-06-23.
- "Monitoring GNI for own resource purposes". Eurostat Statistic Explained. Eurostat. Retrieved 2016-06-23.
- Heike Joebges (January 2017). "CRISIS RECOVERY IN A COUNTRY WITH A HIGH PRESENCE OF FOREIGN-OWNED COMPANIES: The Case of Ireland" (PDF). IMK Macroeconomic Policy Institute, Hans-Böckler-Stiftung.
- "GNI, Atlas method (current US$)". World Bank.
- "GNI (current US$)". World Bank.
- "GDP (current US$)". World Bank.
- Daly, Herman E. (1996), Beyond Growth. Beacon Press
- "Flow of Funds Accounts of the United States" (PDF). Board of Governors of the Federal Reserve System. 17 September 2010. p. 9. Archived from the original (PDF) on 8 December 2010. Retrieved 23 August 2018.
- "BEA: Glossary "G"". Bureau of Economic Analysis. 5 September 2007.
- "Gross Domestic Product as a Measure of U.S. Production" (PDF). August 1991.
- "Beyond GDP". The Economist. ISSN 0013-0613. Retrieved 2016-07-27.
- "BEA: The World Bank - US figures". the World Bank. 2017.
- "BEA: Armenia GNP". Macrotrends. 2019.
- "BEA: Armenia GDP". Macrotrends. 2019.
- "BEA: Migration Rate and Associated Issues in Armenia in 2016-2017". UN Armenia. 2017.
- "BEA: Inflow of Remittances by Balance of Payments". Central Bank of Armenia. 2019.