Demographics of Hong Kong
This article is about the demographic features of the population of Hong Kong, including population density, ethnicity, education level, health of the populace, religious affiliations and other aspects of the population.
| Demographics and culture of Hong Kong |
|---|
| Demographics |
|
| Culture |
| Other Hong Kong topics |
| Part of a series on |
| Ethnicity in Hong Kong |
|---|
Hong Kong is one of the most densely populated areas in the world, with an overall density of some 6,300 people per square kilometre.[1] At the same time, Hong Kong has one of the world's lowest birth rates—1.11 per woman of child-bearing age as of 2012, far below the replacement rate of 2.1. It is estimated that 26.8% of the population will be aged 65 or more in 2033, up from 12.1% in 2005. Hong Kong recorded 8.2 births per 1,000 people in 2005–2010.[2]
Ethnically, Hong Kong mainly consists of Han[3] Chinese who constitute approximately 92% of the population.[4] Of these, many originate from various regions in Guangdong. There are also a number of descendants of immigrants from elsewhere in Southern China and around the world after the end of World War II.
Terminology
People from Hong Kong generally refer to themselves, in Cantonese, as Hèung Góng Yàhn (Chinese: 香港人; Cantonese Yale: Hèung Góng Yàhn; lit.: 'Hong Kong people'); however, the term is not restricted to those of Chinese descent, owing to Hong Kong's roughly 160-year colonial history that saw the civil servants and traders of British, Indian, Russian and other ethnic groups stationed in Hong Kong.
In English, the term 'Hongkongers' (or sometimes 'Hong Kongers') is also used to refer to Hong Kongese people, while the term 'Hongkongese' is sometimes used as an adjective to describe people or things related to Hong Kong.[5][6]
Population density
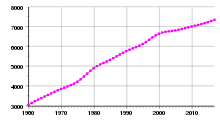
The following census data is available for Hong Kong between the years 1841–2011. In 2011, Hong Kong had a population of just over 7 million, with a density of approximately 6,300 people per square kilometre. This makes Hong Kong the fourth most densely populated region in the world, after Macau, Monaco, and Singapore.[1]
| Year | Pop. | ±% p.a. |
|---|---|---|
| 1841 | 7,450 | — |
| 1851 | 32,983 | +16.04% |
| 1861 | 119,320 | +13.72% |
| 1871 | 120,124 | +0.07% |
| 1881 | 160,402 | +2.93% |
| 1891 | 221,441 | +3.28% |
| 1901 | 368,987 | +5.24% |
| 1911 | 456,739 | +2.16% |
| 1921 | 625,166 | +3.19% |
| 1931 | 840,473 | +3.00% |
| 1941 | 1,640,000 | +6.91% |
| 1945 | 600,000 | −22.23% |
| 1951 | 2,070,000 | +22.92% |
| 1961 | 3,128,648 | +4.22% |
| 1971 | 3,936,630 | +2.32% |
| 1981 | 5,183,400 | +2.79% |
| 1991 | 5,752,000 | +1.05% |
| 2001 | 6,714,300 | +1.56% |
| 2011 | 7,071,600 | +0.52% |
| 2017 | 7,409,800 | +0.78% |
| Sources: Census and Statistics Department,[7][8][9][10] CICRED,[11] Office for National Statistics[12] | ||
Ethnicity
Chinese
According to the 2016 by-census, 92% of the Hong Kong population is ethnic Chinese.[14] The Hong Kong census does not categorise Han Chinese subgroups. However, the majority of Hongkongers of Chinese descent trace their ancestry to various parts of Southern China: the Guangzhou area, followed by Siyi (a region of four counties neighbouring Guangzhou), Chaoshan (a region of North Guangdong home to Teochew speakers), Fujian, and Shanghai.[15] Some Cantonese people also originate from Hakka-speaking villages in the New Territories.[16] Most Teochew-speaking migrants immigrated to Hong Kong between the late 1940s and early 1970s, while migrants from Fujian (previously Southern Min speakers, and increasingly more Central Min and Northern Min speakers) have constituted a growing number of migrants since 1978.[17] Many Taishanese and Cantonese also migrated after 1949.
Currently, the major Chinese groups include the Punti, Hakka, Cantonese (including Toishanese), Hoklo,[18] and Tanka (Chinese: 蜑家/水上; lit.: 'boat dwellers').[19] The Punti, and Tanka people in Hong Kong are largely descendants of the indigenous population, while the Hakka and Hoklo groups are composed of both indigenous groups and more recent migrants.
Ethnic minorities
8% of the population of Hong Kong are categorised as "ethnic minorities", including a large number of Filipinos and Indonesians, who together make up approximately 4.6% of the population.[20][21][22]
| Ethnic group |
2006 By-census | 2011 Census | 2016 By-census | |||
|---|---|---|---|---|---|---|
| Number | % | Number | % | Number | % | |
| Chinese | 6,522,148 | 95.0 | 6,620,393 | 93.6 | 6,752,202 | 92.0 |
| Filipino | 112,453 | 1.6 | 133,018 | 1.9 | 184,081 | 2.5 |
| Indonesian | 87,840 | 1.3 | 133,377 | 1.9 | 153,299 | 2.1 |
| White | 36,384 | 0.5 | 55,236 | 0.8 | 58,209 | 0.8 |
| Indian | 20,444 | 0.3 | 28,616 | 0.4 | 36,462 | 0.5 |
| Nepalese | 15,950 | 0.2 | 16,518 | 0.2 | 25,472 | 0.3 |
| Pakistani | 11,111 | 0.2 | 18,042 | 0.3 | 18,094 | 0.2 |
| Thai | 11,900 | 0.2 | 11,213 | 0.2 | 10,215 | 0.1 |
| Japanese | 13,189 | 0.2 | 12,580 | 0.2 | 9,976 | 0.1 |
| Other Asian | 12,663 | 0.2 | 12,247 | 0.2 | 19,589 | 0.3 |
| Others | 20,264 | 0.3 | 30,336 | 0.4 | 68,986 | 0.9 |
| Total | 6,864,346 | 7,071,576 | 7,336,585 | |||
Circa 2018 there were about 2,000 people of African origins with about 800-1,000 in Yuen Long.[23] Chungking Mansions is another area of settlement and employment. Some Africans seeking to asylum travelled to Hong Kong as of June 2020.[24] According to Lingnan University professor Lisa Leung Yuk-ming, African settlement began in the 1990s. The Hong Kong African Association (香港非洲人協會) is an ethnic association for those people.[25]
Nationality
Due to its history as a trading, business, and tourism hub, a large number of expatriates live in Hong Kong, representing 9.4% of the population.[26] The following lists ethnic groups with significant presence in Hong Kong in alphabetical order by category:
Age groups
United Nations data
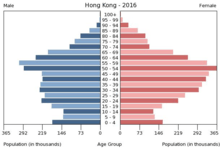
According to United Nations estimates from 1 July 2013, Hong Kong's population is distributed in the following age ranges, with the largest age group represented being 50–54 years:[27]
Population by age group
| Age group | Male | Female | Total | % |
|---|---|---|---|---|
| Total | 3,330,700 | 3,856,800 | 7,187,500 | 100 |
| 0–4 | 134,500 | 125,700 | 260,200 | 3.62 |
| 5–9 | 128,000 | 120,200 | 248,200 | 3.45 |
| 10–14 | 149,100 | 139,600 | 288,700 | 4.02 |
| 15–19 | 208,000 | 196,300 | 404,300 | 5.63 |
| 20–24 | 226,400 | 230,700 | 457,100 | 6.36 |
| 25–29 | 221,800 | 295,800 | 517,600 | 7.20 |
| 30–34 | 231,900 | 343,200 | 575,100 | 8.00 |
| 35–39 | 229,500 | 331,000 | 560,500 | 7.80 |
| 40–44 | 239,800 | 338,700 | 578,500 | 8.05 |
| 45–49 | 271,000 | 337,900 | 608,900 | 8.47 |
| 50–54 | 313,500 | 341,100 | 654,600 | 9.11 |
| 55–59 | 281,300 | 287,900 | 569,200 | 7.92 |
| 60–64 | 220,000 | 223,100 | 443,100 | 6.16 |
| 65–69 | 148,800 | 146,400 | 295,200 | 4.11 |
| 70–74 | 109,600 | 103,700 | 213,300 | 2.97 |
| 75–79 | 100,600 | 109,900 | 210,500 | 2.93 |
| 80–84 | 69,500 | 88,400 | 157,900 | 2.20 |
| 85+ | 47,400 | 97,200 | 144,600 | 2.01 |
Population by wider age groups
| Age group | Male | Female | Total | Percent |
|---|---|---|---|---|
| 0–14 | 411,600 | 385,500 | 797,100 | 11.09 |
| 15–64 | 2,443,200 | 2,925,700 | 5,368,900 | 74.70 |
| 65+ | 475,900 | 545,600 | 1,021,500 | 14.21 |
Hong Kong government data
The Hong Kong government provides the following estimates for mid-2013:[28]
- 0–14 years: 11.0% (male 408,000; female 382,600)
- 15–24 years: 11.7% (male 424,500; female 417,900)
- 25–34 years: 15.2% (male 454,900; female 639,700)
- 35–44 years: 15.9% (male 471,500; female 671,800)
- 45–54 years: 17.7% (male 587,900; female 681,700)
- 55–64 years: 14.2% (male 503,700; female 512,600)
- 65 and over: 14.3% (male 479,500; female 547,700)
Median age: 45.0 (2013 est.)
Language
As a former British colony, Hong Kong has 2 official languages: English, and Chinese, although the specific variety of Chinese is not specified. The majority of the population uses Cantonese as their usual spoken language. However, due to Hong Kong's role as an international trade and finance hub, there are also a wide variety of minority groups speaking dozens of languages present in the territory.
| Language usually spoken at home (5+) | 1961[29] | 1971[29] | 1991[30] | 1996[31] | 2001[32] | 2006[33] | 2011[33] | 2016[33] | ||||||||
|---|---|---|---|---|---|---|---|---|---|---|---|---|---|---|---|---|
| Number | % | Number | % | Number | % | Number | % | Number | % | Number | % | Number | % | Number | % | |
| Cantonese | 2,076,200 | 78.9 | 3,469,200 | 88.1 | 4,583,322 | 88.6 | 5,196,240 | 88.7 | 5,726,972 | 89.2 | 6,030,960 | 90.8 | 6,095,213 | 89.5 | 6,264,700 | 88.9 |
| Mandarin | 503,000 | 19.1 | 405,100 | 10.2 | 57,577 | 1.1 | 65,892 | 1.1 | 55,410 | 0.9 | 60,859 | 0.9 | 94,399 | 1.4 | 131,406 | 1.9 |
| Other Chinese languages | 364,694 | 7.1 | 340,222 | 5.8 | 352,562 | 5.5 | 289,027 | 4.4 | 273,745 | 4.0 | 221,247 | 3.1 | ||||
| English | 31,800 | 1.2 | 41,100 | 1.1 | 114,084 | 2.2 | 184,308 | 3.1 | 203,598 | 3.2 | 187,281 | 2.8 | 238,288 | 3.5 | 300,417 | 4.3 |
| Other languages | 17,900 | 0.8 | 21,200 | 0.6 | 49,232 | 1.0 | 73,879 | 1.3 | 79,197 | 1.2 | 72,217 | 1.1 | 106,788 | 1.6 | 131,199 | 1.9 |
| Total | 2,628,900 | 3,936,600 | 5,168,909 | 5,860,541 | 6,417,739 | 6,640,344 | 6,808,433 | 7,048,969 | ||||||||
However, a very large proportion of the population in Hong Kong are able to communicate in multiple languages. The school system is separated into English-medium and Chinese-medium school, both of which teach English and Mandarin.
| 2006[33] | 2011[33] | 2016[33] | |
|---|---|---|---|
| % | % | % | |
| Cantonese | 96.5 | 95.8 | 94.6 |
| Mandarin | 40.2 | 47.8 | 48.6 |
| Hakka | 4.7 | 4.7 | 4.2 |
| English | 44.7 | 46.1 | 53.2 |
| Hokkien | 3.4 | 3.5 | 3.6 |
| Chiu Chow | 3.9 | 3.8 | 3.4 |
| Bahasa Indonesia | 1.7 | 2.4 | 2.7 |
| Tagalog | 1.4 | 1.7 | 2.7 |
| Japanese | 1.2 | 1.5 | 1.8 |
| Shanghainese | 1.2 | 1.1 | 1.1 |
Sex ratio
According to The World Factbook in 2013, the Hong Kong population was divided into the following male/female ratios:
Male/female ratio by age group
- At birth: 1.07 male(s)/female
- 0–14 years: 1.09 male(s)/female
- 15–24 years: 1.01 male(s)/female
- 25–54 years: 0.88 male(s)/female
- 55–64 years: 1 male(s)/female
- 65 years and over: 0.88 male(s)/female
- Total population: 0.94 male(s)/female
Education level
According to The World Factbook estimates in 2002, 93.5% of the population over the age of 15 had attended schooling, including 96.9% of males and 89.6% of females.
Health and mortality
The following table shows birth rates and mortality rates in Hong Kong between 1950 and 2019.[34][35][36]
At the end of the 20th century, Hong Kong had one of the lowest birth rates in the world. However, the number of births doubled in the decade between 2001 and 2011, largely due to an increase in the number of children born in Hong Kong to women with residence in Mainland China. In 2001 there were 7,810 births to Mainland women (16%) out of a total of 48,219 births. This increased to 37,253 births to Mainland women (45%) out of a total of 82,095 births.[37]
Birth and mortality rates
| Average population | Live births | Deaths | Natural change | Crude birth rate (per 1,000) | Crude death rate (per 1,000) | Natural change (per 1,000) | TFR | |
|---|---|---|---|---|---|---|---|---|
| 1950 | 1,974,000 | 60,600 | 18,465 | 42,135 | 30.7 | 9.4 | 21.3 | |
| 1951 | 2,044,000 | 68,500 | 20,580 | 47,920 | 34.0 | 10.2 | 23.8 | |
| 1952 | 2,141,000 | 71,976 | 19,459 | 52,517 | 33.9 | 9.2 | 24.7 | |
| 1953 | 2,253,000 | 75,544 | 18,300 | 57,244 | 33.7 | 8.2 | 25.5 | |
| 1954 | 2,371,000 | 83,317 | 19,283 | 64,034 | 35.2 | 8.2 | 27.1 | |
| 1955 | 2,490,000 | 90,511 | 19,080 | 71,431 | 36.3 | 7.7 | 28.7 | |
| 1956 | 2,607,000 | 96,746 | 19,295 | 77,451 | 37.0 | 7.4 | 29.6 | |
| 1957 | 2,721,000 | 97,834 | 19,365 | 78,469 | 35.8 | 7.1 | 28.7 | |
| 1958 | 2,834,000 | 106,624 | 20,554 | 86,070 | 37.4 | 7.2 | 30.2 | |
| 1959 | 2,951,000 | 104,579 | 20,250 | 84,329 | 35.2 | 6.8 | 28.4 | |
| 1960 | 3,075,000 | 110,667 | 19,146 | 91,521 | 36.1 | 6.2 | 29.9 | 5.014 |
| 1961 | 3,207,000 | 108,726 | 18,738 | 89,988 | 34.3 | 5.9 | 28.4 | 5.030 |
| 1962 | 3,344,000 | 119,166 | 20,933 | 98,233 | 36.1 | 6.3 | 29.7 | 4.980 |
| 1963 | 3,477,000 | 118,413 | 20,340 | 98,073 | 34.6 | 5.9 | 28.7 | 4.857 |
| 1964 | 3,596,000 | 111,436 | 18,657 | 92,779 | 31.8 | 5.3 | 26.5 | 4.665 |
| 1965 | 3,692,000 | 106,362 | 18,160 | 88,202 | 29.6 | 5.0 | 24.5 | 4.422 |
| 1966 | 3,763,000 | 96,436 | 19,261 | 77,175 | 26.6 | 5.3 | 21.3 | 4.152 |
| 1967 | 3,812,000 | 94,368 | 20,234 | 74,134 | 25.3 | 5.4 | 19.9 | 3.887 |
| 1968 | 3,850,000 | 83,641 | 19,444 | 64,197 | 22.0 | 5.1 | 16.9 | 3.649 |
| 1969 | 3,889,000 | 82,482 | 19,256 | 63,226 | 21.3 | 5.0 | 16.4 | 3.448 |
| 1970 | 3,942,000 | 79,132 | 19,996 | 59,136 | 20.0 | 5.1 | 14.9 | 3.284 |
| 1971 | 4,009,000 | 79,789 | 20,374 | 59,415 | 19.7 | 5.0 | 14.7 | 3.459 |
| 1972 | 4,088,000 | 80,344 | 21,397 | 58,947 | 19.5 | 5.2 | 14.3 | 3.315 |
| 1973 | 4,180,000 | 82,252 | 21,251 | 61,001 | 19.5 | 5.0 | 14.5 | 3.177 |
| 1974 | 4,283,000 | 83,589 | 21,879 | 61,710 | 19.3 | 5.1 | 14.3 | 2.967 |
| 1975 | 4,396,000 | 79,790 | 21,591 | 58,168 | 17.9 | 4.9 | 13.0 | 2.666 |
| 1976 | 4,519,000 | 78,511 | 22,628 | 55,883 | 17.4 | 5.1 | 12.3 | 2.480 |
| 1977 | 4,652,000 | 80,022 | 23,331 | 56,691 | 17.5 | 5.1 | 12.4 | 2.376 |
| 1978 | 4,788,000 | 80,957 | 23,816 | 57,141 | 17.3 | 5.1 | 12.2 | 2.272 |
| 1979 | 4,919,000 | 81,975 | 25,110 | 56,865 | 16.8 | 5.1 | 11.7 | 2.120 |
| 1980 | 5,039,000 | 85,290 | 24,995 | 60,295 | 17.0 | 4.9 | 12.1 | 2.047 |
| 1981 | 5,145,000 | 86,751 | 24,822 | 61,929 | 16.8 | 4.8 | 12.0 | 1.933 |
| 1982 | 5,239,000 | 86,120 | 25,384 | 60,736 | 16.4 | 4.8 | 11.5 | 1.860 |
| 1983 | 5,322,000 | 83,293 | 26,512 | 56,781 | 15.6 | 5.0 | 10.6 | 1.722 |
| 1984 | 5,394,000 | 77,297 | 25,510 | 51,787 | 14.4 | 4.7 | 9.7 | 1.559 |
| 1985 | 5,456,000 | 76,126 | 25,248 | 50,878 | 14.0 | 4.6 | 9.3 | 1.491 |
| 1986 | 5,508,000 | 71,620 | 25,902 | 45,718 | 13.0 | 4.7 | 8.3 | 1.367 |
| 1987 | 5,551,000 | 69,958 | 26,916 | 43,042 | 12.6 | 4.8 | 7.8 | 1.311 |
| 1988 | 5,592,000 | 75,412 | 27,659 | 47,753 | 13.4 | 4.9 | 8.5 | 1.400 |
| 1989 | 5,641,000 | 69,621 | 28,745 | 40,876 | 12.3 | 5.1 | 7.2 | 1.296 |
| 1990 | 5,704,000 | 67,731 | 29,136 | 38,595 | 12.0 | 5.1 | 6.9 | 1.272 |
| 1991 | 5,786,000 | 68,281 | 28,429 | 39,852 | 12.0 | 4.9 | 7.1 | 1.281 |
| 1992 | 5,884,000 | 70,949 | 30,550 | 40,399 | 12.3 | 5.2 | 7.1 | 1.347 |
| 1993 | 5,992,000 | 70,451 | 30,571 | 39,880 | 12.0 | 5.1 | 6.9 | 1.342 |
| 1994 | 6,101,000 | 71,646 | 29,905 | 41,741 | 11.9 | 4.9 | 7.0 | 1.355 |
| 1995 | 6,206,000 | 68,637 | 31,468 | 37,169 | 11.2 | 5.1 | 6.1 | 1.295 |
| 1996 | 6,304,000 | 63,291 | 32,176 | 31,115 | 9.9 | 5.1 | 4.8 | 1.191 |
| 1997 | 6,492,000 | 59,250 | 31,738 | 27,512 | 9.1 | 4.9 | 4.2 | 1.127 |
| 1998 | 6,550,000 | 52,977 | 32,847 | 20,130 | 8.1 | 5.0 | 3.1 | 1.016 |
| 1999 | 6,611,000 | 51,281 | 33,255 | 18,026 | 7.8 | 5.0 | 2.7 | 0.981 |
| 2000 | 6,675,000 | 54,134 | 33,758 | 20,376 | 8.1 | 5.1 | 3.1 | 1.032 |
| 2001 | 6,721,000 | 48,219 | 33,378 | 14,841 | 7.2 | 5.0 | 2.2 | 0.931 |
| 2002 | 6,728,000 | 48,209 | 34,267 | 13,942 | 7.1 | 5.1 | 2.0 | 0.941 |
| 2003 | 6,745,000 | 46,965 | 36,971 | 9,994 | 7.0 | 5.5 | 1.5 | 0.901 |
| 2004 | 6,781,000 | 49,796 | 36,918 | 12,878 | 7.3 | 5.4 | 1.9 | 0.922 |
| 2005 | 6,818,000 | 57,098 | 38,830 | 18,268 | 8.4 | 5.7 | 2.7 | 0.959 |
| 2006 | 6,871,000 | 65,626 | 37,457 | 28,169 | 9.6 | 5.5 | 4.1 | 0.984 |
| 2007 | 6,921,000 | 70,875 | 39,476 | 31,399 | 10.2 | 5.7 | 4.5 | 1.028 |
| 2008 | 6,951,000 | 78,822 | 41,796 | 37,026 | 11.3 | 6.0 | 5.3 | 1.064 |
| 2009 | 6,980,000 | 82,095 | 41,175 | 40,920 | 11.8 | 5.9 | 5.9 | 1.055 |
| 2010 | 7,024,000 | 88,584 | 42,194 | 46,390 | 12.6 | 6.0 | 6.6 | 1.127 |
| 2011 | 7,072,000 | 95,451 | 42,346 | 53,105 | 13.5 | 5.9 | 7.6 | 1.204 |
| 2012 | 7,155,000 | 91,558 | 43,917 | 47,641 | 12.8 | 6.1 | 6.7 | 1.285 |
| 2013 | 7,187,000 | 57,084 | 43,397 | 13,687 | 7.9 | 6.0 | 1.9 | 1.125 |
| 2014 | 7,242,000 | 62,305 | 45,087 | 17,218 | 8.6 | 6.2 | 2.4 | 1.235 |
| 2015 | 7,306,000 | 59,878 | 46,108 | 13,770 | 8.2 | 6.3 | 1.9 | 1.196 |
| 2016 | 7,337,000 | 60,803 | 46,900 | 13,903 | 8.3 | 6.4 | 1.9 | 1.205 |
| 2017 | 7,410,000 | 56,890 | 45,883 | 11,007 | 7.7 | 6.3 | 1.4 | 1.126 |
| 2018 | 7,482,000 | 54,330 | 47,479 | 6,851 | 7.2 | 6.3 | 0.9 | 1.072 |
| 2019 | 7,507,400 | 53,168 | 48,706 | 4,462 | 7.0 | 6.5 | 0.5 | 1.052 |
Infant mortality rate
According to The World Factbook in 2013, the infant mortality rate in Hong Kong was 2.89 deaths/1,000 live births.
Life expectancy
According to The World Factbook in 2013, the average life expectancy for the total population was 82.2 years; 79.47 years for males and 85.14 years for females.
Hong Kong is the territory with the world's highest life expectancy according to the United Nations.
| Period | Life expectancy in Years |
Period | Life expectancy in Years |
|---|---|---|---|
| 1950–1955 | 63.1 | 1985–1990 | 77.0 |
| 1955–1960 | 65.9 | 1990–1995 | 78.1 |
| 1960–1965 | 68.8 | 1995–2000 | 80.0 |
| 1965–1970 | 70.9 | 2000–2005 | 81.4 |
| 1970–1975 | 72.5 | 2005–2010 | 82.4 |
| 1975–1980 | 73.7 | 2010–2015 | 83.4 |
| 1980–1985 | 75.6 |
Source: UN World Population Prospects[38]
Marriage and fertility
According to The World Factbook in 2006, the average marriage age in Hong Kong was 30 years for males and 27 years for females, and the population was subdivided into the following categories:
Marital status
- Married: 57.8% (3,423,995)
- Never married: 32% (1,920,522)
- Divorced: 3.2% (189,563)
- Separated: 0.6% (34,722)
Fertility rate
The World Factbook in 2013 reported that the fertility rate in Hong Kong was 1.11 children born/woman.
Religion
Religion in Hong Kong (2016)[39]
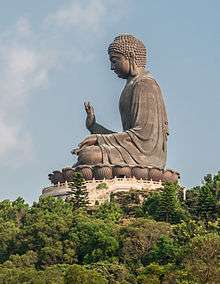
Over half of all people (56.1% as of 2010) are not religious.[40] Religious people in Hong Kong follow a diverse range of religions, among which Taoist and Buddhist (specifically Chinese Buddhism) faiths are common for people of Chinese descent.
Confucian beliefs are popular in Hong Kong, but it is arguable whether Confucianism can be considered as a religion.[41] As such, Confucianism is excluded in some studies.[40]
Christian beliefs (Protestantism and Catholicism together) are also common, as well as non-organised Chinese folk religions, whose followers may state that they are not religious.
Traditional religions including Chinese Buddhism were discouraged under British rule, which officially represented Christianity.[42] The handover of sovereignty from Britain to China has led to a resurgence of Buddhist and Chinese religions.[42]
| Region | 2008 | 2009 | 2010 | 2011 | 2012 | 2013 | 2016 |
| Buddhists | > 1 million | > 1 million | > 1 million | > 1 million | > 1 million | > 1 million | > 1 million |
| Taoists | ≈ 1 million | ≈ 1 million | ≈ 1 million | ≈ 1 million | > 1 million | > 1 million | > 1 million |
| Protestant | 320,000 | 320,000 | 480,000 | 480,000 | 480,000 | ≈ 500,000 | 500,000 |
| Catholics | 350,000 | 350,000 | 353,000 | 363,000 | 363,000 | 368,000 | 384,000 |
| Muslims | 220,000 | 220,000 | 220,000 | 220,000 | 270,000 | 300,000 | 300,000 |
| Hindu | 40,000 | 40,000 | 40,000 | 40,000 | 40,000 | 40,000 | 100,000 |
| Sikhs | 10,000 | 10,000 | 10,000 | 10,000 | 10,000 | 10,000 | 12,000 |
See also
- Hong Kong drifter
- Hong Kong Kids phenomenon
- Hong Kongers
- Hong Kong people in the United Kingdom
- Indigenous inhabitants of the New Territories (Hong Kong)
- Right of abode in Hong Kong
- Waves of mass migrations from Hong Kong
References
- "Population – Overview | Census and Statistics Department". Government of Hong Kong. Archived from the original on 17 October 2016. Retrieved 3 May 2016.
- glenday, craig (2013). Guinness World Records. pp. 121. ISBN 9781908843159.
- "Race Relations Unit - Demographics". www.had.gov.hk. Retrieved 4 February 2020.
- 2016 Population By-census – Summary Results (Report). Census and Statistics Department. February 2016. p. 37. Archived from the original on 20 November 2017. Retrieved 14 March 2017.
- Poon Angela and Jenny Wong, Struggling for Democracy Under China: The Implications of a Politicised 'Hongkongese' Identity http://www.civic-exchange.org/publications/Intern/2004-JennyandAngela.pdf Archived 7 October 2006 at the Wayback Machine
- Sidney Cheung, Hong Kong Handover http://www.umich.edu/~iinet/journal/vol5no1/sidney2.html Archived 21 November 2007 at the Wayback Machine
- Census of Hongkong (PDF) (Report). Hongkong Register Office. 31 December 1853. p. 89 – via University of Hong Kong.
- Hong Kong Statistics 1947–1967 (PDF) (Report). Census and Statistics Department. 1969. p. 14. Archived (PDF) from the original on 7 July 2018. Retrieved 7 July 2018.
-
- Demographic Trends in Hong Kong 1981–2011 (PDF) (Report). Census and Statistics Department. December 2012. p. 8. Archived (PDF) from the original on 7 July 2018. Retrieved 7 July 2018.
- June 2018. Hong Kong Monthly Digest of Statistics (Report). Census and Statistics Department. June 2018. p. 4.
- Fan, Shuh Ching (1974). "The Population of Hong Kong" (PDF). World Population Year: 1–2. OCLC 438716102. Archived (PDF) from the original on 18 July 2011. Retrieved 7 July 2018.
- Census of England and Wales, 1871 (Report). Parliament of the United Kingdom. 30 July 1873. p. 322. Archived from the original on 30 December 2017. Retrieved 7 July 2018 – via Google Books.
- "Main Tables". Archived from the original on 20 November 2017. Retrieved 13 March 2017.
- 2016 Population By-census – Summary Results (Report). Census and Statistics Department. February 2016. p. 37. Archived from the original on 20 November 2017. Retrieved 14 March 2017.
- Ng Sek Hong (2010). Labour Law in Hong Kong. Kluwer Law International. p. 19. ISBN 978-90-411-3307-6.
- Melvin Ember; Carol R. Ember; Ian Skoggard, eds. (2005). Encyclopedia of diasporas: immigrant and refugee cultures around the world. Diaspora communities. 2. Springer. pp. 94–95. ISBN 978-0-306-48321-9.
- Hu-DeHart, Evelyn (2006). Voluntary organizations in the Chinese Diaspora. Hong Kong University Press. pp. 122–125. ISBN 978-962-209-776-6.
- Kelly, Margaret. Fodor's China. Fodor's Travel Publications, 2011. ISBN 0307480534, 9780307480538. p. 392.
- Ng Lun, Ngai-ha. In: Ring, Trudy, Robert M. Salkin, Sharon La Boda (editors). International Dictionary of Historic Places: Asia and Oceania (Volume 5 of International Dictionary of Historic Places, Trudy Ring, ISBN 1884964052, 9781884964053). Taylor & Francis, 1996. ISBN 1884964044, 9781884964046. p. 358.
- 2011 Population Census – Summary Results (PDF) (Report). Census and Statistics Department. February 2012. p. 37. Archived (PDF) from the original on 22 May 2013. Retrieved 14 July 2013.
- "Archived copy" (PDF). Archived (PDF) from the original on 2 December 2013. Retrieved 14 October 2013.CS1 maint: archived copy as title (link)
- "Immigration Autonomy". Immigration Department Annual Report 2009-2010. Archived from the original on 23 June 2012. Retrieved 7 July 2012.
- Zheng, Mandy; Rachel Leung (17 January 2018). "Chinese woman threatens to sue another accused of throwing her dog out 6th floor window". South China Morning Post. Retrieved 12 May 2020.
- Sun, Fiona (27 June 2020). "Black lives matter in Hong Kong too: African migrants say racism leaves them feeling alienated, shunned". South China Morning Post. Retrieved 2 August 2020.
- Lee, Chermaine; Miguel Candela (2 August 2020). "What it's like to be black and African in Hong Kong: 'there is racism literally in every corner'". Post Magazine. Retrieved 2 August 2020.
- https://www.bycensus2016.gov.hk/en/bc-mt.html
- "United Nations Statistics Division – Demographic and Social Statistics". United Nations. Archived from the original on 27 December 2016. Retrieved 3 May 2016.
- HK Census. "HK Census Archived 27 September 2007 at the Wayback Machine." Statistical Table of population. Retrieved on 16 March 2007.
- "The population of Hong Kong" (PDF). 1974. Archived (PDF) from the original on 18 July 2011. Retrieved 7 July 2018. Cite journal requires
|journal=(help) - "Hong Kong 1991 Population Census - Main tables" (PDF). Census and Statistics Department, Hong Kong. 1991. Archived (PDF) from the original on 13 October 2018. Retrieved 23 November 2018.
- "1996 Population By-census - Main Report" (PDF). Census and Statistics Department, Hong Kong. 1996. Archived (PDF) from the original on 13 October 2018. Retrieved 23 November 2018.
- "2001 Population Census - Main report" (PDF). Census and Statistics Department, Hong Kong. 2001. Archived (PDF) from the original on 13 October 2018. Retrieved 23 November 2018.
- "Main Tables | 2016 Population By-census". www.bycensus2016.gov.hk. Archived from the original on 8 October 2018. Retrieved 23 November 2018.
- Census and Statistics Department of the Government of the Hong Kong SAR
- B.R. Mitchell. International historical statistics 1750–2005: Africa, Asia and Oceania
- "United Nations Statistics Division – Demographic and Social Statistics". United Nations. Archived from the original on 27 December 2016. Retrieved 3 May 2016.
- "The fertility trend in Hong Kong 1981–2009". Archived from the original on 13 November 2012. Retrieved 5 August 2012.
- "World Population Prospects – Population Division – United Nations". Archived from the original on 19 September 2016. Retrieved 15 July 2017.
- Hong Kong: The Facts – Religion and Custom Archived 14 June 2018 at the Wayback Machine HKSAR Government Home Affairs Bureau, May 2016.
- Pew Research Center’s Forum on Religion & Public Life (2012). The Global Religious Landscape: A Report on the Size and Distribution of the World's Major Religious Groups as of 2010 (PDF). Pew Research Center. Archived (PDF) from the original on 23 March 2018. Retrieved 5 June 2019.
- Berling, Judith A. (1982). "Confucianism". Focus on Asian Studies. 2 (1): 5–7. Archived from the original on 5 June 2019. Retrieved 5 June 2019.
- Chan, Shun-hing. Leung, Beatrice. [2003] (2003). Changing Church and State Relations in Hong Kong, 1950–2000. Hong Kong: HK university press. Page 24. ISBN 962-209-612-3
- "Archived copy" (PDF). Archived (PDF) from the original on 12 August 2017. Retrieved 9 January 2018.CS1 maint: archived copy as title (link)
External links
- Hong Kong Population History
- HK Facts
- TopNews.in – Baby boom pushes Hong Kong population above 7 million
- Census and Statistics Department – Latest Official HK Population Statistics
- Hong Kong African Association (香港非洲人協會)
| Sovereign states |
|
|---|---|
| States with limited recognition | |
| Dependencies and other territories |
|
| |
| Sovereign states |
|
|---|---|
| States with limited recognition |
|
| Dependencies and other territories |
|
| |