Voronoi diagram
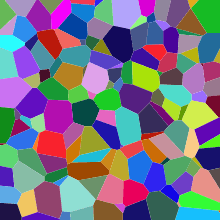
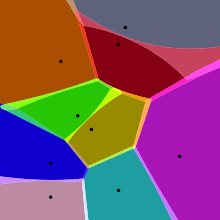
In mathematics, a Voronoi diagram is a partition of a plane into regions close to each of a given set of objects. In the simplest case, these objects are just finitely many points in the plane (called seeds, sites, or generators). For each seed there is a corresponding region consisting of all points of the plane closer to that seed than to any other. These regions are called Voronoi cells. The Voronoi diagram of a set of points is dual to its Delaunay triangulation.
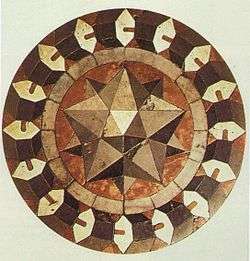
The Voronoi diagram is named after Georgy Voronoy, and is also called a Voronoi tessellation, a Voronoi decomposition, a Voronoi partition, or a Dirichlet tessellation (after Peter Gustav Lejeune Dirichlet). Voronoi cells are also known as Thiessen polygons.[1][2][3] Voronoi diagrams have practical and theoretical applications in many fields, mainly in science and technology, but also in visual art.[4][5]
The simplest case
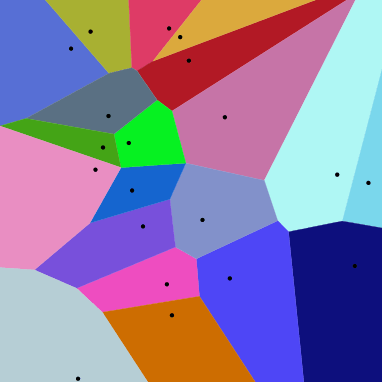
In the simplest case, shown in the first picture, we are given a finite set of points {p1, ..., pn} in the Euclidean plane. In this case each site pk is simply a point, and its corresponding Voronoi cell Rk consists of every point in the Euclidean plane whose distance to pk is less than or equal to its distance to any other pk. Each such cell is obtained from the intersection of half-spaces, and hence it is a convex polygon. The line segments of the Voronoi diagram are all the points in the plane that are equidistant to the two nearest sites. The Voronoi vertices (nodes) are the points equidistant to three (or more) sites.
Formal definition
Let be a metric space with distance function . Let be a set of indices and let be a tuple (ordered collection) of nonempty subsets (the sites) in the space . The Voronoi cell, or Voronoi region, , associated with the site is the set of all points in whose distance to is not greater than their distance to the other sites , where is any index different from . In other words, if denotes the distance between the point and the subset , then
The Voronoi diagram is simply the tuple of cells . In principle, some of the sites can intersect and even coincide (an application is described below for sites representing shops), but usually they are assumed to be disjoint. In addition, infinitely many sites are allowed in the definition (this setting has applications in geometry of numbers and crystallography), but again, in many cases only finitely many sites are considered.
In the particular case where the space is a finite-dimensional Euclidean space, each site is a point, there are finitely many points and all of them are different, then the Voronoi cells are convex polytopes and they can be represented in a combinatorial way using their vertices, sides, two-dimensional faces, etc. Sometimes the induced combinatorial structure is referred to as the Voronoi diagram. In general however, the Voronoi cells may not be convex or even connected.
In the usual Euclidean space, we can rewrite the formal definition in usual terms. Each Voronoi polygon is associated with a generator point . Let be the set of all points in the Euclidean space. Let be a point that generates its Voronoi region , that generates , and that generates , and so on. Then, as expressed by Tran et al[6], "all locations in the Voronoi polygon are closer to the generator point of that polygon than any other generator point in the Voronoi diagram in Euclidean plane".
Illustration
As a simple illustration, consider a group of shops in a city. Suppose we want to estimate the number of customers of a given shop. With all else being equal (price, products, quality of service, etc.), it is reasonable to assume that customers choose their preferred shop simply by distance considerations: they will go to the shop located nearest to them. In this case the Voronoi cell of a given shop can be used for giving a rough estimate on the number of potential customers going to this shop (which is modeled by a point in our city).
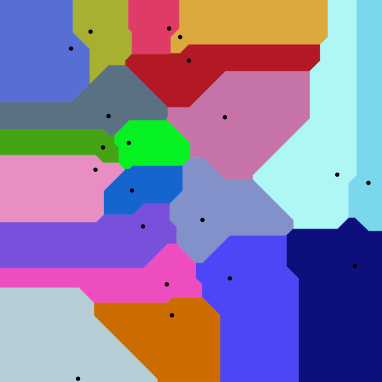
For most cities, the distance between points can be measured using the familiar Euclidean distance:
or the Manhattan distance:
- .
The corresponding Voronoi diagrams look different for different distance metrics.
Properties
- The dual graph for a Voronoi diagram (in the case of a Euclidean space with point sites) corresponds to the Delaunay triangulation for the same set of points.
- The closest pair of points corresponds to two adjacent cells in the Voronoi diagram.
- Assume the setting is the Euclidean plane and a group of different points is given. Then two points are adjacent on the convex hull if and only if their Voronoi cells share an infinitely long side.
- If the space is a normed space and the distance to each site is attained (e.g., when a site is a compact set or a closed ball), then each Voronoi cell can be represented as a union of line segments emanating from the sites.[7] As shown there, this property does not necessarily hold when the distance is not attained.
- Under relatively general conditions (the space is a possibly infinite-dimensional uniformly convex space, there can be infinitely many sites of a general form, etc.) Voronoi cells enjoy a certain stability property: a small change in the shapes of the sites, e.g., a change caused by some translation or distortion, yields a small change in the shape of the Voronoi cells. This is the geometric stability of Voronoi diagrams.[8] As shown there, this property does not hold in general, even if the space is two-dimensional (but non-uniformly convex, and, in particular, non-Euclidean) and the sites are points.
History and research
Informal use of Voronoi diagrams can be traced back to Descartes in 1644. Peter Gustav Lejeune Dirichlet used two-dimensional and three-dimensional Voronoi diagrams in his study of quadratic forms in 1850. British physician John Snow used a Voronoi diagram in 1854 to illustrate how the majority of people who died in the Broad Street cholera outbreak lived closer to the infected Broad Street pump than to any other water pump.
Voronoi diagrams are named after Georgy Feodosievych Voronoy who defined and studied the general n-dimensional case in 1908.[9] Voronoi diagrams that are used in geophysics and meteorology to analyse spatially distributed data (such as rainfall measurements) are called Thiessen polygons after American meteorologist Alfred H. Thiessen. Other equivalent names for this concept (or particular important cases of it): Voronoi polyhedra, Voronoi polygons, domain(s) of influence, Voronoi decomposition, Voronoi tessellation(s), Dirichlet tessellation(s).
Examples
Voronoi tessellations of regular lattices of points in two or three dimensions give rise to many familiar tessellations.
- A 2D lattice gives an irregular honeycomb tessellation, with equal hexagons with point symmetry; in the case of a regular triangular lattice it is regular; in the case of a rectangular lattice the hexagons reduce to rectangles in rows and columns; a square lattice gives the regular tessellation of squares; note that the rectangles and the squares can also be generated by other lattices (for example the lattice defined by the vectors (1,0) and (1/2,1/2) gives squares). See here for a dynamic visual example.
- A simple cubic lattice gives the cubic honeycomb.
- A hexagonal close-packed lattice gives a tessellation of space with trapezo-rhombic dodecahedra.
- A face-centred cubic lattice gives a tessellation of space with rhombic dodecahedra.
- A body-centred cubic lattice gives a tessellation of space with truncated octahedra.
- Parallel planes with regular triangular lattices aligned with each other's centers give the hexagonal prismatic honeycomb.
- Certain body-centered tetragonal lattices give a tessellation of space with rhombo-hexagonal dodecahedra.
For the set of points (x, y) with x in a discrete set X and y in a discrete set Y, we get rectangular tiles with the points not necessarily at their centers.
Higher-order Voronoi diagrams
Although a normal Voronoi cell is defined as the set of points closest to a single point in S, an nth-order Voronoi cell is defined as the set of points having a particular set of n points in S as its n nearest neighbors. Higher-order Voronoi diagrams also subdivide space.
Higher-order Voronoi diagrams can be generated recursively. To generate the nth-order Voronoi diagram from set S, start with the (n − 1)th-order diagram and replace each cell generated by X = {x1, x2, ..., xn−1} with a Voronoi diagram generated on the set S − X.
Farthest-point Voronoi diagram
For a set of n points the (n − 1)th-order Voronoi diagram is called a farthest-point Voronoi diagram.
For a given set of points S = {p1, p2, ..., pn} the farthest-point Voronoi diagram divides the plane into cells in which the same point of P is the farthest point. A point of P has a cell in the farthest-point Voronoi diagram if and only if it is a vertex of the convex hull of P. Let H = {h1, h2, ..., hk} be the convex hull of P; then the farthest-point Voronoi diagram is a subdivision of the plane into k cells, one for each point in H, with the property that a point q lies in the cell corresponding to a site hi if and only if d(q, hi) > d(q, pj) for each pj ∈ S with hi ≠ pj, where d(p, q) is the Euclidean distance between two points p and q.[10][11]
The boundaries of the cells in the farthest-point Voronoi diagram have the structure of a topological tree, with infinite rays as its leaves. Every finite tree is isomorphic to the tree formed in this way from a farthest-point Voronoi diagram.[12]
Generalizations and variations
As implied by the definition, Voronoi cells can be defined for metrics other than Euclidean, such as the Mahalanobis distance or Manhattan distance. However, in these cases the boundaries of the Voronoi cells may be more complicated than in the Euclidean case, since the equidistant locus for two points may fail to be subspace of codimension 1, even in the two-dimensional case.
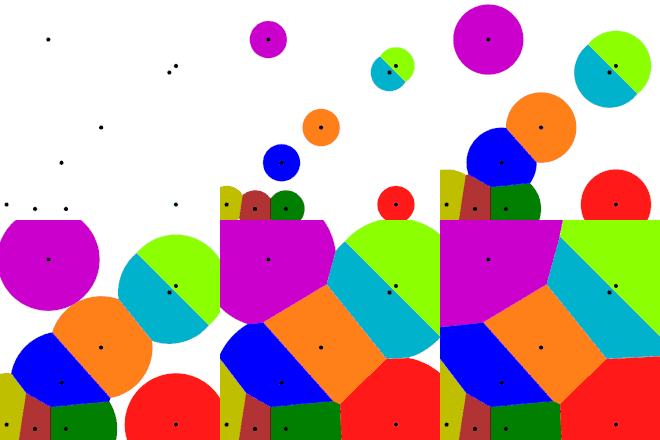
A weighted Voronoi diagram is the one in which the function of a pair of points to define a Voronoi cell is a distance function modified by multiplicative or additive weights assigned to generator points. In contrast to the case of Voronoi cells defined using a distance which is a metric, in this case some of the Voronoi cells may be empty. A power diagram is a type of Voronoi diagram defined from a set of circles using the power distance; it can also be thought of as a weighted Voronoi diagram in which a weight defined from the radius of each circle is added to the squared distance from the circle's center.[13]
The Voronoi diagram of n points in d-dimensional space requires storage space. Therefore, Voronoi diagrams are often not feasible for d > 2. An alternative is to use approximate Voronoi diagrams, where the Voronoi cells have a fuzzy boundary, which can be approximated.[14]
Voronoi diagrams are also related to other geometric structures such as the medial axis (which has found applications in image segmentation, optical character recognition, and other computational applications), straight skeleton, and zone diagrams. Besides points, such diagrams use lines and polygons as seeds. By augmenting the diagram with line segments that connect to nearest points on the seeds, a planar subdivision of the environment is obtained.[15] This structure can be used as a navigation mesh for path-finding through large spaces. The navigation mesh has been generalized to support 3D multi-layered environments, such as an airport or a multi-storey building.[16]
Applications
Humanities
- In classical archaeology respectively art history the symmetry of statue heads is analysed to determine the type of statue a severed head may have belonged to like in the case of the famous Sabouroff head using a high-resolution Polygon mesh.[17][18]
Natural sciences
- In biology, Voronoi diagrams are used to model a number of different biological structures, including cells[19] and bone microarchitecture.[20] Indeed, Voronoi tessellations work as a geometrical tool to understand the physical constraints that drive the organization of biological tissues.[21]
- In hydrology, Voronoi diagrams are used to calculate the rainfall of an area, based on a series of point measurements. In this usage, they are generally referred to as Thiessen polygons.
- In ecology, Voronoi diagrams are used to study the growth patterns of forests and forest canopies, and may also be helpful in developing predictive models for forest fires.
- In computational chemistry, Voronoi cells defined by the positions of the nuclei in a molecule are used to compute atomic charges. This is done using the Voronoi deformation density method.
- In astrophysics, Voronoi diagrams are used to generate adaptative smoothing zones on images, adding signal fluxes on each one. The main objective of these procedures is to maintain a relatively constant signal-to-noise ratio on all the images.
- In computational fluid dynamics, the Voronoi tessellation of a set of points can be used to define the computational domains used in finite volume methods, e.g. as in the moving-mesh cosmology code AREPO.[22]
- In computational physics, Voronoi diagrams are used to calculate profiles of an object with Shadowgraph and proton radiography in High energy density physics.[23]
Health
- In medical diagnosis, models of muscle tissue, based on Voronoi diagrams, can be used to detect neuromuscular diseases.[21]
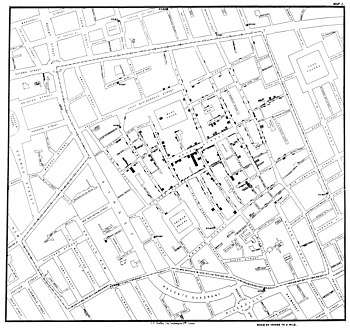 John Snow's original diagram
 - In epidemiology, Voronoi diagrams can be used to correlate sources of infections in epidemics. One of the early applications of Voronoi diagrams was implemented by John Snow to study the 1854 Broad Street cholera outbreak in Soho, England. He showed the correlation between residential areas on the map of Central London whose residents had been using a specific water pump, and the areas with most deaths due to the outbreak.[24]
Engineering
- In polymer physics, Voronoi diagrams can be used to represent free volumes of polymers.
- In materials science, polycrystalline microstructures in metallic alloys are commonly represented using Voronoi tessellations. In island growth, the Voronoi diagram is used to estimate the growth rate of individual islands [25][26][27][28]. In solid-state physics, the Wigner-Seitz cell is the Voronoi tessellation of a solid, and the Brillouin zone is the Voronoi tessellation of reciprocal (wavenumber) space of crystals which have the symmetry of a space group.
- In aviation, Voronoi diagrams are superimposed on oceanic plotting charts to identify the nearest airfield for in-flight diversion (see ETOPS), as an aircraft progresses through its flight plan.
- In architecture, Voronoi patterns were the basis for the winning entry for the redevelopment of The Arts Centre Gold Coast.[29]
- In urban planning, Voronoi diagrams can be used to evaluate the Freight Loading Zone system.[30]
- In mining, Voronoi polygons are used to estimate the reserves of valuable materials, minerals, or other resources. Exploratory drillholes are used as the set of points in the Voronoi polygons.
- In surface metrology, Voronoi tessellation can be used for surface roughness modeling.[31]
Geometry
- A point location data structure can be built on top of the Voronoi diagram in order to answer nearest neighbor queries, where one wants to find the object that is closest to a given query point. Nearest neighbor queries have numerous applications. For example, one might want to find the nearest hospital or the most similar object in a database. A large application is vector quantization, commonly used in data compression.
- In geometry, Voronoi diagrams can be used to find the largest empty circle amid a set of points, and in an enclosing polygon; e.g. to build a new supermarket as far as possible from all the existing ones, lying in a certain city.
- Voronoi diagrams together with farthest-point Voronoi diagrams are used for efficient algorithms to compute the roundness of a set of points.[10] The Voronoi approach is also put to good use in the evaluation of circularity/roundness while assessing the dataset from a coordinate-measuring machine.
- Modern computational geometry has provided efficient algorithms for constructing Voronoi diagrams and has allowed them to be used in mesh generation, point location, cluster analysis, machining plans, and many other computational tasks.[32]
Informatics
- In networking, Voronoi diagrams can be used in derivations of the capacity of a wireless network.
- In computer graphics, Voronoi diagrams are used to calculate 3D shattering / fracturing geometry patterns. It is also used to procedurally generate organic or lava-looking textures.
- In autonomous robot navigation, Voronoi diagrams are used to find clear routes. If the points are obstacles, then the edges of the graph will be the routes furthest from obstacles (and theoretically any collisions).
- In machine learning, Voronoi diagrams are used to do 1-NN classifications.[33]
- In user interface development, Voronoi patterns can be used to compute the best hover state for a given point.[34]
Civics and planning
- In Victoria, Australia, government schools typically admit eligible students to the nearest primary school or high school to where they live.[35]
Bakery
- Ukrainian Pastry chef Dinara Kasko uses the mathematical principles of the Voronoi diagram to create silicone molds made with a 3D printer to shape her original cakes.
Algorithms
Several efficient algorithms are known for constructing Voronoi diagrams, either directly (as the diagram itself) or indirectly by starting with a Delaunay triangulation and then obtaining its dual. Direct algorithms include Fortune's algorithm, an O(n log(n)) algorithm for generating a Voronoi diagram from a set of points in a plane. Bowyer–Watson algorithm, an O(n log(n)) to O(n2) algorithm for generating a Delaunay triangulation in any number of dimensions, can be used in an indirect algorithm for the Voronoi diagram.
Lloyd's algorithm and its generalization via the Linde–Buzo–Gray algorithm (aka k-means clustering), use the construction of Voronoi diagrams as a subroutine. These methods alternate between steps in which one constructs the Voronoi diagram for a set of seed points, and steps in which the seed points are moved to new locations that are more central within their cells. These methods can be used in spaces of arbitrary dimension to iteratively converge towards a specialized form of the Voronoi diagram, called a Centroidal Voronoi tessellation, where the sites have been moved to points that are also the geometric centers of their cells.
Software tools
Voronoi diagrams require a computational step before showing the results. An efficient tool therefore would process the computation in real-time to show a direct result to the user. Many commercial and free applications exist. A particularly practical type of tools are the web-based ones. Web-based tools are easier to access and reference. Also, SVG being a natively supported format by the web, allows at the same time an efficient (GPU accelerated) rendering and is a standard format supported by multiple CAD tools (e.g. Autodesk Fusion360).
- Voronator is a free (Ad based) tool acting on 3D object meshes to apply Voronoi on their surface. Although the tool acts on 3d, the voronoi processing is based on its 2d surface.
- rhill voronoi is as of 2020 the most popular javascript library for 2d voronoi generation, it is open source and has a community of github and npm users, it is also used by multiple other web-based tools. The library tries to provide an efficient javascript computation time to allow real-time tools development. It does not provide svg export, it is rather using canvas. It provides a demo for live Lloyd's algorithm.
- stg voronoi is a github project with simple web application yet offering interactive viewing of voronoi cells when moving the mouse. It also provides an SVG export.
- websvg voronoi is a responsive webapp for voronoi editing and exporting in SVG. It also allows to export and import the seeds coordinates. It is 2d based and it differs from the previously mentioned tools by providing a cells retraction operation, which is not based on scale, rather on edges translation. An edge can be removed if it is consumed by its neighboring edges.
- A.Beutel voronoi is using WebGL and is providing in addition to static viewing, an animated motion of the voronoi cells.
Future of Software tools
Although voronoi is a very old concept, the currently available tools do lack multiple mathematical functions that could add values to these programs. Examples could be usage of a different cost distance than Euclidean, and mainly 3d voronoi algorithms. Although not being software tools themselves, the first reference explains the concept of 3d voronoi and the second is a 3d voronoi library.
- 3D Voronoi Diagrams and Medial Axis
- Voro++ A c++ library for 3d voronoi calculation
See also
Notes
- Burrough, Peter A.; McDonnell, Rachael; McDonnell, Rachael A.; Lloyd, Christopher D. (2015). "8.11 Nearest neighbours: Thiessen (Dirichlet/Voroni) polygons". Principles of Geographical Information Systems. Oxford University Press. pp. 160–. ISBN 978-0-19-874284-5.
- Longley, Paul A.; Goodchild, Michael F.; Maguire, David J.; Rhind, David W. (2005). "14.4.4.1 Thiessen polygons". Geographic Information Systems and Science. Wiley. pp. 333–. ISBN 978-0-470-87001-3.
- Sen, Zekai (2016). "2.8.1 Delaney, Varoni, and Thiessen Polygons". Spatial Modeling Principles in Earth Sciences. Springer. pp. 57–. ISBN 978-3-319-41758-5.
- Aurenhammer, Franz (1991). "Voronoi Diagrams – A Survey of a Fundamental Geometric Data Structure". ACM Computing Surveys. 23 (3): 345–405. doi:10.1145/116873.116880.
- Okabe, Atsuyuki; Boots, Barry; Sugihara, Kokichi; Chiu, Sung Nok (2000). Spatial Tessellations – Concepts and Applications of Voronoi Diagrams (2nd ed.). John Wiley. ISBN 978-0-471-98635-5.
- Tran, Q. T.; Tainar, D.; Safar, M. (2009). Transactions on Large-Scale Data- and Knowledge-Centered Systems. p. 357. ISBN 9783642037214.
- Reem 2009.
- Reem 2011.
- Voronoï 1908a and Voronoï 1908b.
- de Berg, Mark; van Kreveld, Marc; Overmars, Mark; Schwarzkopf, Otfried (2008). Computational Geometry (Third ed.). Springer-Verlag. ISBN 978-3-540-77974-2. 7.4 Farthest-Point Voronoi Diagrams. Includes a description of the algorithm.
- Skyum, Sven (18 February 1991). "A simple algorithm for computing the smallest enclosing circle". Information Processing Letters. 37 (3): 121–125. doi:10.1016/0020-0190(91)90030-L., contains a simple algorithm to compute the farthest-point Voronoi diagram.
- Biedl, Therese; Grimm, Carsten; Palios, Leonidas; Shewchuk, Jonathan; Verdonschot, Sander (2016). "Realizing farthest-point Voronoi diagrams". Proceedings of the 28th Canadian Conference on Computational Geometry (CCCG 2016).
- Edelsbrunner, Herbert (2012) [1987]. "13.6 Power Diagrams". Algorithms in Combinatorial Geometry. EATCS Monographs on Theoretical Computer Science. 10. Springer-Verlag. pp. 327–328. ISBN 9783642615689..
- Sunil Arya, Sunil; Malamatos, Theocharis; Mount, David M. (2002). "Space-efficient approximate Voronoi diagrams". Proceedings of the thiry-fourth annual ACM symposium on Theory of computing. pp. 721–730. doi:10.1145/509907.510011. ISBN 1581134959.
- Geraerts, Roland (2010), Planning Short Paths with Clearance using Explicit Corridors (PDF), International Conference on Robotics and Automation, IEEE, pp. 1997–2004.
- van Toll, Wouter G.; Cook IV, Atlas F.; Geraerts, Roland (2011), Navigation Meshes for Realistic Multi-Layered Environments (PDF), International Conference on Intelligent Robots and Systems, IEEE/RSJ, pp. 3526–32.
- Hölscher, Tonio; Krömker, Susanne; Mara, Hubert (2020), "Der Kopf Sabouroff in Berlin: Zwischen archäologischer Beobachtung und geometrischer Vermessung", Gedenkschrift für Georgios Despinis (in German), Athens, Greece: Benaki Museum
- Voronoi Cells & Geodesic Distances - Sabouroff head on YouTube. Analysis using the GigaMesh Software Framework as described by Hölscher et al. cf. doi:10.11588/heidok.00027985.
- Bock, Martin; Tyagi, Amit Kumar; Kreft, Jan-Ulrich; Alt, Wolfgang (2009). "Generalized Voronoi Tessellation as a Model of Two-dimensional Cell Tissue Dynamics". Bulletin of Mathematical Biology. 72 (7): 1696–1731. arXiv:0901.4469v1. Bibcode:2009arXiv0901.4469B. doi:10.1007/s11538-009-9498-3. PMID 20082148.
- Hui Li (2012). Baskurt, Atilla M; Sitnik, Robert (eds.). "Spatial Modeling of Bone Microarchitecture". Three-Dimensional Image Processing (3Dip) and Applications Ii. 8290: 82900P. Bibcode:2012SPIE.8290E..0PL. doi:10.1117/12.907371.
- Sanchez-Gutierrez, D.; Tozluoglu, M.; Barry, J. D.; Pascual, A.; Mao, Y.; Escudero, L. M. (2016-01-04). "Fundamental physical cellular constraints drive self-organization of tissues". The EMBO Journal. 35 (1): 77–88. doi:10.15252/embj.201592374. PMC 4718000. PMID 26598531.
- Springel, Volker (2010). "E pur si muove: Galilean-invariant cosmological hydrodynamical simulations on a moving mesh". MNRAS. 401 (2): 791–851. arXiv:0901.4107. Bibcode:2010MNRAS.401..791S. doi:10.1111/j.1365-2966.2009.15715.x.
- Kasim, Muhammad Firmansyah (2017-01-01). "Quantitative shadowgraphy and proton radiography for large intensity modulations". Physical Review E. 95 (2): 023306. arXiv:1607.04179. Bibcode:2017PhRvE..95b3306K. doi:10.1103/PhysRevE.95.023306. PMID 28297858.
- Steven Johnson (19 October 2006). The Ghost Map: The Story of London's Most Terrifying Epidemic — and How It Changed Science, Cities, and the Modern World. Penguin Publishing Group. p. 187. ISBN 978-1-101-15853-1. Retrieved 16 October 2017.
- Mulheran, P. A.; Blackman, J. A. (1996). "Capture zones and scaling in homogeneous thin-film growth". Physical Review B. 53 (15): 10261–7. Bibcode:1996PhRvB..5310261M. doi:10.1103/PhysRevB.53.10261. PMID 9982595.
- Pimpinelli, Alberto; Tumbek, Levent; Winkler, Adolf (2014). "Scaling and Exponent Equalities in Island Nucleation: Novel Results and Application to Organic Films". The Journal of Physical Chemistry Letters. 5 (6): 995–8. doi:10.1021/jz500282t. PMC 3962253. PMID 24660052.
- Fanfoni, M.; Placidi, E.; Arciprete, F.; Orsini, E.; Patella, F.; Balzarotti, A. (2007). "Sudden nucleation versus scale invariance of InAs quantum dots on GaAs". Physical Review B. 75 (24): 245312. Bibcode:2007PhRvB..75x5312F. doi:10.1103/PhysRevB.75.245312. ISSN 1098-0121.
- Miyamoto, Satoru; Moutanabbir, Oussama; Haller, Eugene E.; Itoh, Kohei M. (2009). "Spatial correlation of self-assembled isotopically pure Ge/Si(001) nanoislands". Physical Review B. 79 (165415): 165415. Bibcode:2009PhRvB..79p5415M. doi:10.1103/PhysRevB.79.165415. ISSN 1098-0121.
- "GOLD COAST CULTURAL PRECINCT". ARM Architecture.
- Lopez, C.; Zhao, C.-L.; Magniol, S; Chiabaut, N; Leclercq, L (28 February 2019). "Microscopic Simulation of Cruising for Parking of Trucks as a Measure to Manage Freight Loading Zone". Sustainability. 11 (5), 1276.
- Singh, K.; Sadeghi, F.; Correns, M.; Blass, T. (December 2019). "A microstructure based approach to model effects of surface roughness on tensile fatigue". International Journal of Fatigue. 129: 105229. doi:10.1016/j.ijfatigue.2019.105229.
- Wolfram, Stephen (2002). A New Kind of Science. Wolfram Media, Inc. p. 987. ISBN 978-1-57955-008-0.
- Mitchell, Tom M. (1997). Machine Learning (International ed.). McGraw-Hill. p. 233. ISBN 978-0-07-042807-2.
- "User Interface Algorithms".
- "Restrictions and boundaries". www.education.vic.gov.au. Retrieved 2017-11-19.
References
- Aurenhammer, Franz; Klein, Rolf; Lee, Der-Tsai (2013). Voronoi Diagrams and Delaunay Triangulations. World Scientific. ISBN 978-9814447638.
- Bowyer, Adrian (1981). "Computing Dirichlet tessellations". Comput. J. 24 (2): 162–166. doi:10.1093/comjnl/24.2.162.
- de Berg, Mark; van Kreveld, Marc; Overmars, Mark; Schwarzkopf, Otfried (2000). "7. Voronoi Diagrams". Computational Geometry (2nd revised ed.). Springer. pp. 47–163. ISBN 978-3-540-65620-3. Includes a description of Fortune's algorithm.
- Klein, Rolf (1989). "Abstract Voronoi diagrams and their applications". Computational Geometry and its Applications. Lecture Notes in Computer Science. 333. Springer. pp. 148–157. doi:10.1007/3-540-50335-8_31. ISBN 978-3-540-52055-9.
- Lejeune Dirichlet, G. (1850). "Über die Reduktion der positiven quadratischen Formen mit drei unbestimmten ganzen Zahlen". Journal für die Reine und Angewandte Mathematik. 1850 (40): 209–227. doi:10.1515/crll.1850.40.209.
- Okabe, Atsuyuki; Boots, Barry; Sugihara, Kokichi; Chiu, Sung Nok (2000). Spatial Tessellations — Concepts and Applications of Voronoi Diagrams (2nd ed.). Wiley. ISBN 0-471-98635-6.
- Reem, Daniel (2009). "An algorithm for computing Voronoi diagrams of general generators in general normed spaces". Proceedings of the Sixth International Symposium on Voronoi Diagrams in Science and Engineering (ISVD 2009). pp. 144–152. doi:10.1109/ISVD.2009.23.CS1 maint: ref=harv (link)
- Reem, Daniel (2011). "The geometric stability of Voronoi diagrams with respect to small changes of the sites". Proceedings of the 27th Annual ACM Symposium on Computational Geometry (SoCG): 254–263. arXiv:1103.4125. Bibcode:2011arXiv1103.4125R. doi:10.1145/1998196.1998234. ISBN 9781450306829.CS1 maint: ref=harv (link)
- Voronoï, Georges (1908a). "Nouvelles applications des paramètres continus à la théorie des formes quadratiques. Premier mémoire. Sur quelques propriétés des formes quadratiques positives parfaites" (PDF). Journal für die Reine und Angewandte Mathematik. 1908 (133): 97–178.
- Voronoï, Georges (1908b). "Nouvelles applications des paramètres continus à la théorie des formes quadratiques. Deuxième mémoire. Recherches sur les parallélloèdres primitifs" (PDF). Journal für die Reine und Angewandte Mathematik. 1908 (134): 198–287.
- Watson, David F. (1981). "Computing the n-dimensional Delaunay tessellation with application to Voronoi polytopes". Comput. J. 24 (2): 167–172. doi:10.1093/comjnl/24.2.167.
External links
| Wikimedia Commons has media related to Voronoi diagrams. |
- Real time interactive Voronoi and Delaunay diagrams with source code
- Demo for various metrics
- Mathworld on Voronoi diagrams
- Voronoi Diagrams: Applications from Archaeology to Zoology
- Voronoi Diagrams in CGAL, the Computational Geometry Algorithms Library
- More discussions and picture gallery on centroidal Voronoi tessellations
- Voronoi Diagrams by Ed Pegg, Jr., Jeff Bryant, and Theodore Gray, Wolfram Demonstrations Project.
- A Voronoi diagram on a sphere, in 3d, and others
- Plot a Voronoi diagram with Mathematica
- Voronoi Tessellation – Interactive Voronoi tessellation with D3.js
- Interactive Voronoi diagram and natural neighbor interpolation visualization (WebGL)
