1972 United States presidential election in Alabama
The 1972 United States presidential election in Alabama was held on November 7, 1972. Incumbent President Richard Nixon won Alabama, winning 72.43% of the vote to George McGovern's 25.54%. This is also the best showing in the state by a Republican presidential candidate. As of the 2016 presidential election, this is the last election in which Dallas County, Hale County, Russell County, and Perry County voted for the Republican candidate.[2]
| ||||||||||||||||||||||||||
All 9 Alabama electoral votes to the Electoral College | ||||||||||||||||||||||||||
|---|---|---|---|---|---|---|---|---|---|---|---|---|---|---|---|---|---|---|---|---|---|---|---|---|---|---|
| ||||||||||||||||||||||||||
 County Results
| ||||||||||||||||||||||||||
| ||||||||||||||||||||||||||
| Elections in Alabama | ||||||||
|---|---|---|---|---|---|---|---|---|
 | ||||||||
|
||||||||
|
||||||||
|
| ||||||||
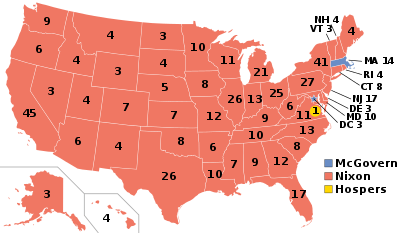
With 72.43% of the popular vote, Alabama would prove to be Nixon's fourth strongest state in the 1972 election after Mississippi, Georgia and Oklahoma.[3]
Results
| Party | Nominee | Popular Vote | Percentage | Electoral Vote |
|---|---|---|---|---|
| Republican | Richard Nixon | 728,701 | 72.43% | 9 |
| Democratic/ National Democratic[lower-alpha 1] |
George McGovern | 256,923 | 25.54% | 0 |
| AL Conservative | John G. Schmitz | 11,918 | 1.18% | 0 |
| AL Prohibition | E. Harold Munn | 8,551 | 0.85% | 0 |
Result by county
| Richard Milhous Nixon Republican |
George Stanley McGovern[lower-alpha 1] Democratic/ National Democratic |
Various candidates Other parties |
Margin | Total votes cast | |||||
|---|---|---|---|---|---|---|---|---|---|
| County | # | % | # | % | # | % | # | % | |
| Autauga | 5,367 | 75.17% | 1,593 | 22.31% | 180 | 2.52% | 3,774 | 52.86% | 7,140 |
| Baldwin | 15,104 | 82.20% | 2,923 | 15.91% | 348 | 1.89% | 12,181 | 66.29% | 18,375 |
| Barbour | 4,985 | 70.92% | 1,846 | 26.26% | 198 | 2.82% | 3,139 | 44.66% | 7,029 |
| Bibb | 3,332 | 78.44% | 837 | 19.70% | 79 | 1.86% | 2,495 | 58.73% | 4,248 |
| Blount | 6,486 | 79.36% | 1,582 | 19.36% | 105 | 1.28% | 4,904 | 60.00% | 8,173 |
| Bullock | 2,178 | 47.44% | 2,321 | 50.56% | 92 | 2.00% | -143 | -3.11% | 4,591 |
| Butler | 4,685 | 76.45% | 1,401 | 22.86% | 42 | 0.69% | 3,284 | 53.59% | 6,128 |
| Calhoun | 20,364 | 76.93% | 5,832 | 22.03% | 275 | 1.04% | 14,532 | 54.90% | 26,471 |
| Chambers | 8,716 | 79.21% | 2,076 | 18.87% | 211 | 1.92% | 6,640 | 60.35% | 11,003 |
| Cherokee | 3,179 | 71.89% | 1,182 | 26.73% | 61 | 1.38% | 1,997 | 45.16% | 4,422 |
| Chilton | 7,349 | 82.88% | 1,356 | 15.29% | 162 | 1.83% | 5,993 | 67.59% | 8,867 |
| Choctaw | 3,055 | 60.74% | 1,934 | 38.45% | 41 | 0.82% | 1,121 | 22.29% | 5,030 |
| Clarke | 5,256 | 70.89% | 2,031 | 27.39% | 127 | 1.71% | 3,225 | 43.50% | 7,414 |
| Clay | 3,948 | 88.24% | 507 | 11.33% | 19 | 0.42% | 3,441 | 76.91% | 4,474 |
| Cleburne | 3,420 | 85.20% | 581 | 14.47% | 13 | 0.32% | 2,839 | 70.73% | 4,014 |
| Coffee | 9,076 | 80.06% | 2,160 | 19.05% | 100 | 0.88% | 6,916 | 61.01% | 11,336 |
| Colbert | 11,215 | 67.71% | 4,811 | 29.04% | 538 | 3.25% | 6,404 | 38.66% | 16,564 |
| Conecuh | 3,214 | 74.81% | 1,042 | 24.26% | 40 | 0.93% | 2,172 | 50.56% | 4,296 |
| Coosa | 2,672 | 77.20% | 773 | 22.33% | 16 | 0.46% | 1,899 | 54.87% | 3,461 |
| Covington | 9,278 | 85.27% | 1,547 | 14.22% | 56 | 0.51% | 7,731 | 71.05% | 10,881 |
| Crenshaw | 3,129 | 72.87% | 1,085 | 25.27% | 80 | 1.86% | 2,044 | 47.60% | 4,294 |
| Cullman | 14,390 | 79.54% | 3,571 | 19.74% | 130 | 0.72% | 10,819 | 59.80% | 18,091 |
| Dale | 8,346 | 83.14% | 1,594 | 15.88% | 98 | 0.98% | 6,752 | 67.26% | 10,038 |
| Dallas | 8,644 | 60.53% | 5,427 | 38.00% | 209 | 1.46% | 3,217 | 22.53% | 14,280 |
| DeKalb | 9,434 | 71.27% | 3,759 | 28.40% | 44 | 0.33% | 5,675 | 42.87% | 13,237 |
| Elmore | 8,461 | 79.90% | 1,891 | 17.86% | 238 | 2.25% | 6,570 | 62.04% | 10,590 |
| Escambia | 7,883 | 82.19% | 1,598 | 16.66% | 110 | 1.15% | 6,285 | 65.53% | 9,591 |
| Etowah | 20,851 | 72.95% | 7,372 | 25.79% | 358 | 1.25% | 13,479 | 47.16% | 28,581 |
| Fayette | 4,240 | 83.53% | 836 | 16.47% | 0 | 0.00% | 3,404 | 67.06% | 5,076 |
| Franklin | 5,877 | 75.23% | 1,840 | 23.55% | 95 | 1.22% | 4,037 | 51.68% | 7,812 |
| Geneva | 5,851 | 84.33% | 1,049 | 15.12% | 38 | 0.55% | 4,802 | 69.21% | 6,938 |
| Greene | 1,404 | 29.65% | 3,235 | 68.32% | 96 | 2.03% | -1,831 | -38.67% | 4,735 |
| Hale | 2,859 | 59.22% | 1,779 | 36.85% | 190 | 3.94% | 1,080 | 22.37% | 4,828 |
| Henry | 3,414 | 79.56% | 853 | 19.88% | 24 | 0.56% | 2,561 | 59.68% | 4,291 |
| Houston | 12,622 | 83.46% | 2,358 | 15.59% | 144 | 0.95% | 10,264 | 67.87% | 15,124 |
| Jackson | 6,202 | 65.91% | 2,985 | 31.72% | 223 | 2.37% | 3,217 | 34.19% | 9,410 |
| Jefferson | 135,095 | 68.05% | 57,288 | 28.86% | 6,145 | 3.10% | 77,807 | 39.19% | 198,528 |
| Lamar | 3,283 | 80.56% | 766 | 18.80% | 26 | 0.64% | 2,517 | 61.77% | 4,075 |
| Lauderdale | 14,410 | 71.66% | 5,112 | 25.42% | 586 | 2.91% | 9,298 | 46.24% | 20,108 |
| Lawrence | 4,433 | 75.61% | 1,416 | 24.15% | 14 | 0.24% | 3,017 | 51.46% | 5,863 |
| Lee | 11,571 | 74.94% | 3,622 | 23.46% | 248 | 1.61% | 7,949 | 51.48% | 15,441 |
| Limestone | 6,188 | 73.21% | 2,079 | 24.60% | 185 | 2.19% | 4,109 | 48.62% | 8,452 |
| Lowndes | 1,990 | 42.69% | 2,559 | 54.90% | 112 | 2.40% | -569 | -12.21% | 4,661 |
| Macon | 1,931 | 33.04% | 3,636 | 62.21% | 278 | 4.76% | -1,705 | -29.17% | 5,845 |
| Madison | 38,899 | 73.42% | 13,108 | 24.74% | 977 | 1.84% | 25,791 | 48.68% | 52,984 |
| Marengo | 5,156 | 65.05% | 2,645 | 33.37% | 125 | 1.58% | 2,511 | 31.68% | 7,926 |
| Marion | 5,927 | 85.38% | 986 | 14.20% | 29 | 0.42% | 4,941 | 71.18% | 6,942 |
| Marshall | 12,090 | 74.45% | 3,894 | 23.98% | 254 | 1.56% | 8,196 | 50.47% | 16,238 |
| Mobile | 62,639 | 73.15% | 20,694 | 24.17% | 2,301 | 2.69% | 41,945 | 48.98% | 85,634 |
| Monroe | 5,155 | 74.82% | 1,636 | 23.74% | 99 | 1.44% | 3,519 | 51.07% | 6,890 |
| Montgomery | 35,353 | 71.86% | 12,723 | 25.86% | 1,121 | 2.28% | 22,630 | 46.00% | 49,197 |
| Morgan | 18,100 | 76.85% | 5,004 | 21.25% | 449 | 1.91% | 13,096 | 55.60% | 23,553 |
| Perry | 2,800 | 49.13% | 2,718 | 47.69% | 181 | 3.18% | 82 | 1.44% | 5,699 |
| Pickens | 4,071 | 67.33% | 1,933 | 31.97% | 42 | 0.69% | 2,138 | 35.36% | 6,046 |
| Pike | 5,690 | 76.66% | 1,624 | 21.88% | 108 | 1.46% | 4,066 | 54.78% | 7,422 |
| Randolph | 4,427 | 75.14% | 1,330 | 22.57% | 135 | 2.29% | 3,097 | 52.56% | 5,892 |
| Russell | 6,034 | 66.73% | 2,644 | 29.24% | 365 | 4.04% | 3,390 | 37.49% | 9,043 |
| St. Clair | 6,952 | 79.82% | 1,538 | 17.66% | 220 | 2.53% | 5,414 | 62.16% | 8,710 |
| Shelby | 9,390 | 81.24% | 1,859 | 16.08% | 309 | 2.67% | 7,531 | 65.16% | 11,558 |
| Sumter | 2,686 | 49.19% | 2,737 | 50.12% | 38 | 0.70% | -51 | -0.93% | 5,461 |
| Talladega | 12,763 | 73.12% | 4,567 | 26.16% | 125 | 0.72% | 8,196 | 46.96% | 17,455 |
| Tallapoosa | 8,535 | 78.71% | 2,113 | 19.49% | 195 | 1.80% | 6,422 | 59.23% | 10,843 |
| Tuscaloosa | 21,172 | 70.15% | 8,272 | 27.41% | 735 | 2.44% | 12,900 | 42.74% | 30,179 |
| Walker | 14,581 | 78.79% | 3,724 | 20.12% | 202 | 1.09% | 10,857 | 58.66% | 18,507 |
| Washington | 3,282 | 74.73% | 1,096 | 24.95% | 14 | 0.32% | 2,186 | 49.77% | 4,392 |
| Wilcox | 2,641 | 44.42% | 3,254 | 54.74% | 50 | 0.84% | -613 | -10.31% | 5,945 |
| Winston | 4,971 | 86.14% | 779 | 13.50% | 21 | 0.36% | 4,192 | 72.64% | 5,771 |
| Totals | 728,701 | 72.43% | 256,923 | 25.54% | 20,469 | 2.03% | 471,778 | 46.89% | 1,006,093 |
Notes
- The McGovern vote was actually a fusion of two distinct electoral tickets with different electors both pledged to vote for him. One was of the regular Democratic Party and the other of the National Democratic Party of Alabama. At least 219,108 votes were cast for the Democratic ticket and at least 37,815 for the National Democratic ticket,[1] though this sum differs from that in Dave Leip’s Atlas.
References
- Our Campaigns; AL US President 1972
- Sullivan, Robert David; ‘How the Red and Blue Map Evolved Over the Past Century’; America Magazine in The National Catholic Review; June 29, 2016
- "1972 Presidential Election Statistics". Dave Leip’s Atlas of U.S. Presidential Elections. Retrieved 2018-03-05.
- Dave Leip’s U.S. Election Atlas; 1972 Presidential General Election Results – Alabama
This article is issued from Wikipedia. The text is licensed under Creative Commons - Attribution - Sharealike. Additional terms may apply for the media files.