1940 United States presidential election in Alabama
The 1940 United States presidential election in Alabama took place on November 5, 1940, as part of the 1940 United States presidential election. Alabama voters chose 11 representatives, or electors, to the Electoral College, who voted for president and vice president.
| ||||||||||||||||||||||||||
| ||||||||||||||||||||||||||
 County Results
| ||||||||||||||||||||||||||
| ||||||||||||||||||||||||||


| Elections in Alabama | ||||||||
|---|---|---|---|---|---|---|---|---|
 | ||||||||
|
||||||||
|
||||||||
|
| ||||||||
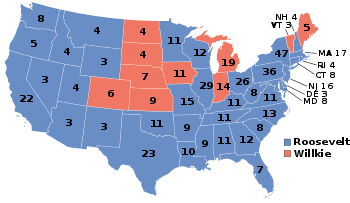
Alabama was won in a landslide by incumbent President Franklin D. Roosevelt (D–New York), running with Secretary of Agriculture Henry A. Wallace of Iowa with 85.22% of the popular vote, against corporate lawyer Wendell Willkie (R–New York), running with Senate Minority Leader Charles L. McNary of Oregon, with 14.34% of the popular vote, for a Democratic margin of 70.88%. Third party candidates only managed to pick up 0.44% of the vote. [1]
Results
| Party | Candidate | Votes | % | |
|---|---|---|---|---|
| Democratic | Franklin D. Roosevelt (inc.) | 250,726 | 85.22 | |
| Republican | Wendell Willkie | 42,184 | 14.34 | |
| Prohibition | Roger Babson | 700 | 0.24 | |
| Communist | Earl Browder | 501 | 0.17 | |
| Socialist | Norman Thomas | 100 | 0.03 | |
| Total votes | 294,211 | 100% | ||
Results by county
| County | Franklin Delano Roosevelt
Democratic |
Wendell Lewis Willkie
Republican |
Other candidates
Various parties |
Total votes cast[2] | |||
|---|---|---|---|---|---|---|---|
| # | % | # | % | # | % | ||
| Autauga | 1,630 | 93.62% | 99 | 5.69% | 12 | 0.69% | 1,741 |
| Baldwin | 2,681 | 76.58% | 617 | 17.62% | 203 | 5.80% | 3,501 |
| Barbour | 2,328 | 95.88% | 90 | 3.71% | 10 | 0.41% | 2,428 |
| Bibb | 1,821 | 90.51% | 173 | 8.60% | 18 | 0.89% | 2,012 |
| Blount | 2,784 | 75.71% | 855 | 23.25% | 38 | 1.03% | 3,677 |
| Bullock | 1,301 | 98.64% | 18 | 1.36% | 0 | 0.00% | 1,319 |
| Butler | 2,732 | 97.99% | 52 | 1.87% | 4 | 0.14% | 2,788 |
| Calhoun | 4,408 | 86.89% | 645 | 12.71% | 20 | 0.39% | 5,073 |
| Chambers | 4,141 | 97.16% | 110 | 2.58% | 11 | 0.26% | 4,262 |
| Cherokee | 2,617 | 86.94% | 381 | 12.66% | 12 | 0.40% | 3,010 |
| Chilton | 2,746 | 57.80% | 1,995 | 41.99% | 10 | 0.21% | 4,751 |
| Choctaw | 2,023 | 96.52% | 73 | 3.48% | 0 | 0.00% | 2,096 |
| Clarke | 3,753 | 98.71% | 48 | 1.26% | 1 | 0.03% | 3,802 |
| Clay | 2,153 | 71.22% | 854 | 28.25% | 16 | 0.53% | 3,023 |
| Cleburne | 1,369 | 75.72% | 434 | 24.00% | 5 | 0.28% | 1,808 |
| Coffee | 2,226 | 93.88% | 145 | 6.12% | 0 | 0.00% | 2,371 |
| Colbert | 3,998 | 91.47% | 365 | 8.35% | 8 | 0.18% | 4,371 |
| Conecuh | 2,345 | 97.71% | 50 | 2.08% | 5 | 0.21% | 2,400 |
| Coosa | 1,347 | 80.32% | 317 | 18.90% | 13 | 0.78% | 1,677 |
| Covington | 4,635 | 96.08% | 186 | 3.86% | 3 | 0.06% | 4,824 |
| Crenshaw | 2,680 | 96.65% | 84 | 3.03% | 9 | 0.32% | 2,773 |
| Cullman | 5,603 | 64.51% | 3,057 | 35.19% | 26 | 0.30% | 8,686 |
| Dale | 2,543 | 87.03% | 374 | 12.80% | 5 | 0.17% | 2,922 |
| Dallas | 3,106 | 95.10% | 157 | 4.81% | 3 | 0.09% | 3,266 |
| DeKalb | 5,432 | 65.77% | 2,810 | 34.02% | 17 | 0.21% | 8,259 |
| Elmore | 4,267 | 96.54% | 144 | 3.26% | 9 | 0.20% | 4,420 |
| Escambia | 2,772 | 95.03% | 137 | 4.70% | 8 | 0.27% | 2,917 |
| Etowah | 7,012 | 84.33% | 1,270 | 15.27% | 33 | 0.40% | 8,315 |
| Fayette | 2,091 | 73.42% | 737 | 25.88% | 20 | 0.70% | 2,848 |
| Franklin | 3,523 | 63.67% | 1,989 | 35.95% | 21 | 0.38% | 5,533 |
| Geneva | 2,565 | 87.19% | 364 | 12.37% | 13 | 0.44% | 2,942 |
| Greene | 894 | 92.07% | 77 | 7.93% | 0 | 0.00% | 971 |
| Hale | 1,691 | 98.14% | 32 | 1.86% | 0 | 0.00% | 1,723 |
| Henry | 1,960 | 96.50% | 69 | 3.40% | 2 | 0.10% | 2,031 |
| Houston | 3,941 | 88.78% | 483 | 10.88% | 15 | 0.34% | 4,439 |
| Jackson | 3,818 | 80.01% | 945 | 19.80% | 9 | 0.19% | 4,772 |
| Jefferson | 37,110 | 84.34% | 6,714 | 15.26% | 177 | 0.40% | 44,001 |
| Lamar | 2,665 | 90.28% | 275 | 9.32% | 12 | 0.41% | 2,952 |
| Lauderdale | 5,065 | 90.35% | 507 | 9.04% | 34 | 0.61% | 5,606 |
| Lawrence | 2,277 | 82.23% | 480 | 17.33% | 12 | 0.43% | 2,769 |
| Lee | 2,566 | 95.96% | 103 | 3.85% | 5 | 0.19% | 2,674 |
| Limestone | 2,941 | 96.58% | 95 | 3.12% | 9 | 0.30% | 3,045 |
| Lowndes | 1,132 | 98.86% | 12 | 1.05% | 1 | 0.09% | 1,145 |
| Macon | 1,259 | 96.77% | 41 | 3.15% | 1 | 0.08% | 1,301 |
| Madison | 5,515 | 90.44% | 566 | 9.28% | 17 | 0.28% | 6,098 |
| Marengo | 2,284 | 96.94% | 70 | 2.97% | 2 | 0.08% | 2,356 |
| Marion | 2,654 | 69.64% | 1,081 | 28.37% | 76 | 1.99% | 3,811 |
| Marshall | 4,142 | 81.55% | 913 | 17.98% | 24 | 0.47% | 5,079 |
| Mobile | 11,480 | 85.08% | 1,887 | 13.99% | 126 | 0.93% | 13,493 |
| Monroe | 2,953 | 98.17% | 40 | 1.33% | 15 | 0.50% | 3,008 |
| Montgomery | 11,311 | 97.74% | 230 | 1.99% | 32 | 0.28% | 11,573 |
| Morgan | 5,345 | 90.93% | 500 | 8.51% | 33 | 0.56% | 5,878 |
| Perry | 1,509 | 97.17% | 39 | 2.51% | 5 | 0.32% | 1,553 |
| Pickens | 1,714 | 92.00% | 140 | 7.51% | 9 | 0.48% | 1,863 |
| Pike | 3,049 | 95.94% | 121 | 3.81% | 8 | 0.25% | 3,178 |
| Randolph | 2,407 | 77.92% | 670 | 21.69% | 12 | 0.39% | 3,089 |
| Russell | 2,435 | 97.95% | 48 | 1.93% | 3 | 0.12% | 2,486 |
| St. Clair | 2,462 | 61.18% | 1,540 | 38.27% | 22 | 0.55% | 4,024 |
| Shelby | 2,777 | 74.61% | 938 | 25.20% | 7 | 0.19% | 3,722 |
| Sumter | 1,404 | 96.76% | 46 | 3.17% | 1 | 0.07% | 1,451 |
| Talladega | 3,965 | 87.88% | 534 | 11.84% | 13 | 0.29% | 4,512 |
| Tallapoosa | 4,325 | 96.65% | 139 | 3.11% | 11 | 0.25% | 4,475 |
| Tuscaloosa | 6,284 | 93.35% | 426 | 6.33% | 22 | 0.33% | 6,732 |
| Walker | 5,940 | 74.52% | 2,007 | 25.18% | 24 | 0.30% | 7,971 |
| Washington | 1,892 | 95.65% | 80 | 4.04% | 6 | 0.30% | 1,978 |
| Wilcox | 1,534 | 98.71% | 20 | 1.29% | 0 | 0.00% | 1,554 |
| Winston | 1,394 | 45.10% | 1,686 | 54.55% | 11 | 0.36% | 3,091 |
| Totals | 250,726 | 85.22% | 42,184 | 14.34% | 1,309 | 0.44% | 294,219 |
References
- https://uselectionatlas.org/RESULTS/state.php?year=1940&fips=1&f=0&off=0&elect=0&minper=0
- Scammon, Richard M. (compiler); America at the Polls: A Handbook of Presidential Election Statistics 1920-1964; pp. 29-30 ISBN 0405077114