1972 United States presidential election in Mississippi
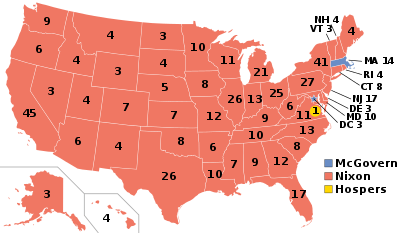
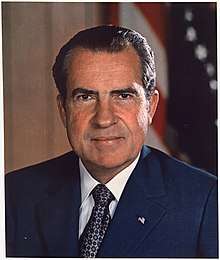
The 1972 United States presidential election in Mississippi was held on November 7, 1972. Incumbent President Nixon won the state of Mississippi with 78.20% of the vote, his most overwhelming dominance in any of the fifty states, carrying the Magnolia State's seven electoral votes.[1] Nixon defeated McGovern by a whopping margin of 58.57%, a larger margin than McGovern's in the District of Columbia, and a margin never equalled in any state since and exceeded by any Republican nominee in the party's history only five times.[lower-alpha 1] This also marked the first time since 1944 that the state was on the winning side of the presidential election.
| ||||||||||||||||||||||||||
| ||||||||||||||||||||||||||
 County results
| ||||||||||||||||||||||||||
| ||||||||||||||||||||||||||
| Elections in Mississippi | ||||||
|---|---|---|---|---|---|---|
.svg.png) | ||||||
|
||||||
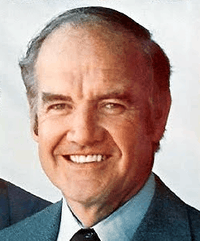
McGovern carried only three counties – Claiborne, Holmes and Jefferson – all of which have overwhelming majority black populations. In archconservative, racially sensitive[2] Mississippi, McGovern was universally viewed as a left-wing extremist because of his support for busing and civil rights, plus his opposition to the Vietnam War, support for granting amnesty to draft dodgers[3] and support for a thousand-dollar giveaway to each American as a solution to poverty.[4] Many, especially Republican campaigners, also believed McGovern would legalize abortion and illicit drugs if he were elected[5] – despite the fact that his running mate Sargent Shriver was firmly pro-life.
Consequently, the proportion of white voters supporting McGovern was utterly negligible, and even the newly enfranchised and loyally Democratic African-American population did not accept McGovern's radical ideas, with the result that for the second time in three elections one of the historically strongest members of the former Democratic Solid South became the most Republican state in the nation. Even in a huge landslide, Mississippi voted 34% more Republican than the nation at-large.[6] As of the 2016 presidential election, this is the last election in which the following counties voted for a Republican presidential candidate: Marshall, Quitman, Bolivar, Sharkey, Wilkinson, Humphreys, Coahoma, Noxubee, and Tunica.[7]
Results
| 1972 United States presidential election in Mississippi[1] | |||||
|---|---|---|---|---|---|
| Party | Candidate | Votes | Percentage | Electoral votes | |
| Republican | Richard Nixon (incumbent) | 505,125 | 78.20% | 7 | |
| Democrat | George McGovern | 126,782 | 19.63% | 0 | |
| Independent | John Schmitz | 11,598 | 1.80% | 0 | |
| Independent | Linda Jenness | 2,458 | 0.38% | 0 | |
| Totals | 645,963 | 100.0% | 7 | ||
Results by county
| Richard Milhous Nixon Republican |
George Stanley McGovern Democratic |
Various candidates Other parties |
Margin | Total votes cast | |||||
|---|---|---|---|---|---|---|---|---|---|
| County | # | % | # | % | # | % | # | % | # |
| Adams | 8,500 | 67.16% | 3,697 | 29.21% | 460 | 3.63% | 4,803 | 37.95% | 12,657 |
| Alcorn | 5,732 | 83.28% | 982 | 14.27% | 169 | 2.46% | 4,750 | 69.01% | 6,883 |
| Amite | 2,846 | 68.94% | 1,185 | 28.71% | 97 | 2.35% | 1,661 | 40.24% | 4,128 |
| Attala | 4,738 | 79.50% | 1,103 | 18.51% | 119 | 2.00% | 3,635 | 60.99% | 5,960 |
| Benton | 1,483 | 66.35% | 701 | 31.36% | 51 | 2.28% | 782 | 34.99% | 2,235 |
| Bolivar | 7,397 | 66.12% | 3,616 | 32.32% | 174 | 1.56% | 3,781 | 33.80% | 11,187 |
| Calhoun | 3,023 | 90.37% | 245 | 7.32% | 77 | 2.30% | 2,778 | 83.05% | 3,345 |
| Carroll | 1,777 | 73.31% | 580 | 23.93% | 67 | 2.76% | 1,197 | 49.38% | 2,424 |
| Chickasaw | 3,753 | 84.66% | 579 | 13.06% | 101 | 2.28% | 3,174 | 71.60% | 4,433 |
| Choctaw | 2,301 | 86.57% | 326 | 12.26% | 31 | 1.17% | 1,975 | 74.30% | 2,658 |
| Claiborne | 1,521 | 41.76% | 2,076 | 57.00% | 45 | 1.24% | -555 | -15.24% | 3,642 |
| Clarke | 4,561 | 81.56% | 954 | 17.06% | 77 | 1.38% | 3,607 | 64.50% | 5,592 |
| Clay | 4,035 | 71.39% | 1,410 | 24.95% | 207 | 3.66% | 2,625 | 46.44% | 5,652 |
| Coahoma | 6,602 | 61.56% | 3,708 | 34.57% | 415 | 3.87% | 2,894 | 26.98% | 10,725 |
| Copiah | 5,498 | 73.11% | 1,803 | 23.98% | 219 | 2.91% | 3,695 | 49.14% | 7,520 |
| Covington | 3,842 | 84.09% | 642 | 14.05% | 85 | 1.86% | 3,200 | 70.04% | 4,569 |
| DeSoto | 7,917 | 80.88% | 1,557 | 15.91% | 315 | 3.22% | 6,360 | 64.97% | 9,789 |
| Forrest | 14,418 | 80.56% | 2,933 | 16.39% | 547 | 3.06% | 11,485 | 64.17% | 17,898 |
| Franklin | 2,361 | 78.73% | 561 | 18.71% | 77 | 2.57% | 1,800 | 60.02% | 2,999 |
| George | 3,979 | 92.90% | 270 | 6.30% | 34 | 0.79% | 3,709 | 86.60% | 4,283 |
| Greene | 2,884 | 83.52% | 513 | 14.86% | 56 | 1.62% | 2,371 | 68.66% | 3,453 |
| Grenada | 4,800 | 75.09% | 1,471 | 23.01% | 121 | 1.89% | 3,329 | 52.08% | 6,392 |
| Hancock | 5,133 | 86.28% | 745 | 12.52% | 71 | 1.19% | 4,388 | 73.76% | 5,949 |
| Harrison | 28,962 | 84.02% | 4,761 | 13.81% | 747 | 2.17% | 24,201 | 70.21% | 34,470 |
| Hinds | 49,877 | 77.82% | 12,679 | 19.78% | 1,540 | 2.40% | 37,198 | 58.03% | 64,096 |
| Holmes | 3,158 | 47.23% | 3,459 | 51.73% | 69 | 1.03% | -301 | -4.50% | 6,686 |
| Humphreys | 2,334 | 69.01% | 892 | 26.37% | 156 | 4.61% | 1,442 | 42.64% | 3,382 |
| Issaquena | 701 | 60.80% | 395 | 34.26% | 57 | 4.94% | 306 | 26.54% | 1,153 |
| Itawamba | 4,419 | 89.20% | 509 | 10.27% | 26 | 0.52% | 3,910 | 78.93% | 4,954 |
| Jackson | 22,204 | 88.68% | 2,534 | 10.12% | 300 | 1.20% | 19,670 | 78.56% | 25,038 |
| Jasper | 3,597 | 78.47% | 935 | 20.40% | 52 | 1.13% | 2,662 | 58.07% | 4,584 |
| Jefferson | 1,131 | 43.37% | 1,457 | 55.87% | 20 | 0.77% | -326 | -12.50% | 2,608 |
| Jefferson Davis | 2,830 | 72.83% | 1,005 | 25.86% | 51 | 1.31% | 1,825 | 46.96% | 3,886 |
| Jones | 16,489 | 83.79% | 2,790 | 14.18% | 400 | 2.03% | 13,699 | 69.61% | 19,679 |
| Kemper | 2,748 | 75.25% | 837 | 22.92% | 67 | 1.83% | 1,911 | 52.33% | 3,652 |
| Lafayette | 5,391 | 76.89% | 1,545 | 22.04% | 75 | 1.07% | 3,846 | 54.86% | 7,011 |
| Lamar | 5,022 | 88.38% | 493 | 8.68% | 167 | 2.94% | 4,529 | 79.71% | 5,682 |
| Lauderdale | 18,337 | 81.79% | 3,453 | 15.40% | 630 | 2.81% | 14,884 | 66.39% | 22,420 |
| Lawrence | 3,394 | 81.70% | 709 | 17.07% | 51 | 1.23% | 2,685 | 64.64% | 4,154 |
| Leake | 4,217 | 79.13% | 1,053 | 19.76% | 59 | 1.11% | 3,164 | 59.37% | 5,329 |
| Lee | 10,730 | 82.60% | 1,632 | 12.56% | 629 | 4.84% | 9,098 | 70.03% | 12,991 |
| Leflore | 6,779 | 75.58% | 2,038 | 22.72% | 152 | 1.69% | 4,741 | 52.86% | 8,969 |
| Lincoln | 7,593 | 86.01% | 1,070 | 12.12% | 165 | 1.87% | 6,523 | 73.89% | 8,828 |
| Lowndes | 10,098 | 78.70% | 2,398 | 18.69% | 335 | 2.61% | 7,700 | 60.01% | 12,831 |
| Madison | 5,047 | 57.20% | 3,464 | 39.26% | 313 | 3.55% | 1,583 | 17.94% | 8,824 |
| Marion | 6,805 | 79.40% | 1,693 | 19.75% | 72 | 0.84% | 5,112 | 59.65% | 8,570 |
| Marshall | 3,326 | 62.10% | 1,875 | 35.01% | 155 | 2.89% | 1,451 | 27.09% | 5,356 |
| Monroe | 7,273 | 84.10% | 1,279 | 14.79% | 96 | 1.11% | 5,994 | 69.31% | 8,648 |
| Montgomery | 3,210 | 76.32% | 925 | 21.99% | 71 | 1.69% | 2,285 | 54.33% | 4,206 |
| Neshoba | 6,815 | 88.22% | 812 | 10.51% | 98 | 1.27% | 6,003 | 77.71% | 7,725 |
| Newton | 5,585 | 88.05% | 597 | 9.41% | 161 | 2.54% | 4,988 | 78.64% | 6,343 |
| Noxubee | 2,239 | 66.28% | 1,052 | 31.14% | 87 | 2.58% | 1,187 | 35.14% | 3,378 |
| Oktibbeha | 6,160 | 75.56% | 1,880 | 23.06% | 113 | 1.39% | 4,280 | 52.50% | 8,153 |
| Panola | 5,284 | 70.61% | 2,091 | 27.94% | 108 | 1.44% | 3,193 | 42.67% | 7,483 |
| Pearl River | 7,487 | 88.04% | 901 | 10.60% | 116 | 1.36% | 6,586 | 77.45% | 8,504 |
| Perry | 2,689 | 84.14% | 446 | 13.95% | 61 | 1.91% | 2,243 | 70.18% | 3,196 |
| Pike | 6,542 | 72.08% | 2,332 | 25.69% | 202 | 2.23% | 4,210 | 46.39% | 9,076 |
| Pontotoc | 4,476 | 89.45% | 488 | 9.75% | 40 | 0.80% | 3,988 | 79.70% | 5,004 |
| Prentiss | 4,607 | 91.12% | 398 | 7.87% | 51 | 1.01% | 4,209 | 83.25% | 5,056 |
| Quitman | 2,524 | 74.41% | 790 | 23.29% | 78 | 2.30% | 1,734 | 51.12% | 3,392 |
| Rankin | 12,187 | 85.19% | 1,913 | 13.37% | 205 | 1.43% | 10,274 | 71.82% | 14,305 |
| Scott | 5,244 | 79.95% | 1,213 | 18.49% | 102 | 1.56% | 4,031 | 61.46% | 6,559 |
| Sharkey | 1,426 | 67.94% | 655 | 31.21% | 18 | 0.86% | 771 | 36.73% | 2,099 |
| Simpson | 5,669 | 85.87% | 871 | 13.19% | 62 | 0.94% | 4,798 | 72.67% | 6,602 |
| Smith | 4,419 | 92.35% | 329 | 6.88% | 37 | 0.77% | 4,090 | 85.48% | 4,785 |
| Stone | 2,467 | 88.49% | 293 | 10.51% | 28 | 1.00% | 2,174 | 77.98% | 2,788 |
| Sunflower | 5,389 | 73.27% | 1,874 | 25.48% | 92 | 1.25% | 3,515 | 47.79% | 7,355 |
| Tallahatchie | 3,442 | 77.37% | 835 | 18.77% | 172 | 3.87% | 2,607 | 58.60% | 4,449 |
| Tate | 3,966 | 75.74% | 1,151 | 21.98% | 119 | 2.27% | 2,815 | 53.76% | 5,236 |
| Tippah | 3,937 | 85.87% | 569 | 12.41% | 79 | 1.72% | 3,368 | 73.46% | 4,585 |
| Tishomingo | 4,177 | 89.23% | 443 | 9.46% | 61 | 1.30% | 3,734 | 79.77% | 4,681 |
| Tunica | 1,446 | 62.19% | 858 | 36.90% | 21 | 0.90% | 588 | 25.29% | 2,325 |
| Union | 5,477 | 87.91% | 658 | 10.56% | 95 | 1.52% | 4,819 | 77.35% | 6,230 |
| Walthall | 3,110 | 79.66% | 747 | 19.13% | 47 | 1.20% | 2,363 | 60.53% | 3,904 |
| Warren | 10,420 | 71.97% | 3,480 | 24.04% | 578 | 3.99% | 6,940 | 47.93% | 14,478 |
| Washington | 9,634 | 63.78% | 4,623 | 30.61% | 847 | 5.61% | 5,011 | 33.18% | 15,104 |
| Wayne | 4,648 | 82.08% | 975 | 17.22% | 40 | 0.71% | 3,673 | 64.86% | 5,663 |
| Webster | 3,624 | 89.15% | 403 | 9.91% | 38 | 0.93% | 3,221 | 79.24% | 4,065 |
| Wilkinson | 1,608 | 52.65% | 1,409 | 46.14% | 37 | 1.21% | 199 | 6.52% | 3,054 |
| Winston | 5,155 | 78.64% | 1,354 | 20.66% | 46 | 0.70% | 3,801 | 57.99% | 6,555 |
| Yalobusha | 2,944 | 77.53% | 797 | 20.99% | 56 | 1.47% | 2,147 | 56.54% | 3,797 |
| Yazoo | 5,555 | 72.58% | 2,008 | 26.23% | 91 | 1.19% | 3,547 | 46.34% | 7,654 |
| Totals | 505,125 | 78.20% | 126,782 | 19.63% | 14,056 | 2.18% | 378,343 | 58.57% | 645,963 |
References
- "1972 Presidential General Election Results - Mississippi". Retrieved May 13, 2016.
- Grantham, Dewey W.; The South in Modern America: A Region at Odds; pp. 247-248 ISBN 1610753895
- Perry, James Moorhead; Us and Them: How the Press Covered the 1972 Election, p. 136 ISBN 0517505525
- Grantham, Dewey W.; The Life and Death of the Solid South: A Political History, p. 179 ISBN 0813148723
- Davis, Lanny; Scandal: How "Gotcha" Politics Is Destroying America, pp. 65-66 ISBN 1466892803
- "1972 Presidential Election Statistics". Dave Leip’s Atlas of U.S. Presidential Elections. Retrieved 2018-03-05.
- Sullivan, Robert David; ‘How the Red and Blue Map Evolved Over the Past Century’; America Magazine in The National Catholic Review; June 29, 2016
Notes
- Barry Goldwater won Mississippi by 74.28 percentage points over Lyndon Johnson in 1964, William McKinley won Vermont by 63.42 percentage points over William Jennings Bryan in 1896, Calvin Coolidge won Vermont by 62.55 percentage points and Michigan by 62.24 percentage points over John W. Davis in 1924, and Warren G. Harding won North Dakota by 59.60 percentage points over James M. Cox in 1920.