1980 United States presidential election in Alabama
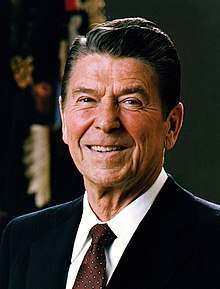
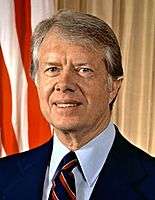
The United States presidential election in Alabama was held on November 4, 1980. Former California Governor Ronald Reagan narrowly won the state and its 9 electoral votes, winning 48.8% to Incumbent President Jimmy Carter’s 47.5%. John B. Anderson came in third place, winning 1.23%.
| ||||||||||||||||||||||||||
All 9 Alabama Electoral Votes to the Electoral College | ||||||||||||||||||||||||||
|---|---|---|---|---|---|---|---|---|---|---|---|---|---|---|---|---|---|---|---|---|---|---|---|---|---|---|
| ||||||||||||||||||||||||||
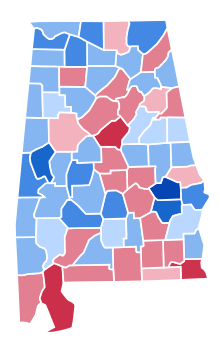 County Results
| ||||||||||||||||||||||||||
| ||||||||||||||||||||||||||
| Elections in Alabama | ||||||||
|---|---|---|---|---|---|---|---|---|
 | ||||||||
|
||||||||
|
||||||||
|
| ||||||||
Reagan's margin of victory largely rested upon his strong performances in Mobile and Baldwin counties along the Gulf Coast, and Jefferson and Shelby counties in the Birmingham metropolitan area. Reagan also won three counties home to large cities: Madison (Huntsville), Montgomery and Tuscaloosa. In contrast, Carter’s local appeal remained strong in the more rural counties of the state (except Winston County, a Republican bastion since the late 19th Century), and he won overwhelming victories in the Black Belt, where Carter’s 80.10% in Macon County was the highest proportion he received in any county nationwide.[1]
The 1980 election would set up Alabama to become a Republican stronghold for future presidential elections, after having been part of the Democratic Solid South for most of its statehood since 1824. As of the 2016 presidential election, this is the last election in which Limestone County, Morgan County, Marshall County, Talladega County, Cullman County, Tallapoosa County, Bibb County, Randolph County, Henry County, Lamar County, and Clay County voted for the Democratic candidate.[2]
Results
| Party | Nominee | Popular Vote | Percentage | Electoral Vote |
|---|---|---|---|---|
| Republican | Ronald Reagan | 654,192 | 48.75% | 9 |
| Democratic | Jimmy Carter | 636,730 | 47.45% | 0 |
| Independent | John B. Anderson | 16,481 | 1.23% | 0 |
| AL Conservative | John Rarick | 15,010 | 1.12% | 0 |
| Libertarian | Edward Clark | 13,318 | 0.99% | 0 |
| N/A | All Others | 6,198 | 0.46% | 0 |
Result by county
| County | Ronald Wilson Reagan
Republican |
James Earl Carter
Democratic |
John B. Anderson
Independent |
Other candidates
Various parties |
Total votes cast | ||||
|---|---|---|---|---|---|---|---|---|---|
| # | % | # | % | # | % | # | % | ||
| Autauga | 6,292 | 56.87% | 4,295 | 38.82% | 125 | 1.13% | 351 | 3.17% | 11,063 |
| Baldwin | 18,652 | 65.78% | 8,448 | 29.80% | 414 | 1.46% | 839 | 2.96% | 28,353 |
| Barbour | 4,171 | 46.34% | 4,458 | 49.53% | 65 | 0.72% | 307 | 3.41% | 9,001 |
| Bibb | 2,491 | 44.30% | 3,097 | 55.08% | 22 | 0.39% | 13 | 0.23% | 5,623 |
| Blount | 6,819 | 53.59% | 5,656 | 44.45% | 75 | 0.59% | 174 | 1.37% | 12,724 |
| Bullock | 1,446 | 25.65% | 3,960 | 70.25% | 29 | 0.51% | 202 | 3.58% | 5,637 |
| Butler | 3,810 | 45.53% | 4,156 | 49.67% | 59 | 0.71% | 343 | 4.10% | 8,368 |
| Calhoun | 17,475 | 49.17% | 17,017 | 47.88% | 433 | 1.22% | 616 | 1.73% | 35,541 |
| Chambers | 4,864 | 40.88% | 6,649 | 55.88% | 122 | 1.03% | 264 | 2.22% | 11,899 |
| Cherokee | 2,482 | 38.55% | 3,764 | 58.47% | 63 | 0.98% | 129 | 2.00% | 6,438 |
| Chilton | 6,615 | 57.64% | 4,706 | 41.00% | 60 | 0.52% | 96 | 0.84% | 11,477 |
| Choctaw | 2,859 | 43.45% | 3,680 | 55.93% | 22 | 0.33% | 19 | 0.29% | 6,580 |
| Clarke | 5,059 | 47.44% | 5,249 | 49.23% | 55 | 0.52% | 300 | 2.81% | 10,663 |
| Clay | 2,764 | 48.09% | 2,858 | 49.73% | 34 | 0.59% | 91 | 1.58% | 5,747 |
| Cleburne | 2,389 | 52.78% | 2,050 | 45.29% | 34 | 0.75% | 53 | 1.17% | 4,526 |
| Coffee | 6,760 | 50.45% | 6,140 | 45.82% | 189 | 1.41% | 310 | 2.31% | 13,399 |
| Colbert | 6,619 | 33.07% | 12,550 | 62.71% | 209 | 1.04% | 635 | 3.17% | 20,013 |
| Conecuh | 2,948 | 47.69% | 3,102 | 50.19% | 29 | 0.47% | 102 | 1.65% | 6,181 |
| Coosa | 1,714 | 40.72% | 2,383 | 56.62% | 19 | 0.45% | 93 | 2.21% | 4,209 |
| Covington | 7,014 | 51.54% | 6,305 | 46.33% | 110 | 0.81% | 179 | 1.32% | 13,608 |
| Crenshaw | 2,478 | 47.15% | 2,704 | 51.45% | 39 | 0.74% | 35 | 0.67% | 5,256 |
| Cullman | 10,212 | 45.92% | 11,525 | 51.82% | 228 | 1.03% | 275 | 1.24% | 22,240 |
| Dale | 7,247 | 57.64% | 4,936 | 39.26% | 134 | 1.07% | 256 | 2.04% | 12,573 |
| Dallas | 7,647 | 42.14% | 9,770 | 53.84% | 131 | 0.72% | 599 | 3.30% | 18,147 |
| DeKalb | 9,673 | 51.75% | 8,820 | 47.19% | 107 | 0.57% | 90 | 0.48% | 18,690 |
| Elmore | 8,688 | 57.20% | 5,947 | 39.15% | 171 | 1.13% | 384 | 2.53% | 15,190 |
| Escambia | 6,513 | 54.04% | 5,148 | 42.71% | 87 | 0.72% | 305 | 2.53% | 12,053 |
| Etowah | 16,177 | 42.79% | 20,790 | 54.99% | 358 | 0.95% | 481 | 1.27% | 37,806 |
| Fayette | 3,315 | 48.83% | 3,389 | 49.92% | 47 | 0.69% | 38 | 0.56% | 6,789 |
| Franklin | 4,448 | 41.33% | 6,136 | 57.01% | 51 | 0.47% | 128 | 1.19% | 10,763 |
| Geneva | 4,747 | 49.30% | 4,703 | 48.85% | 67 | 0.70% | 111 | 1.15% | 9,628 |
| Greene | 1,034 | 22.79% | 3,474 | 76.55% | 16 | 0.35% | 14 | 0.31% | 4,538 |
| Hale | 2,074 | 34.69% | 3,583 | 59.93% | 56 | 0.94% | 266 | 4.45% | 5,979 |
| Henry | 2,813 | 47.85% | 2,973 | 50.57% | 18 | 0.31% | 75 | 1.28% | 5,879 |
| Houston | 14,884 | 64.05% | 7,848 | 33.77% | 184 | 0.79% | 322 | 1.39% | 23,238 |
| Jackson | 4,897 | 34.48% | 8,776 | 61.79% | 156 | 1.10% | 374 | 2.63% | 14,203 |
| Jefferson | 132,612 | 51.10% | 113,069 | 43.57% | 3,509 | 1.35% | 10,322 | 3.98% | 259,512 |
| Lamar | 2,778 | 44.91% | 3,366 | 54.41% | 16 | 0.26% | 26 | 0.42% | 6,186 |
| Lauderdale | 10,467 | 38.42% | 15,379 | 56.45% | 431 | 1.58% | 966 | 3.55% | 27,243 |
| Lawrence | 2,456 | 28.09% | 6,112 | 69.92% | 64 | 0.73% | 110 | 1.26% | 8,742 |
| Lee | 10,982 | 49.98% | 9,606 | 43.72% | 643 | 2.93% | 741 | 3.37% | 21,972 |
| Limestone | 4,574 | 34.18% | 8,180 | 61.12% | 183 | 1.37% | 447 | 3.34% | 13,384 |
| Lowndes | 1,524 | 28.60% | 3,577 | 67.12% | 15 | 0.28% | 213 | 4.00% | 5,329 |
| Macon | 1,259 | 14.35% | 7,028 | 80.10% | 36 | 0.41% | 451 | 5.14% | 8,774 |
| Madison | 30,604 | 47.03% | 30,469 | 46.82% | 2,246 | 3.45% | 1,753 | 2.69% | 65,072 |
| Marengo | 4,048 | 41.90% | 5,178 | 53.60% | 35 | 0.36% | 399 | 4.13% | 9,660 |
| Marion | 5,182 | 48.26% | 5,450 | 50.75% | 61 | 0.57% | 45 | 0.42% | 10,738 |
| Marshall | 8,159 | 40.93% | 10,854 | 54.45% | 283 | 1.42% | 637 | 3.20% | 19,933 |
| Mobile | 67,515 | 57.71% | 46,180 | 39.47% | 1,333 | 1.14% | 1,964 | 1.68% | 116,992 |
| Monroe | 4,615 | 50.87% | 4,262 | 46.98% | 43 | 0.47% | 152 | 1.68% | 9,072 |
| Montgomery | 35,745 | 53.75% | 28,018 | 42.13% | 985 | 1.48% | 1,756 | 2.64% | 66,504 |
| Morgan | 13,214 | 45.14% | 14,703 | 50.23% | 457 | 1.56% | 897 | 3.06% | 29,271 |
| Perry | 2,262 | 34.68% | 4,208 | 64.52% | 28 | 0.43% | 24 | 0.37% | 6,522 |
| Pickens | 3,582 | 43.78% | 4,504 | 55.05% | 61 | 0.75% | 35 | 0.43% | 8,182 |
| Pike | 5,220 | 52.25% | 4,417 | 44.21% | 83 | 0.83% | 271 | 2.71% | 9,991 |
| Randolph | 3,279 | 46.22% | 3,378 | 47.62% | 58 | 0.82% | 379 | 5.34% | 7,094 |
| Russell | 4,485 | 33.22% | 8,123 | 60.17% | 137 | 1.01% | 755 | 5.59% | 13,500 |
| St. Clair | 7,768 | 56.89% | 5,236 | 38.35% | 121 | 0.89% | 529 | 3.87% | 13,654 |
| Shelby | 14,957 | 64.28% | 7,396 | 31.79% | 407 | 1.75% | 507 | 2.18% | 23,267 |
| Sumter | 2,104 | 29.23% | 5,015 | 69.66% | 45 | 0.63% | 35 | 0.49% | 7,199 |
| Talladega | 9,902 | 47.97% | 10,159 | 49.22% | 140 | 0.68% | 440 | 2.13% | 20,641 |
| Tallapoosa | 5,958 | 43.80% | 7,260 | 53.37% | 96 | 0.71% | 289 | 2.12% | 13,603 |
| Tuscaloosa | 19,750 | 48.50% | 19,103 | 46.91% | 789 | 1.94% | 1,078 | 2.65% | 40,720 |
| Walker | 8,795 | 38.53% | 13,616 | 59.65% | 82 | 0.36% | 335 | 1.47% | 22,828 |
| Washington | 3,045 | 45.96% | 3,520 | 53.13% | 24 | 0.36% | 36 | 0.54% | 6,625 |
| Wilcox | 2,280 | 31.40% | 4,951 | 68.19% | 13 | 0.18% | 17 | 0.23% | 7,261 |
| Winston | 4,981 | 59.04% | 3,368 | 39.92% | 39 | 0.46% | 48 | 0.57% | 8,436 |
| Totals | 654,192 | 48.75% | 636,730 | 47.45% | 16,481 | 1.23% | 34,526 | 2.57% | 1,341,929 |
References
- Dave Leip’s U.S. Election Atlas; 1980 Presidential Election Statistics
- Sullivan, Robert David; ‘How the Red and Blue Map Evolved Over the Past Century’; America Magazine in The National Catholic Review; June 29, 2016
- "1980 Presidential General Election Results - Alabama". U.S. Election Atlas.