Tallapoosa County, Alabama
Tallapoosa County is located in the east central portion of the U.S. state of Alabama.[1] As of the 2010 census, the population was 41,616.[2] Its county seat is Dadeville.[3]
Tallapoosa County | |
|---|---|
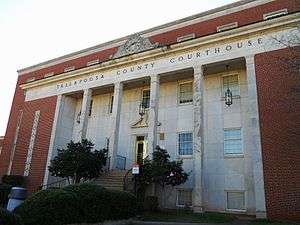 County courthouse in Dadeville | |
 Location within the U.S. state of Alabama | |
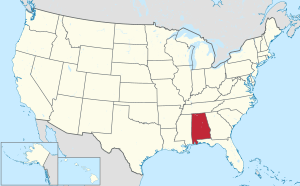 Alabama's location within the U.S. | |
| Coordinates: 32°51′41″N 85°47′50″W | |
| Country | |
| State | |
| Founded | December 18, 1832[1] |
| Seat | Dadeville |
| Largest city | Alexander City |
| Area | |
| • Total | 766 sq mi (1,980 km2) |
| • Land | 717 sq mi (1,860 km2) |
| • Water | 50 sq mi (100 km2) 6.5%% |
| Population (2010) | |
| • Total | 41,616 |
| • Estimate (2019) | 40,367 |
| • Density | 54/sq mi (21/km2) |
| Time zone | UTC−6 (Central) |
| • Summer (DST) | UTC−5 (CDT) |
| Congressional district | 3rd |
| Website | www |
| |
History
The name Tallapoosa is of Creek origin; many Creek villages were located along the banks of the lower river before Indian Removal in the 19th century. Tallapoosa County was established by European Americans on December 18, 1832.[1] A southwest strip of the county was detached to become a portion of Elmore County when it was established on February 15, 1866.
Geography
According to the U.S. Census Bureau, the county has a total area of 766 square miles (1,980 km2), of which 717 square miles (1,860 km2) is land and 50 square miles (130 km2) (6.5%) is water.[4] The county is located in the Piedmont region of the state.
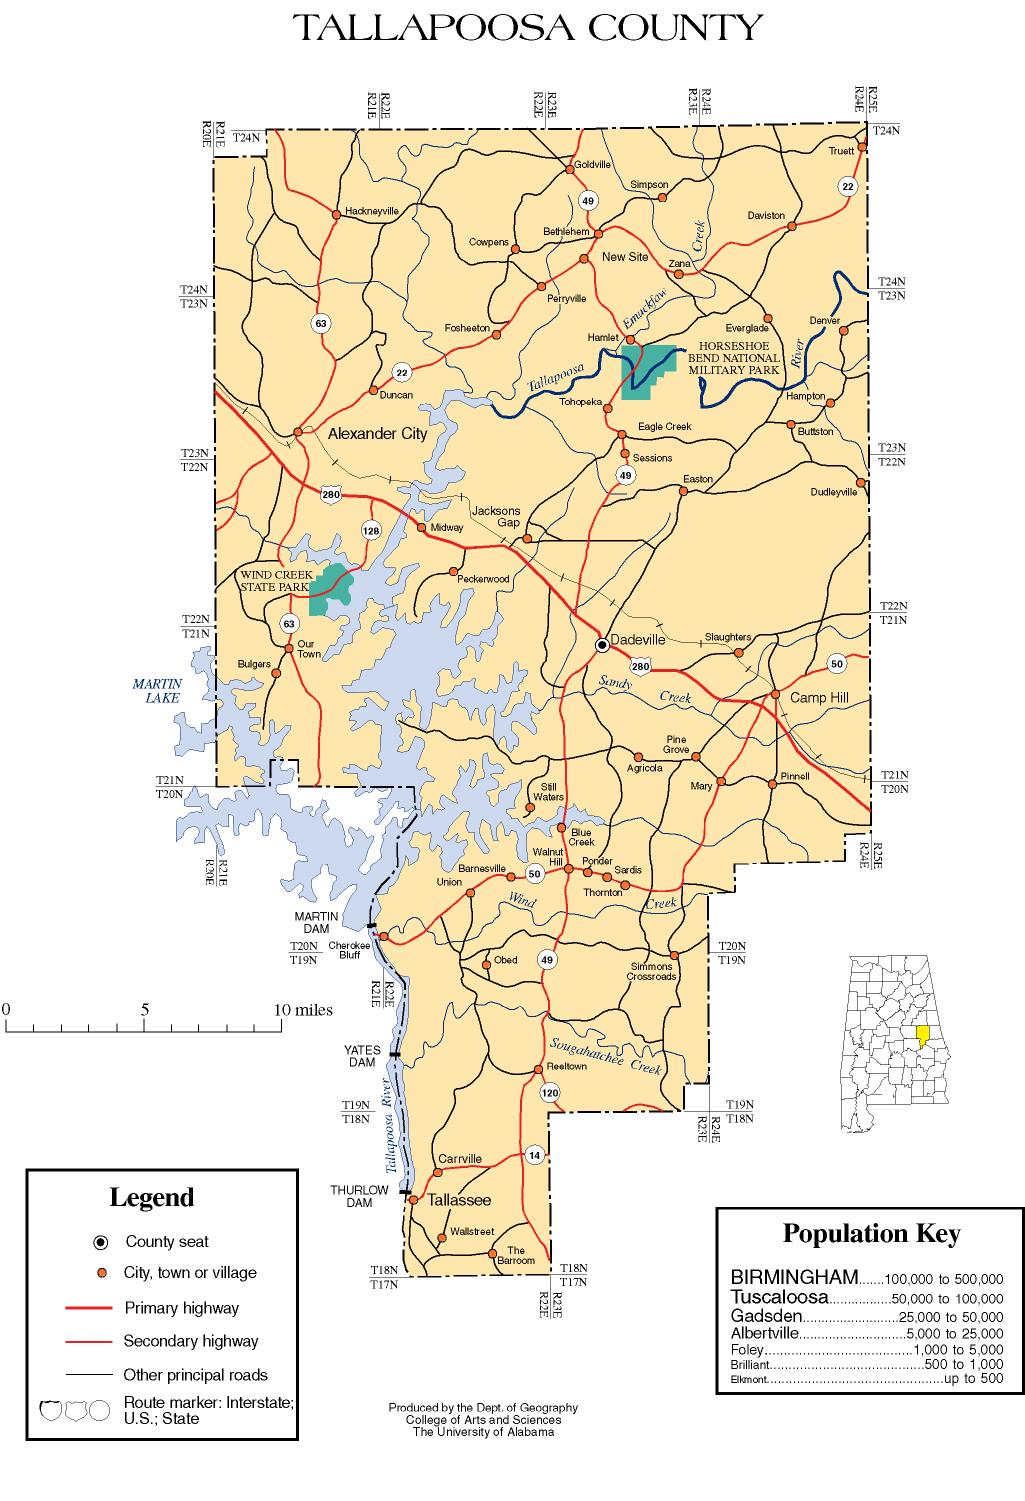
The county is intersected by the Tallapoosa River.[5]
Major highways


Adjacent counties
- Clay County (north)
- Randolph County (northeast)
- Chambers County (east)
- Lee County (southeast)
- Macon County (south)
- Elmore County (southwest)
- Coosa County (west)
National protected area
Demographics
| Historical population | |||
|---|---|---|---|
| Census | Pop. | %± | |
| 1840 | 6,444 | — | |
| 1850 | 15,584 | 141.8% | |
| 1860 | 23,827 | 52.9% | |
| 1870 | 16,963 | −28.8% | |
| 1880 | 23,401 | 38.0% | |
| 1890 | 25,460 | 8.8% | |
| 1900 | 29,675 | 16.6% | |
| 1910 | 31,034 | 4.6% | |
| 1920 | 29,744 | −4.2% | |
| 1930 | 31,188 | 4.9% | |
| 1940 | 35,270 | 13.1% | |
| 1950 | 35,074 | −0.6% | |
| 1960 | 35,007 | −0.2% | |
| 1970 | 33,840 | −3.3% | |
| 1980 | 38,766 | 14.6% | |
| 1990 | 38,826 | 0.2% | |
| 2000 | 41,475 | 6.8% | |
| 2010 | 41,616 | 0.3% | |
| Est. 2019 | 40,367 | [6] | −3.0% |
| U.S. Decennial Census[7] 1790–1960[8] 1900–1990[9] 1990–2000[10] 2010–2018[2] | |||
At the 2000 census there were 41,475 people, 16,656 households, and 11,809 families living in the county. The population density was 58 people per square mile (22/km2). There were 20,510 housing units at an average density of 29 per square mile (11/km2). The racial makeup of the county was 73.48% White, 25.36% Black or African American, 0.26% Native American, 0.18% Asian, 0.01% Pacific Islander, 0.17% from other races, and 0.54% from two or more races. Nearly 0.58% of the population were Hispanic or Latino of any race.[11] There were 16,656 households, 29.90% had children under the age of 18 living with them, 53.00% were married couples living together, 14.30% had a female householder with no husband present, and 29.10% were non-families. Nearly 26.50% of households were made up of individuals, and 11.60% were one person aged 65 or older. The average household size was 2.44, and the average family size was 2.94.
The age distribution was 24.20% under the age of 18, 7.60% from 18 to 24, 26.70% from 25 to 44, 24.90% from 45 to 64, and 16.60% 65 or older. The median age was 39 years. For every 100 females, there were 90.50 males. For every 100 females age 18 and over, there were 86.10 males.
The median household income was $30,745 and the median family income was $38,148. Males had a median income of $28,557 versus $19,885 for females. The per capita income for the county was $16,909. About 13.50% of families and 16.60% of the population were below the poverty line, including 24.30% of those under age 18 and 15.60% of those age 65 or over.
2010 census
At the 2010 census there were 41,616 people, 16,985 households, and 11,762 families living in the county. The population density was 58 people per square mile (22/km2). There were 22,111 housing units at an average density of 31 per square mile (12/km2). The racial makeup of the county was 69.9% White, 26.6% Black or African American, 0.3% Native American, 0.5% Asian, 0% Pacific Islander, 1.7% from other races, and 1.0% from two or more races. Nearly 2.5% of the population were Hispanic or Latino of any race.[12] There were 16,985 households, 25.6% had children under the age of 18 living with them, 48.4% were married couples living together, 15.9% had a female householder with no husband present, and 30.8% were non-families. Nearly 27.2% of households were made up of individuals, and 11.4% were one person aged 65 or older. The average household size was 2.42, and the average family size was 2.91.
The age distribution was 22.2% under the age of 18, 8.0% from 18 to 24, 23.3% from 25 to 44, 29.2% from 45 to 64, and 17.3% 65 or older. The median age was 42.4 years. For every 100 females, there were 94.2 males. For every 100 females age 18 and over, there were 95.8 males.
The median household income was $36,904 and the median family income was $47,918. Males had a median income of $34,625 versus $28,616 for females. The per capita income for the county was $22,542. About 13.4% of families and 17.5% of the population were below the poverty line, including 27.8% of those under age 18 and 9.1% of those age 65 or over.
Government
| Year | GOP | Dem | Others |
|---|---|---|---|
| 2016 | 69.8% 13,594 | 28.3% 5,519 | 1.9% 373 |
| 2012 | 65.8% 12,396 | 33.5% 6,319 | 0.7% 136 |
| 2008 | 67.9% 13,116 | 31.4% 6,063 | 0.7% 132 |
| 2004 | 69.0% 12,392 | 30.4% 5,451 | 0.6% 109 |
| 2000 | 60.3% 9,805 | 38.0% 6,183 | 1.6% 265 |
| 1996 | 51.5% 7,627 | 41.0% 6,071 | 7.5% 1,117 |
| 1992 | 52.7% 8,140 | 36.9% 5,703 | 10.4% 1,613 |
| 1988 | 63.9% 8,502 | 34.6% 4,598 | 1.5% 198 |
| 1984 | 66.2% 9,045 | 32.6% 4,458 | 1.2% 163 |
| 1980 | 43.8% 5,958 | 53.4% 7,260 | 2.8% 385 |
| 1976 | 39.8% 5,237 | 57.8% 7,614 | 2.4% 312 |
| 1972 | 78.7% 8,535 | 19.5% 2,113 | 1.8% 195 |
| 1968 | 10.2% 1,205 | 11.3% 1,331 | 78.6% 9,285 |
| 1964 | 76.1% 5,530 | 23.9% 1,733 | |
| 1960 | 28.1% 2,150 | 71.4% 5,460 | 0.5% 38 |
| 1956 | 26.7% 1,879 | 72.0% 5,070 | 1.3% 93 |
| 1952 | 19.0% 1,187 | 80.9% 5,055 | 0.1% 7 |
| 1948 | 6.3% 156 | 93.7% 2,318 | |
| 1944 | 3.9% 136 | 95.9% 3,326 | 0.2% 7 |
| 1940 | 3.1% 139 | 96.7% 4,325 | 0.3% 11 |
| 1936 | 3.7% 141 | 96.1% 3,625 | 0.2% 6 |
| 1932 | 3.9% 138 | 95.9% 3,391 | 0.2% 8 |
| 1928 | 40.5% 1,257 | 59.5% 1,849 | 0.0% 1 |
| 1924 | 0.1% 1 | 99.6% 1,713 | 0.3% 6 |
| 1920 | 10.5% 269 | 88.4% 2,257 | 1.0% 26 |
| 1916 | 6.3% 129 | 92.0% 1,892 | 1.8% 36 |
| 1912 | 4.6% 84 | 86.1% 1,586 | 9.4% 173 |
| 1908 | 6.3% 104 | 81.6% 1,343 | 12.1% 199 |
| 1904 | 11.0% 234 | 84.1% 1,791 | 4.9% 105 |
Communities
Cities
- Alexander City
- Dadeville (county seat)
- Tallassee (partly in Elmore County)
Census-designated places
Unincorporated communities
See also
References
- "ACES Tallapoosa County Office" (links/history), Alabama Cooperative Extension System (ACES), 2007, webpage: ACES-Tallapoosa.
- "State & County QuickFacts". United States Census Bureau. Retrieved May 17, 2014.
- "Find a County". National Association of Counties. Retrieved June 7, 2011.
- "2010 Census Gazetteer Files". United States Census Bureau. August 22, 2012. Retrieved August 22, 2015.
-

- "Population and Housing Unit Estimates". Retrieved May 17, 2019.
- "U.S. Decennial Census". United States Census Bureau. Retrieved August 22, 2015.
- "Historical Census Browser". University of Virginia Library. Retrieved August 22, 2015.
- Forstall, Richard L., ed. (March 24, 1995). "Population of Counties by Decennial Census: 1900 to 1990". United States Census Bureau. Retrieved August 22, 2015.
- "Census 2000 PHC-T-4. Ranking Tables for Counties: 1990 and 2000" (PDF). United States Census Bureau. April 2, 2001. Retrieved August 22, 2015.
- "U.S. Census website". United States Census Bureau. Retrieved May 14, 2011.
- "U.S. Census website". United States Census Bureau. Retrieved August 11, 2015.
- "Dave Leip's Atlas of U.S. Presidential Elections". Retrieved November 21, 2016.
External links
- Tallapoosa County map of roads/towns (map © 2007 Univ. of Alabama).
Places adjacent to Tallapoosa County, Alabama | ||||||||||
|---|---|---|---|---|---|---|---|---|---|---|
| ||||||||||
Municipalities and communities of Tallapoosa County, Alabama, United States | ||
|---|---|---|
| Cities | Map of Alabama highlighting Tallapoosa County | |
| Towns | ||
| CDPs | ||
| Unincorporated communities | ||
| Footnotes | ‡This populated place also has portions in an adjacent county or counties | |
Montgomery (capital) | ||
| Topics | ||
| Society |
| |
| Regions | ||
| Flora and fauna | ||
| Largest cities | ||
| Metros |
| |
| Counties |
| |

| Authority control |
|
|---|