1972 United States presidential election in South Carolina
The 1972 United States presidential election in South Carolina took place on November 7, 1972. All 50 states and the District of Columbia were part of the 1972 United States presidential election. South Carolina voters chose 8 electors to the Electoral College, who voted for president and vice president.
| ||||||||||||||||||||||||||
| ||||||||||||||||||||||||||
 County Results
Nixon 50-60% 60-70% 70-80% 80-90%
| ||||||||||||||||||||||||||
| ||||||||||||||||||||||||||

South Carolina overwhelmingly voted for the Republican nominees, incumbent President Richard Nixon of California and his running mate Vice President Spiro Agnew of Maryland . Nixon and Agnew defeated the Democratic nominees, Senator George McGovern of South Dakota and his running mate U.S. Ambassador Sargent Shriver of Maryland.
Nixon carried South Carolina with 70.58% of the vote to McGovern's 27.92%, a victory margin of 42.66%.[1] This election provided the Republican Party with its best presidential result in South Carolina since Reconstruction and constitutes the only presidential election where the Republican candidate carried every county in the state.
This is the only time, as of the 2016 presidential election, that Marlboro County has voted for a Republican presidential candidate since that county was founded in 1896, and the first time the Wallace counties of Union and Cherokee had ever voted Republican.[2] It is the last time, as of the 2016 presidential election, when Orangeburg County, Clarendon County, Williamsburg County, Marion County, Jasper County, Fairfield County, Hampton County, Lee County, and Allendale County have voted for a Republican presidential candidate.[3] McCormick County would not vote Republican again until Donald Trump in 2016.
Results
| United States presidential election in South Carolina, 1972[1] | |||||
|---|---|---|---|---|---|
| Party | Candidate | Votes | Percentage | Electoral votes | |
| Republican | Richard Nixon | 478,427 | 70.58% | 8 | |
| Democratic | George McGovern | 189,270 | 27.92% | 0 | |
| George Wallace Party | John G. Schmitz | 10,166 | 1.50% | 0 | |
| Write-ins | Write-ins | 17 | 0.00% | 0 | |
| Totals | 677,880 | 100.00% | 8 | ||
| Voter turnout | - | ||||
Results by county
| County | Richard Milhous Nixon
Republican |
George Stanley McGovern
Democratic |
Various candidates
Other parties |
Total votes cast | |||
|---|---|---|---|---|---|---|---|
| # | % | # | % | # | # | ||
| Abbeville | 3,266 | 68.95% | 1,349 | 28.48% | 122 | 2.58% | 4,737 |
| Aiken | 21,117 | 77.05% | 5,745 | 20.96% | 545 | 1.99% | 27,407 |
| Allendale | 1,741 | 55.34% | 1,386 | 44.06% | 19 | 0.60% | 3,146 |
| Anderson | 17,514 | 75.19% | 5,241 | 22.50% | 537 | 2.31% | 23,292 |
| Bamberg | 2,537 | 59.65% | 1,680 | 39.50% | 36 | 0.85% | 4,253 |
| Barnwell | 3,955 | 71.71% | 1,560 | 28.29% | 0 | 0.00% | 5,515 |
| Beaufort | 5,929 | 64.12% | 3,237 | 35.01% | 81 | 0.88% | 9,247 |
| Berkeley | 9,345 | 66.66% | 4,497 | 32.08% | 177 | 1.26% | 14,019 |
| Calhoun | 1,867 | 60.91% | 1,148 | 37.46% | 50 | 1.63% | 3,065 |
| Charleston | 39,863 | 68.79% | 16,855 | 29.09% | 1,229 | 2.12% | 57,947 |
| Cherokee | 7,570 | 77.24% | 2,107 | 21.50% | 123 | 1.26% | 9,800 |
| Chester | 4,724 | 66.20% | 2,352 | 32.96% | 60 | 0.84% | 7,136 |
| Chesterfield | 5,230 | 63.56% | 2,938 | 35.70% | 61 | 0.74% | 8,229 |
| Clarendon | 3,958 | 54.34% | 3,276 | 44.98% | 50 | 0.69% | 7,284 |
| Colleton | 5,723 | 69.51% | 2,376 | 28.86% | 134 | 1.63% | 8,233 |
| Darlington | 11,756 | 72.04% | 4,414 | 27.05% | 149 | 0.91% | 16,319 |
| Dillon | 4,364 | 72.32% | 1,604 | 26.58% | 66 | 1.09% | 6,034 |
| Dorchester | 8,095 | 68.11% | 3,606 | 30.34% | 185 | 1.56% | 11,886 |
| Edgefield | 2,812 | 66.67% | 1,326 | 31.44% | 80 | 1.90% | 4,218 |
| Fairfield | 2,608 | 50.68% | 2,492 | 48.43% | 46 | 0.89% | 5,146 |
| Florence | 18,106 | 65.30% | 9,455 | 34.10% | 165 | 0.60% | 27,726 |
| Georgetown | 6,114 | 57.27% | 4,446 | 41.64% | 116 | 1.09% | 10,676 |
| Greenville | 46,360 | 79.62% | 10,143 | 17.42% | 1,726 | 2.96% | 58,229 |
| Greenwood | 9,370 | 72.22% | 3,400 | 26.20% | 205 | 1.58% | 12,975 |
| Hampton | 2,891 | 57.56% | 2,086 | 41.53% | 46 | 0.92% | 5,023 |
| Horry | 15,324 | 76.84% | 4,437 | 22.25% | 183 | 0.92% | 19,944 |
| Jasper | 1,650 | 57.21% | 1,203 | 41.71% | 31 | 1.07% | 2,884 |
| Kershaw | 8,035 | 74.79% | 2,531 | 23.56% | 178 | 1.66% | 10,744 |
| Lancaster | 9,016 | 77.86% | 2,461 | 21.25% | 103 | 0.89% | 11,580 |
| Laurens | 8,141 | 74.46% | 2,650 | 24.24% | 142 | 1.30% | 10,933 |
| Lee | 3,076 | 60.31% | 1,996 | 39.14% | 28 | 0.55% | 5,100 |
| Lexington | 25,327 | 84.75% | 4,069 | 13.62% | 490 | 1.64% | 29,886 |
| McCormick | 1,302 | 60.22% | 844 | 39.04% | 16 | 0.74% | 2,162 |
| Marion | 4,719 | 64.66% | 2,545 | 34.87% | 34 | 0.47% | 7,298 |
| Marlboro | 3,838 | 65.58% | 1,999 | 34.16% | 15 | 0.26% | 5,852 |
| Newberry | 7,325 | 76.94% | 2,035 | 21.37% | 161 | 1.69% | 9,521 |
| Oconee | 6,824 | 78.19% | 1,740 | 19.94% | 164 | 1.88% | 8,728 |
| Orangeburg | 11,711 | 59.31% | 7,652 | 38.75% | 382 | 1.93% | 19,745 |
| Pickens | 11,776 | 82.37% | 2,255 | 15.77% | 265 | 1.85% | 14,296 |
| Richland | 39,746 | 64.11% | 21,462 | 34.62% | 787 | 1.27% | 61,995 |
| Saluda | 3,095 | 73.85% | 1,022 | 24.39% | 74 | 1.77% | 4,191 |
| Spartanburg | 31,308 | 75.34% | 9,586 | 23.07% | 662 | 1.59% | 41,556 |
| Sumter | 10,892 | 64.83% | 5,801 | 34.53% | 107 | 0.64% | 16,800 |
| Union | 8,337 | 75.35% | 2,676 | 24.18% | 52 | 0.47% | 11,065 |
| Williamsburg | 5,729 | 52.01% | 5,213 | 47.33% | 73 | 0.66% | 11,015 |
| York | 14,441 | 68.68% | 6,374 | 30.31% | 211 | 1.00% | 21,026 |
| Totals | 478,427 | 70.58% | 189,270 | 27.92% | 10,166 | 1.50% | 677,863 |
References
- "1972 Presidential General Election Results - South Carolina". Dave Leip's Atlas of U.S. Presidential Elections. Retrieved 2015-10-02.
- Menendez, Albert J.; The Geography of Presidential Elections in the United States, 1868-2004, pp. 292-294 ISBN 0786422173
- Sullivan, Robert David; ‘How the Red and Blue Map Evolved Over the Past Century’; America Magazine in The National Catholic Review; June 29, 2016
State and district results of the 1972 United States presidential election | ||
|---|---|---|
| 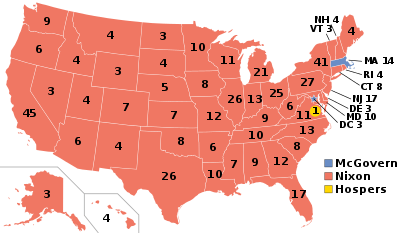 | |