DeKalb County, Alabama
DeKalb County is a county located in the northeastern part of the U.S. state of Alabama. As of the 2010 census, the population was 71,109.[1] Its county seat is Fort Payne,[2] and it is named after Major General Baron Johan DeKalb. DeKalb County is part of the Huntsville-Decatur-Albertville, AL Combined Statistical Area.
DeKalb County | |
|---|---|
 DeKalb County courthouse in Fort Payne | |
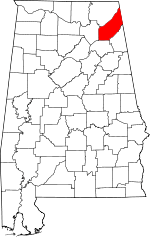 Location within the U.S. state of Alabama | |
 Alabama's location within the U.S. | |
| Coordinates: 34°27′26″N 85°48′24″W | |
| Country | |
| State | |
| Founded | January 9, 1836 |
| Named for | Johan DeKalb |
| Seat | Fort Payne |
| Largest city | Fort Payne |
| Area | |
| • Total | 779 sq mi (2,020 km2) |
| • Land | 777 sq mi (2,010 km2) |
| • Water | 1.6 sq mi (4 km2) 0.2%% |
| Population (2010) | |
| • Total | 71,109 |
| • Estimate (2019) | 71,513 |
| • Density | 91/sq mi (35/km2) |
| Time zone | UTC−6 (Central) |
| • Summer (DST) | UTC−5 (CDT) |
| Congressional district | 4th |
| Website | www |
| |
History
DeKalb County was created by the Alabama legislature on January 9, 1836,[3] from land ceded to the Federal government by the Cherokee Nation. It was named for Major General Baron Johann de Kalb, a hero of the American Revolution.[4]
DeKalb County was the one time home of the famous Cherokee Native American Sequoyah.
The county's eastern edge, along the state line, was also the epicenter of an earthquake on April 29, 2003, measuring 4.6 on the Richter scale. Power was knocked out in the area, mirrors and pictures thrown to the floor, foundations cracked, and one chimney fell to the ground. It was felt over a significant portion of the southeastern states, including quite strongly in northeastern Alabama and neighboring northern Georgia, and nearby eastern Tennessee (especially near Chattanooga). It was also felt slightly in western upstate South Carolina, far west-southwestern North Carolina, south and southeastern Kentucky, and east-northeastern Mississippi.
On the whole, DeKalb County is a dry county. In 2005, a change in local laws enabled Fort Payne to become the only location in the county to allow the legal sale of alcohol.[5] Collinsville and Henagar later allowed alcohol sales.
DeKalb County saw one of the highest death tolls in Alabama during a massive tornadic system in April 2011, the 2011 Super Outbreak, with 31 deaths reported in the county.
Geography

According to the U.S. Census Bureau, the county has a total area of 779 square miles (2,020 km2), of which 777 square miles (2,010 km2) is land and 1.6 square miles (4.1 km2) (0.2%) is water.[6]
Adjacent counties
- Jackson County - north
- Dade County, Georgia - northeast (EST)
- Walker County, Georgia - east (EST)
- Chattooga County, Georgia - east (EST)
- Cherokee County - southeast
- Etowah County - south
- Marshall County - west
National protected area
Demographics
| Historical population | |||
|---|---|---|---|
| Census | Pop. | %± | |
| 1840 | 5,929 | — | |
| 1850 | 8,245 | 39.1% | |
| 1860 | 10,705 | 29.8% | |
| 1870 | 7,126 | −33.4% | |
| 1880 | 12,675 | 77.9% | |
| 1890 | 21,106 | 66.5% | |
| 1900 | 23,558 | 11.6% | |
| 1910 | 28,261 | 20.0% | |
| 1920 | 34,426 | 21.8% | |
| 1930 | 40,104 | 16.5% | |
| 1940 | 43,075 | 7.4% | |
| 1950 | 45,048 | 4.6% | |
| 1960 | 41,417 | −8.1% | |
| 1970 | 41,981 | 1.4% | |
| 1980 | 53,658 | 27.8% | |
| 1990 | 54,651 | 1.9% | |
| 2000 | 64,452 | 17.9% | |
| 2010 | 71,109 | 10.3% | |
| Est. 2019 | 71,513 | [7] | 0.6% |
| U.S. Decennial Census[8] 1790–1960[9] 1900–1990[10] 1990–2000[11] 2010–2018[1] | |||
As of the census[12] of 2010, there were 71,109 people, 26,842 households, and 19,361 families living in the county. The population density was 92 people per square mile (36/km2). There were 31,109 housing units at an average density of 39.9 per square mile (15/km2). The racial makeup of the county was 84.5% White (non-Hispanic), 1.5% Black or African American, 1.4% Native American, 0.3% Asian, 0.2% Pacific Islander, 9.9% from other races, and 2.2% from two or more races. 13.6% of the population were Hispanic or Latino of any race.
As of the census[13] of 2000, there were 64,452 people, 25,113 households, and 18,432 families living in the county. The population density was 83 people per square mile (32/km2). There were 28,051 housing units at an average density of 36 per square mile (14/km2). The racial makeup of the county was 92.55% White (non-Hispanic), 1.68% Black or African American, 0.80% Native American, 0.19% Asian, 0.06% Pacific Islander, 3.10% from other races, and 1.62% from two or more races. 5.55% of the population were Hispanic or Latino of any race.
According to the census of 2000, the largest ancestry groups in DeKalb County were English 78.31%, Scotch-Irish 8.29%, Scottish 3.33%, Irish 3.31%, Welsh 1.22%, and African 1.68%
Transportation
Major highways
.svg.png)


Government
DeKalb County is strongly Republican. Eighty-three percent of its voters supported Donald Trump in 2016, and no Democrat has carried it since Southerner Jimmy Carter did so in 1976. Populist appeal in the county during the period of “Redemption” meant that even during the “Solid South” era DeKalb County sometimes supported victorious Republican presidential candidates, as it did during the three Republican landslides of the 1920s.
| Year | GOP | Dem | Others |
|---|---|---|---|
| 2016 | 82.9% 21,405 | 14.0% 3,622 | 3.1% 799 |
| 2012 | 76.5% 18,331 | 21.9% 5,239 | 1.6% 380 |
| 2008 | 74.8% 17,957 | 23.6% 5,658 | 1.7% 400 |
| 2004 | 69.9% 16,904 | 29.3% 7,092 | 0.7% 173 |
| 2000 | 63.2% 12,827 | 34.8% 7,056 | 2.0% 402 |
| 1996 | 54.1% 9,823 | 36.1% 6,544 | 9.8% 1,776 |
| 1992 | 48.7% 10,519 | 38.2% 8,245 | 13.1% 2,821 |
| 1988 | 60.6% 11,478 | 38.7% 7,333 | 0.7% 129 |
| 1984 | 62.5% 12,098 | 37.3% 7,212 | 0.2% 39 |
| 1980 | 51.8% 9,673 | 47.2% 8,820 | 1.1% 197 |
| 1976 | 40.1% 6,597 | 59.4% 9,759 | 0.5% 81 |
| 1972 | 71.3% 9,434 | 28.4% 3,759 | 0.3% 44 |
| 1968 | 35.8% 5,314 | 8.6% 1,274 | 55.7% 8,271 |
| 1964 | 57.7% 6,746 | 42.3% 4,948 | |
| 1960 | 48.8% 5,585 | 51.1% 5,844 | 0.1% 12 |
| 1956 | 49.6% 5,684 | 50.3% 5,768 | 0.1% 16 |
| 1952 | 43.4% 3,997 | 56.5% 5,209 | 0.1% 11 |
| 1948 | 43.3% 2,743 | 56.7% 3,590 | |
| 1944 | 37.5% 2,627 | 62.4% 4,366 | 0.1% 9 |
| 1940 | 34.0% 2,810 | 65.8% 5,432 | 0.2% 17 |
| 1936 | 42.9% 4,620 | 56.9% 6,121 | 0.2% 23 |
| 1932 | 44.9% 3,496 | 54.1% 4,217 | 1.0% 77 |
| 1928 | 59.3% 5,761 | 40.7% 3,957 | 0.0% 2 |
| 1924 | 53.4% 3,434 | 46.7% 3,003 | 0.0% 0 |
| 1920 | 55.2% 4,852 | 44.3% 3,894 | 0.6% 49 |
| 1916 | 39.4% 1,190 | 59.1% 1,787 | 1.6% 47 |
| 1912 | 19.5% 492 | 54.6% 1,379 | 25.9% 654 |
| 1908 | 43.2% 1,103 | 54.6% 1,395 | 2.3% 58 |
| 1904 | 40.3% 1,237 | 55.9% 1,716 | 3.8% 116 |
Communities
Cities
- Fort Payne (county seat)
- Henagar
- Rainsville
Towns
- Collinsville (partly in Cherokee County)
- Crossville
- Fyffe
- Geraldine
- Hammondville
- Ider
- Lakeview
- Mentone
- Pine Ridge
- Powell
- Sand Rock (mostly in Cherokee County)
- Shiloh
- Sylvania
- Valley Head
Unincorporated communities
Ghost towns
See also
References
- "State & County QuickFacts". United States Census Bureau. Archived from the original on August 9, 2014. Retrieved May 16, 2014.
- "Find a County". National Association of Counties. Archived from the original on May 31, 2011. Retrieved 2011-06-07.
- "Alabama Counties". Alabama Department of Archives and History. Archived from the original on 26 September 2007. Retrieved 18 January 2014.
- Gannett, Henry (1905). The Origin of Certain Place Names in the United States. Govt. Print. Off. pp. 103.
- "Alcohol laws are changed," The Times-Journal, December 17, 2004 Archived July 26, 2009, at the Wayback Machine
- "2010 Census Gazetteer Files". United States Census Bureau. August 22, 2012. Retrieved August 22, 2015.
- "Population and Housing Unit Estimates". Retrieved May 17, 2019.
- "U.S. Decennial Census". United States Census Bureau. Retrieved August 22, 2015.
- "Historical Census Browser". University of Virginia Library. Retrieved August 22, 2015.
- Forstall, Richard L., ed. (March 24, 1995). "Population of Counties by Decennial Census: 1900 to 1990". United States Census Bureau. Retrieved August 22, 2015.
- "Census 2000 PHC-T-4. Ranking Tables for Counties: 1990 and 2000" (PDF). United States Census Bureau. April 2, 2001. Retrieved August 22, 2015.
- "U.S. Census website". United States Census Bureau. Retrieved July 21, 2015.
- "U.S. Census website". United States Census Bureau. Retrieved 2011-05-14.
- "Dave Leip's Atlas of U.S. Presidential Elections". Retrieved November 16, 2016.
External links
Places adjacent to DeKalb County, Alabama | ||||||||||
|---|---|---|---|---|---|---|---|---|---|---|
| ||||||||||
Municipalities and communities of DeKalb County, Alabama, United States | ||
|---|---|---|
| Cities | Map of Alabama highlighting DeKalb County | |
| Towns | ||
| Unincorporated communities | ||
| Ghost towns | ||
| Footnotes | ‡This populated place also has portions in an adjacent county or counties | |
Montgomery (capital) | ||
| Topics | ||
| Society |
| |
| Regions | ||
| Flora and fauna | ||
| Largest cities | ||
| Metros |
| |
| Counties |
| |
| Authority control |
|
|---|