1972 United States presidential election in Florida
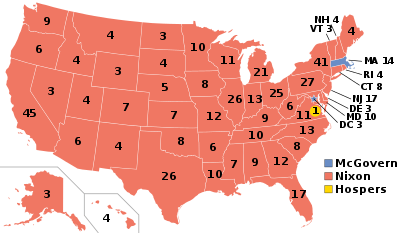
The 1972 United States presidential election in Florida was held on November 7, 1972, as part of the concurrent United States presidential election. Florida voters chose seventeen electors, or representatives to the Electoral College, who voted for president and vice president.
| ||||||||||||||||||||||||||
| Turnout | ||||||||||||||||||||||||||
|---|---|---|---|---|---|---|---|---|---|---|---|---|---|---|---|---|---|---|---|---|---|---|---|---|---|---|
| ||||||||||||||||||||||||||
 County Results
Nixon 50-60% 60-70% 70-80% 80-90% 90-100%
| ||||||||||||||||||||||||||
| ||||||||||||||||||||||||||
| Elections in Florida | ||||||||||||||
|---|---|---|---|---|---|---|---|---|---|---|---|---|---|---|
 | ||||||||||||||
|
||||||||||||||
|
||||||||||||||
|
|
||||||||||||||
|
North Miami
|
||||||||||||||
|
||||||||||||||
|
|
||||||||||||||
|
| ||||||||||||||
Background
After having been among the strongest parts of the Democratic "Solid South" between 1892 and 1944 – except when vehement pineywoods anti-Catholicism and extensive urban Republican voting gave the state's electoral votes to Herbert Hoover in 1928 – Florida turned into a Republican-leaning state at presidential level from 1948 due to the growth of a strongly business-oriented society in newer South Florida following World War II.[1] Aided by this vote, the Republicans carried Florida in all three presidential elections from 1952 to 1960,[2] despite losing the entire northern half of the state.
The civil rights movement of the 1960s saw a dramatic change in the next two elections. The classically Deep Southern northern part of the state, affected by turmoil over school and university desegregation,[3] went powerfully to the staunch conservative Republican Barry Goldwater after having resisted the GOP in the previous four elections, and then turned to the segregationist candidacy of former and future Alabama Governor George Wallace in 1968. Contrastingly, the southern urban areas that had supported the Republicans between 1948 and 1960 continued huge numbers of former Northern retirees hostile to Goldwater's proposed privatization of Social Security, and turned to Lyndon Johnson and then Richard Nixon.[4]
The 1972 Democratic presidential primary in Florida saw Wallace easily carry the state and every county bar Dade, in a ballot that also featured a referendum on court-ordered busing.[5] This referendum revealed that more three-fourths of the state's voters supported a constitutional ban on busing.[6] The party primaries that year were especially divisive over the busing issue. John Lindsay, plus eventual party nominee George McGovern were supporters of busing who accused even their moderate rivals Hubert Humphrey and "Scoop" Jackson of being covert racists for their opposition thereto.[5] As it turned out, Wallace – the opponent most feared by Nixon – was paralyzed by an attempted assassination in May, and McGovern won the nomination via powerful support in midwestern and Pacific States.
Once McGovern won the nomination, he offered Florida Governor Reubin Askew the vice-presidential slot, but Askew turned the position down.[7]
Vote
Incumbent President Nixon overwhelmingly won the state of Florida with 71.91% of the vote, carrying all of Florida's 67 counties and seventeen electoral votes.[8] Nixon's victory in Florida made it his fifth strongest state after Mississippi, Georgia, Oklahoma and Alabama.[9] McGovern reached 40% of the vote only in Dade County with its substantial Jewish and Latin populations, plus Alachua County with its large population of liberal college students who were a major base for his candidacy[10] – and the Democratic candidate only reached thirty percent of the vote in four other counties. Nixon's message enabled him to capture virtually all of the Wallace vote from 1968, as shown by the fact that pineywoods Holmes County, which had been Wallace's fifth-strongest county in 1968,[11] was to be Nixon's fourth-best county in 1972 with over 92% of the vote.[12]
In addition to hostility towards busing and the "acid, amnesty and abortion" policies which Nixon consistently accused McGovern of[10] despite eventual running mate Sargent Shriver being firmly opposed to abortion, the Democratic campaign in Florida was also crippled by McGovern's policy of normalizing relationships with Fidel Castro's Cuba. Relationships with Cuba were a hotbed issue in the most liberal and least Southern region of the state around Miami,[13] and drove even many voters who had supported Humphrey in 1968 to Nixon and the Republican Party.[14] This allowed the GOP to carry Monroe County, which had consistently voted Democratic since 1888,[15] by over 45%.
As of the 2016 presidential election, this is the last election in which Gadsden County voted for a Republican presidential candidate.[16]
Results
| Presidential candidate | Party | Home state | Popular vote | Electoral vote |
Running mate | |||
|---|---|---|---|---|---|---|---|---|
| Count | Percentage | Vice-presidential candidate | Home state | Electoral vote | ||||
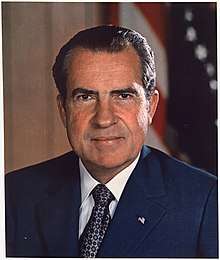
| Richard Nixon | Republican | California | 1,857,759 | 71.91% | 17 | Spiro Agnew | Maryland | 17 |
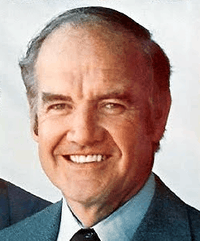
| George McGovern | Democratic | South Dakota | 718,117 | 27.80% | 0 | Sargent Shriver | Maryland | 0 |
| Various candidates | Write-ins | — | 7,407 | 0.29% | 0 | — | — | 0 |
| Total | 2,583,283 | 100% | 17 | 17 | ||||
| Needed to win | 270 | 270 | ||||||
Results by county
| Richard Milhous Nixon Republican |
George Stanley McGovern Democratic |
Various candidates Write-ins |
Margin | Total votes cast | |||||
|---|---|---|---|---|---|---|---|---|---|
| County | # | % | # | % | # | % | # | % | # |
| Alachua | 22,536 | 56.54% | 17,245 | 43.26% | 80 | 0.20% | 5,291 | 13.27% | 39,861 |
| Baker | 1,943 | 83.64% | 379 | 16.32% | 1 | 0.04% | 1,564 | 67.33% | 2,323 |
| Bay | 20,245 | 83.80% | 3,914 | 16.20% | 16,331 | 67.60% | 24,159 | ||
| Bradford | 3,652 | 73.67% | 1,217 | 24.55% | 88 | 1.78% | 2,435 | 49.12% | 4,957 |
| Brevard | 62,773 | 78.73% | 16,854 | 21.14% | 106 | 0.13% | 45,919 | 57.59% | 79,733 |
| Broward | 196,528 | 72.41% | 74,127 | 27.31% | 754 | 0.28% | 122,401 | 45.10% | 271,409 |
| Calhoun | 2,069 | 81.68% | 461 | 18.20% | 3 | 0.12% | 1,608 | 63.48% | 2,533 |
| Charlotte | 12,888 | 76.64% | 3,874 | 23.04% | 55 | 0.33% | 9,014 | 53.60% | 16,817 |
| Citrus | 8,848 | 77.22% | 2,607 | 22.75% | 3 | 0.03% | 6,241 | 54.47% | 11,458 |
| Clay | 10,467 | 85.53% | 1,748 | 14.28% | 23 | 0.19% | 8,719 | 71.25% | 12,238 |
| Collier | 13,501 | 80.63% | 3,201 | 19.12% | 42 | 0.25% | 10,300 | 61.51% | 16,744 |
| Columbia | 6,723 | 80.16% | 1,664 | 19.84% | 5,059 | 60.32% | 8,387 | ||
| Dade | 256,529 | 58.87% | 177,693 | 40.78% | 1,541 | 0.35% | 78,836 | 18.09% | 435,763 |
| DeSoto | 2,958 | 77.58% | 852 | 22.34% | 3 | 0.08% | 2,106 | 55.23% | 3,813 |
| Dixie | 1,628 | 81.52% | 367 | 18.38% | 2 | 0.10% | 1,261 | 63.14% | 1,997 |
| Duval | 122,154 | 72.19% | 46,530 | 27.50% | 520 | 0.31% | 75,624 | 44.69% | 169,204 |
| Escambia | 56,071 | 79.57% | 14,078 | 19.98% | 315 | 0.45% | 41,993 | 59.59% | 70,464 |
| Flagler | 1,409 | 74.08% | 493 | 25.92% | 916 | 48.16% | 1,902 | ||
| Franklin | 2,277 | 82.14% | 490 | 17.68% | 5 | 0.18% | 1,787 | 64.47% | 2,772 |
| Gadsden | 5,995 | 61.01% | 3,829 | 38.97% | 2 | 0.02% | 2,166 | 22.04% | 9,826 |
| Gilchrist | 1,306 | 83.45% | 247 | 15.78% | 12 | 0.77% | 1,059 | 67.67% | 1,565 |
| Glades | 1,019 | 78.81% | 253 | 19.57% | 21 | 1.62% | 766 | 59.24% | 1,293 |
| Gulf | 2,628 | 78.54% | 713 | 21.31% | 5 | 0.15% | 1,915 | 57.23% | 3,346 |
| Hamilton | 1,741 | 73.34% | 626 | 26.37% | 7 | 0.29% | 1,115 | 46.97% | 2,374 |
| Hardee | 3,563 | 84.57% | 647 | 15.36% | 3 | 0.07% | 2,916 | 69.21% | 4,213 |
| Hendry | 2,763 | 78.85% | 739 | 21.09% | 2 | 0.06% | 2,024 | 57.76% | 3,504 |
| Hernando | 6,296 | 74.87% | 2,110 | 25.09% | 3 | 0.04% | 4,186 | 49.78% | 8,409 |
| Highlands | 9,645 | 79.49% | 2,458 | 20.26% | 30 | 0.25% | 7,187 | 59.24% | 12,133 |
| Hillsborough | 106,956 | 70.13% | 45,305 | 29.71% | 249 | 0.16% | 61,651 | 40.42% | 152,510 |
| Holmes | 3,819 | 92.51% | 309 | 7.49% | 3,510 | 85.03% | 4,128 | ||
| Indian River | 11,741 | 77.85% | 3,316 | 21.99% | 25 | 0.17% | 8,425 | 55.86% | 15,082 |
| Jackson | 8,904 | 79.99% | 2,220 | 19.94% | 8 | 0.07% | 6,684 | 60.04% | 11,132 |
| Jefferson | 2,108 | 66.04% | 1,049 | 32.86% | 35 | 1.10% | 1,059 | 33.18% | 3,192 |
| Lafayette | 1,060 | 85.69% | 173 | 13.99% | 4 | 0.32% | 887 | 71.71% | 1,237 |
| Lake | 23,079 | 82.63% | 4,803 | 17.20% | 48 | 0.17% | 18,276 | 65.44% | 27,930 |
| Lee | 36,738 | 79.46% | 9,404 | 20.34% | 93 | 0.20% | 27,334 | 59.12% | 46,235 |
| Leon | 27,479 | 63.72% | 15,555 | 36.07% | 92 | 0.21% | 11,924 | 27.65% | 43,126 |
| Levy | 3,273 | 79.12% | 862 | 20.84% | 2 | 0.05% | 2,411 | 58.28% | 4,137 |
| Liberty | 1,199 | 84.38% | 222 | 15.62% | 977 | 68.75% | 1,421 | ||
| Madison | 3,236 | 72.92% | 1,187 | 26.75% | 15 | 0.34% | 2,049 | 46.17% | 4,438 |
| Manatee | 32,664 | 79.79% | 8,058 | 19.68% | 218 | 0.53% | 24,606 | 60.10% | 40,940 |
| Marion | 19,505 | 78.18% | 5,397 | 21.63% | 46 | 0.18% | 14,108 | 56.55% | 24,948 |
| Martin | 11,296 | 78.83% | 2,946 | 20.56% | 88 | 0.61% | 8,350 | 58.27% | 14,330 |
| Monroe | 11,688 | 72.18% | 4,469 | 27.60% | 36 | 0.22% | 7,219 | 44.58% | 16,193 |
| Nassau | 5,078 | 79.44% | 1,293 | 20.23% | 21 | 0.33% | 3,785 | 59.21% | 6,392 |
| Okaloosa | 23,303 | 88.64% | 2,843 | 10.81% | 144 | 0.55% | 20,460 | 77.82% | 26,290 |
| Okeechobee | 2,581 | 80.58% | 621 | 19.39% | 1 | 0.03% | 1,960 | 61.19% | 3,203 |
| Orange | 94,516 | 79.57% | 23,840 | 20.07% | 421 | 0.35% | 70,676 | 59.50% | 118,777 |
| Osceola | 9,320 | 82.94% | 1,875 | 16.69% | 42 | 0.37% | 7,445 | 66.25% | 11,237 |
| Palm Beach | 108,670 | 72.35% | 40,825 | 27.18% | 708 | 0.47% | 67,845 | 45.17% | 150,203 |
| Pasco | 29,249 | 71.91% | 11,330 | 27.85% | 97 | 0.24% | 17,919 | 44.05% | 40,676 |
| Pinellas | 179,541 | 69.83% | 77,197 | 30.02% | 378 | 0.15% | 102,344 | 39.80% | 257,116 |
| Polk | 60,748 | 78.42% | 16,419 | 21.20% | 293 | 0.38% | 44,329 | 57.23% | 77,460 |
| Putnam | 8,741 | 74.61% | 2,901 | 24.76% | 74 | 0.63% | 5,840 | 49.85% | 11,716 |
| St. John's | 8,919 | 77.48% | 2,549 | 22.14% | 43 | 0.37% | 6,370 | 55.34% | 11,511 |
| St. Lucie | 14,258 | 75.40% | 4,593 | 24.29% | 59 | 0.31% | 9,665 | 51.11% | 18,910 |
| Santa Rosa | 12,669 | 88.94% | 1,491 | 10.47% | 85 | 0.60% | 11,178 | 78.47% | 14,245 |
| Sarasota | 48,939 | 79.95% | 12,235 | 19.99% | 36 | 0.06% | 36,704 | 59.96% | 61,210 |
| Seminole | 27,658 | 80.84% | 6,503 | 19.01% | 51 | 0.15% | 21,155 | 61.84% | 34,212 |
| Sumter | 3,695 | 76.71% | 1,107 | 22.98% | 15 | 0.31% | 2,588 | 53.73% | 4,817 |
| Suwannee | 4,435 | 80.77% | 1,027 | 18.70% | 29 | 0.53% | 3,408 | 62.07% | 5,491 |
| Taylor | 4,109 | 84.50% | 754 | 15.50% | 3,355 | 68.99% | 4,863 | ||
| Union | 1,314 | 83.85% | 253 | 16.15% | 1,061 | 67.71% | 1,567 | ||
| Volusia | 52,656 | 70.60% | 21,637 | 29.01% | 290 | 0.39% | 31,019 | 41.59% | 74,583 |
| Wakulla | 2,466 | 82.01% | 539 | 17.92% | 2 | 0.07% | 1,927 | 64.08% | 3,007 |
| Walton | 6,217 | 85.93% | 988 | 13.66% | 30 | 0.41% | 5,229 | 72.27% | 7,235 |
| Washington | 3,777 | 86.11% | 606 | 13.82% | 3 | 0.07% | 3,171 | 72.30% | 4,386 |
| Totals | 1,857,759 | 71.91% | 718,117 | 27.80% | 7,407 | 0.29% | 1,139,642 | 44.12% | 2,583,283 |
References
- See Doherty, Herbert J. (junior); 'Liberal and Conservative Politics in Florida'; The Journal of Politics, nol. 14, no. 3 (August 1952), pp. 403-417
- Strong, Donald S.; 'The Presidential Election in the South, 1952'; The Journal of Politics, vol. 17, no. 3, pp. 343-389
- Encyclopedia of African American History: 5-Volume Set, p. 228 ISBN 0195167791
- Phillips, Kevin P.; The Emerging Republican Majority, p. 224 ISBN 9780691163246
- Small, Melvin; A Companion to Richard M. Nixon, chapter 9 ISBN 144434093X
- Lassiter, Matthew D.; The Silent Majority: Suburban Politics in the Sunbelt South, pp. 310-311 ISBN 140084942X
- Young, Josh; And Give Up Showbiz?: How Fred Levin Beat Big Tobacco, Avoided Two Murder Prosecutions, Became a Chief of Ghana, Earned Boxing Manager of the Year, and Transformed American Law, p. 183 ISBN 1940363411
- "1972 Presidential General Election Results – Florida". Retrieved April 25, 2016.
- "1972 Presidential Election Statistics". Dave Leip's Atlas of U.S. Presidential Elections. Retrieved 2018-03-05.
- Rae, Nicol C.; Southern Democrats, pp. 48-49 ISBN 0198024770
- Dave Leip's U.S. Election Atlas; 1968 Presidential Election Statistics
- Dave Leip's U.S. Election Atlas; 1972 Presidential Election Statistics
- Robertson, Andrew; Encyclopedia of U.S. Political History, p. 195 ISBN 0872893200
- Adams, Florence P. and Rodriguez David; Latinos and Local Representation: Changing Realities, Emerging Theories, p. 56 ISBN 0815333706
- Menendez, Albert J.; The Geography of Presidential Elections in the United States, 1868-2004, p. 164-165 ISBN 0786422173
- Sullivan, Robert David; ‘How the Red and Blue Map Evolved Over the Past Century’; America Magazine in The National Catholic Review; June 29, 2016