Plug-in electric vehicle
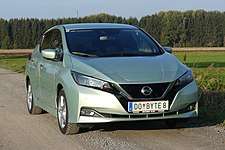
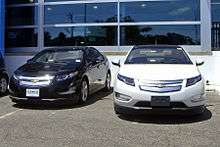
A plug-in electric vehicle (PEV) is any vehicle that can be recharged from an external source of electricity, such as wall sockets, and the electricity stored in the rechargeable battery packs drives or contributes to drive the wheels. PEV is a subset of electric vehicles that includes all-electric, or battery electric vehicles (BEVs), and plug-in hybrid vehicles (PHEVs).[1][2][3] In China, plug-in electric vehicles are classified as new energy vehicles (NEVs). Sales of the first mass-production plug-in cars by major carmakers began in late December 2010, with the introduction of the all-electric Nissan Leaf and the plug-in hybrid Chevrolet Volt.
(global sales as of May 2020)

Plug-in cars have several benefits compared to conventional internal combustion engine vehicles. All-electric vehicles have lower operating and maintenance costs, and produce little or no local air pollution. They reduce dependence on petroleum and may significantly reduce greenhouse gas emissions, depending on the electricity source. Plug-in hybrids capture most of these benefits when they are operating in all-electric mode.
Cumulative global sales of highway legal plug-in electric passenger cars and light utility vehicles achieved the 1 million unit mark in September 2015,[4] and the 5 million milestone in December 2018.[5] By the end of 2019 the stock of light-duty plug-in vehicles totaled about 7.5 million units.[6] Despite the rapid growth experienced, the plug-in electric car segment by December 2018 represented just about 1 out of every 250 vehicles on the world's roads.[7]
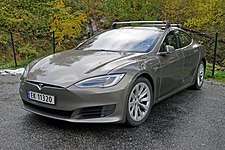
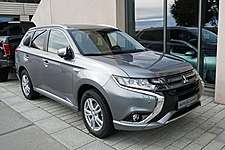
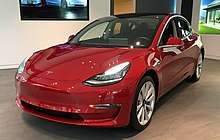
As of March 2020, the Tesla Model 3 listed as the world's top selling highway-capable plug-in electric car in history, with global sales since inception of more than 500,000 units,[8] followed by the Nissan Leaf with 470,000 units sold through May 2020.[9] The Mitsubishi Outlander P-HEV is the world's all-time best selling plug-in hybid with global sales of 250,000 units by May 2020.[10]
As of December 2019, China had the world's largest stock of highway legal plug-in electric passenger cars with 3.4 million units on the road, representing almost half (47%) of the world's stock of plug-in cars.[11] Europe ranked next with 1.7 million plug-in electric passenger cars in use, accounting for 25% of the global stock.[11] The U.S. stock totaled about 1.5 million plug-in cars at the end of 2019, 20% of the global stock.[11]
Norway leads Europe with almost 376,000 light-duty vehicles in use as of December 2019, and has the world's third largest plug-in country fleet.[12] In October 2018, Norway became the first country where 1 for every 10 passenger cars registered is a plug-in electric vehicle, and its plug-in car penetration rose to 13% in 2019.[11][13]
Terminology
Plug-in electric vehicle
A plug-in electric vehicle (PEV) is any motor vehicle with rechargeable battery packs that can be charged from the electric grid, and the electricity stored on board drives or contributes to drive the wheels for propulsion.[1][2] Plug-in electric vehicles are also sometimes referred to as grid-enabled vehicles (GEV)[2] and also as electrically chargeable vehicles (ECV).[14]
PEV is a subcategory of electric vehicles that includes battery electric vehicles (BEVs), plug-in hybrid vehicles, (PHEVs), and electric vehicle conversions of hybrid electric vehicles and conventional internal combustion engine vehicles.[1][2] Even though conventional hybrid electric vehicles (HEVs) have a battery that is continually recharged with power from the internal combustion engine and regenerative braking, they can not be recharged from an off-vehicle electric energy source, and therefore, they do not belong to the category of plug-in electric vehicles.[1][2]
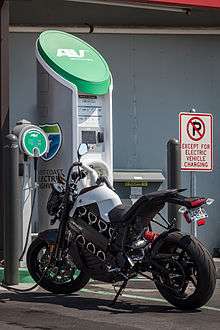
"Plug-in electric drive vehicle" is the legal term used in U.S. federal legislation to designate the category of motor vehicles eligible for federal tax credits depending on battery size and their all-electric range.[15][16] In some European countries, particularly in France, "electrically chargeable vehicle" is the formal term used to designate the vehicles eligible for these incentives.[17] While the term "plug-in electric vehicle" most often refers to automobiles or "plug-in cars", there are several other types of plug-in electric vehicle, including electric motorcycles and scooters, neighborhood electric vehicles or microcars, city cars, vans, buses, electric trucks or lorries, and military vehicles.[18]
Battery electric vehicles
A battery electric vehicle (BEV) uses chemical energy stored in rechargeable battery packs as its only source for propulsion.[2][19] BEVs use electric motors and motor controllers instead of internal combustion engines (ICEs) for propulsion.[2]
A plug-in hybrid operates as an all-electric vehicle or BEV when operating in charge-depleting mode, but it switches to charge-sustaining mode after the battery has reached its minimum state of charge (SOC) threshold, exhausting the vehicle's all-electric range (AER).[20][21]
Plug-in hybrid electric vehicles
A plug-in hybrid electric vehicle (PHEV or PHV), also known as a plug-in hybrid, is a hybrid electric vehicle with rechargeable batteries that can be restored to full charge by connecting a plug to an external electric power source.[2][22] A plug-in hybrid shares the characteristics of both a conventional hybrid electric vehicle and an all-electric vehicle: it uses a gasoline engine and an electric motor for propulsion, but a PHEV has a larger battery pack that can be recharged, allowing operation in all-electric mode until the battery is depleted.[22][23][24]
Aftermarket conversions
An aftermarket electric vehicle conversion is the modification of a conventional internal combustion engine vehicle (ICEV) or hybrid electric vehicle (HEV) to electric propulsion, creating an all-electric or plug-in hybrid electric vehicle.[25][26][27]
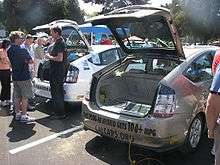
There are several companies in the U.S. offering conversions. The most common conversions have been from hybrid electric cars to plug-in hybrid, but due to the different technology used in hybrids by each carmaker, the easiest conversions are for 2004–2009 Toyota Prius and for the Ford Escape/Mercury Mariner Hybrid.[25]
New energy vehicles
In China the term new energy vehicles (NEVs) refers to vehicles that are partially or fully powered by electricity, such as battery electric vehicles (BEVs), plug-in hybrids (PHEVs), and hydrogen fuel cell vehicles (FCEVs). The Chinese government began implementation of its NEV program in 2009 to foster the development and introduction of new energy vehicles.[28]
Advantages
PEVs have several advantages. These include reduced greenhouse gas emissions, improved air quality, noise reduction, and national security benefits. According to the Center for American Progress, PEVs are an important part of the group of technologies that will help the U.S. meet its goal under the Paris Agreement, which is a 26-28 percent reduction in greenhouse gas emissions by the year 2025.[29]
Lower operating and maintenance costs
Internal combustion engines are relatively inefficient at converting on-board fuel energy to propulsion as most of the energy is wasted as heat, and the rest while the engine is idling. Electric motors, on the other hand, are more efficient at converting stored energy into driving a vehicle. Electric drive vehicles do not consume energy while at rest or coasting, and modern plug-in cars can capture and reuse as much as one fifth of the energy normally lost during braking through regenerative braking.[30][31] Typically, conventional gasoline engines effectively use only 15% of the fuel energy content to move the vehicle or to power accessories, and diesel engines can reach on-board efficiencies of 20%, while electric drive vehicles typically have on-board efficiencies of around 80%.[30]
In the United States, as of early 2010 with a national average electricity rate of US$0.10 per kWh,[33] the cost per mile for a plug-in electric vehicle operating in all-electric mode is estimated between $0.02 to $0.04, while the cost per mile of a standard automobile varies between $0.08 to $0.20, considering a gasoline price of $3.00 per gallon.[30] As petroleum price is expected to increase in the future due to oil production decline and increases in global demand, the cost difference in favor of PEVs is expected to become even more advantageous.[30]
According to Consumer Reports, as of December 2011 the Nissan Leaf has a cost of 3.5 cents per mile and the Chevrolet Volt has a cost in electric mode of 3.8 cents per mile. The Volt cost per mile is higher because it is heavier than the Leaf. These estimates are based on the fuel economy and energy consumption measured on their tests and using a U.S. national average rate of 11 cents per kWh of electricity. When the Volt runs in range-extended mode using its premium gasoline-powered engine, the plug-in hybrid has a cost of 12.5 cents per mile. The out-of-pocket cost per mile of the three most fuel efficient gasoline-powered cars as tested by the magazine are the Toyota Prius, with a cost of 8.6 cents per miles, the Honda Civic Hybrid with 9.5 cents per mile, the Toyota Corolla with 11.9 cents per mile, and the Hyundai Elantra 13.1 cents per mile. The analysis also found that on trips up to 100 mi (160 km), the Volt is cheaper to drive than the Prius and the other three cars due to the Volt's 35 mi (56 km) driving range on electricity. The previous operating costs do not include maintenance, depreciation or other costs.[34]
All-electric and plug-in hybrid vehicles also have lower maintenance costs as compared to internal combustion vehicles, since electronic systems break down much less often than the mechanical systems in conventional vehicles, and the fewer mechanical systems onboard last longer due to the better use of the electric engine. PEVs do not require oil changes and other routine maintenance checks.[30][31]
The Edison Electric Institute (EEI) conducted an analysis that demonstrated that between January 1976 and February 2012 the real price for gasoline has been much more volatile than the real price of electricity in the United States. The analysis is based on a plug-in electric vehicle with an efficiency of 3.4 miles per kW-hr (like the Mitsubishi i MiEV) and a gasoline-powered vehicle with a fuel economy rated at 30 mpg‑US (7.8 L/100 km; 36 mpg‑imp) (like the 2012 Fiat 500). The EEI estimated that operating a plug-in would have had an equivalent cost of around US$1.50 a gallon in the late 1970s and early 1980s, and around US$1.00 a gallon since the late 1990s. In contrast, the price to operate an internal combustion engine vehicle has had many ample variations, costing more than US$3.50 per gallon during the 1979 energy crisis, then had a couple of lows with prices at less than US$1.50 during 1999 and 2001, only to climb and reach a maximum of more than US$4.00 before the beginning of the 2007–2009 financial crisis, by early 2012 has fluctuated around US$3.50. The analysis found that the cost of an equivalent electric-gallon of gasoline would have been not only cheaper to operate during the entire analysis period but also that equivalent electricity prices are more stable and have been declining in terms of equivalent dollars per gallon.[35][36]
Air pollution and greenhouse gas emissions

Electric cars, as well as plug-in hybrids operating in all-electric mode, emit no harmful tailpipe pollutants from the onboard source of power, such as particulates (soot), volatile organic compounds, hydrocarbons, carbon monoxide, ozone, lead, and various oxides of nitrogen. The clean air benefit is usually local because, depending on the source of the electricity used to recharge the batteries, air pollutant emissions are shifted to the location of the generation plants.[31] In a similar manner, plug-in electric vehicles operating in all-electric mode do not emit greenhouse gases from the onboard source of power, but from the point of view of a well-to-wheel assessment, the extent of the benefit also depends on the fuel and technology used for electricity generation. This fact has been referred to as the long tailpipe of plug-in electric vehicles. From the perspective of a full life cycle analysis, the electricity used to recharge the batteries must be generated from renewable or clean sources such as wind, solar, hydroelectric, or nuclear power for PEVs to have almost none or zero well-to-wheel emissions.[1][31] On the other hand, when PEVs are recharged from coal-fired plants, they usually produce slightly more greenhouse gas emissions than internal combustion engine vehicles and higher than hybrid electric vehicles.[31][37] In the case of plug-in hybrid electric vehicles operating in hybrid mode with assistance of the internal combustion engine, tailpipe and greenhouse emissions are lower in comparison to conventional cars because of their higher fuel economy.[1]
The magnitude of the potential advantage depends on the mix of generation sources and therefore varies by country and by region. For example, France can obtain significant emission benefits from electric and plug-in hybrids because most of its electricity is generated by nuclear power plants; similarly, most regions of Canada are primarily powered with hydroelectricity, nuclear, or natural gas which have no or very low emissions at the point of generation; and the state of California, where most energy comes from natural gas, hydroelectric and nuclear plants can also secure substantial emission benefits. The United Kingdom also has a significant potential to benefit from PEVs as natural gas plants dominate the generation mix. On the other hand, emission benefits in Germany, China, India, and the central regions of the United States are limited or non-existent because most electricity is generated from coal.[31][38] However these countries and regions might still obtain some air quality benefits by reducing local air pollution in urban areas. Cities with chronic air pollution problems, such as Los Angeles, México City, Santiago, Chile, São Paulo, Beijing, Bangkok and Kathmandu may also gain local clean air benefits by shifting the harmful emission to electric generation plants located outside the cities. Nevertheless, the location of the plants is not relevant when considering greenhouse gas emission because their effect is global.[31]
Carbon footprint during production
- Ricardo
A report published in June 2011, prepared by Ricardo in collaboration with experts from the UK's Low Carbon Vehicle Partnership, found that hybrid electric cars, plug-in hybrids and all-electric cars generate more carbon emissions during their production than current conventional vehicles, but still have a lower overall carbon footprint over the full life cycle. The higher carbon footprint during production of electric drive vehicles is due mainly to the production of batteries. As an example, 43 percent of production emissions for a mid-size electric car are generated from the battery production, while for standard mid-sized gasoline internal combustion engine vehicle, around 75% of the embedded carbon emissions during production comes from the steel used in the vehicle glider.[39] The following table summarizes key results of this study for four powertrain technologies:
| Comparison of full life cycle assessment (well-to-wheels) of carbon emissions and carbon footprint during production for four different powertrain technologies[39] | |||
|---|---|---|---|
| Type of vehicle (powertrain) | Estimated emissions in production (tonnes CO2e) | Estimated lifecycle emissions (tonnes CO2e) | Percentage of emissions during production |
| Standard gasoline vehicle | 5.6 | 24 | 23% |
| Hybrid electric vehicle | 6.5 | 21 | 31% |
| Plug-in hybrid electric vehicle | 6.7 | 19 | 35% |
| Battery electric vehicle | 8.8 | 19 | 46% |
| Notes: Estimates based upon a 2015 model vehicle assuming 150,000 km (93,000 mi) full life travel using 10% ethanol blend and 500g/kWh grid electricity. | |||
The Ricardo study also found that the lifecycle carbon emissions for mid-sized gasoline and diesel vehicles are almost identical, and that the greater fuel efficiency of the diesel engine is offset by higher production emissions.[39]
- Volkswagen
In 2014 Volkswagen published the results of life-cycle assessment of its electric vehicles certified by TÜV NORD, and independent inspection agency. The study found that CO
2 emissions during the use phase of its all-electric VW e-Golf are 99% lower than those of the Golf 1.2 TSI when powers come from exclusively hydroelectricity generated in Germany, Austria, and Switzerland. Accounting for the full lifecycle, the e-Golf reduces emissions by 61%, offsetting higher production emissions. When the actual EU-27 electricity mix is considered, the e-Golf emissions are still 26% lower than those of the conventional Golf 1.2 TSI. Similar results were found when comparing the e-Golf with the Golf 1.6 TDI. The analysis considered recycling of the three vehicles at the end of their lifetime.[40]
Well-to-wheel GHG emissions in the U.S.
- Environmental Protection Agency
The following table compares tailpipe and upstream CO
2 emissions estimated by the U.S. Environmental Protection Agency for all series production model year 2014 plug-in electric vehicles available in the U.S. market. Total emissions include the emissions associated with the production and distribution of electricity used to charge the vehicle, and for plug-in hybrid electric vehicles, it also includes emissions associated with tailpipe emissions produced from the internal combustion engine. These figures were published by the EPA in October 2014 in its annual report "Light-Duty Automotive Technology, Carbon Dioxide Emissions, and Fuel Economy Trends: 1975 Through 2014." All emissions are estimated considering average real world city and highway operation based on the EPA 5-cycle label methodology, using a weighted 55% city and 45% highway driving. For the first time, the 2014 Trends report presents an analysis of the impact of alternative fuel vehicles, with an emphasis in plug-in electric vehicles because as their market share is approaching 1%, the EPA concluded that PEVs began to have a measurable impact on the U.S. overall new vehicle fuel economy and CO
2 emissions.[41][42]
For purposes of an accurate estimation of emissions, the analysis took into consideration the differences in operation between plug-in hybrids. Some, like the Chevrolet Volt, can operate in all-electric mode without using gasoline, and others operate in a blended mode like the Toyota Prius PHV, which uses both energy stored in the battery and energy from the gasoline tank to propel the vehicle, but that can deliver substantial all-electric driving in blended mode. In addition, since the all-electric range of plug-in hybrids depends on the size of the battery pack, the analysis introduced a utility factor as a projection of the share of miles that will be driven using electricity by an average driver, for both, electric only and blended EV modes. Since all-electric cars do not produce tailpipe emissions, the utility factor applies only to plug-in hybrids. The following table shows the overall fuel economy expressed in terms of miles per gallon gasoline equivalent (mpg-e) and the utility factor for the ten MY2014 plug-in hybrids available in the U.S. market, and EPA's best estimate of the CO
2 tailpipe emissions produced by these PHEVs.[41]
In order to account for the upstream CO
2 emissions associated with the production and distribution of electricity, and since electricity production in the United States vary significantly from region to region, the EPA considered three scenarios/ranges with the low end scenario corresponding to the California powerplant emissions factor, the middle of the range represented by the national average powerplant emissions factor, and the upper end of the range corresponding to the powerplant emissions factor for the Rocky Mountains. The EPA estimates that the electricity GHG emission factors for various regions of the country vary from 346 g CO
2/kWh in California to 986 g CO
2/kWh in the Rockies, with a national average of 648 g CO
2/kWh.[41]
| Comparison of tailpipe and upstream CO 2 emissions(1) estimated by EPA for the MY 2014 plug-in electric vehicles available in the U.S. market[41] | ||||||
|---|---|---|---|---|---|---|
| Vehicle | Overall fuel economy (mpg-e) | Utility factor(2) (share EV miles) | Tailpipe CO 2 (g/mi) | Tailpipe + Total Upstream CO2 | ||
| Low (g/mi) | Avg (g/mi) | High (g/mi) | ||||
| BMW i3 | 124 | 1 | 0 | 93 | 175 | 266 |
| Chevrolet Spark EV | 119 | 1 | 0 | 97 | 181 | 276 |
| Honda Fit EV | 118 | 1 | 0 | 99 | 185 | 281 |
| Fiat 500e | 116 | 1 | 0 | 101 | 189 | 288 |
| Nissan Leaf | 114 | 1 | 0 | 104 | 194 | 296 |
| Mitsubishi i | 112 | 1 | 0 | 104 | 195 | 296 |
| Smart electric drive | 107 | 1 | 0 | 109 | 204 | 311 |
| Ford Focus Electric | 105 | 1 | 0 | 111 | 208 | 316 |
| Tesla Model S (60 kWh) | 95 | 1 | 0 | 122 | 229 | 348 |
| Tesla Model S (85 kWh) | 89 | 1 | 0 | 131 | 246 | 374 |
| BMW i3 REx(3) | 88 | 0.83 | 40 | 134 | 207 | 288 |
| Mercedes-Benz B-Class ED | 84 | 1 | 0 | 138 | 259 | 394 |
| Toyota RAV4 EV | 76 | 1 | 0 | 153 | 287 | 436 |
| BYD e6 | 63 | 1 | 0 | 187 | 350 | 532 |
| Chevrolet Volt | 62 | 0.66 | 81 | 180 | 249 | 326 |
| Toyota Prius Plug-in Hybrid | 58 | 0.29 | 133 | 195 | 221 | 249 |
| Honda Accord Plug-in Hybrid | 57 | 0.33 | 130 | 196 | 225 | 257 |
| Cadillac ELR | 54 | 0.65 | 91 | 206 | 286 | 377 |
| Ford C-Max Energi | 51 | 0.45 | 129 | 219 | 269 | 326 |
| Ford Fusion Energi | 51 | 0.45 | 129 | 219 | 269 | 326 |
| BMW i8 | 37 | 0.37 | 198 | 303 | 351 | 404 |
| Porsche Panamera S E-Hybrid | 31 | 0.39 | 206 | 328 | 389 | 457 |
| McLaren P1 | 17 | 0.43 | 463 | 617 | 650 | 687 |
| Average MY 2014 gasoline car | 24.2 | 0 | 367 | 400 | 400 | 400 |
| Notes: (1) Based on 45% highway and 55% city driving. (2) The utility factor represents, on average, the percentage of miles that will be driven using electricity (in electric only and blended modes) by an average driver. (3) The EPA classifies the i3 REx as a series plug-in hybrid[41][43][44] | ||||||
- Union of Concerned Scientists
The Union of Concerned Scientists (UCS) published a study in 2012 that assessed average greenhouse gas emissions in the U.S. resulting from charging plug-in car batteries from the perspective of the full life-cycle (well-to-wheel analysis) and according to fuel and technology used to generate electric power by region. The study used the model year 2011 Nissan Leaf all-electric car to establish the analysis baseline, and electric-utility emissions are based on EPA's 2009 estimates. The UCS study expressed the results in terms of miles per gallon instead of the conventional unit of grams of greenhouse gases or carbon dioxide equivalent emissions per year in order to make the results more friendly for consumers. The study found that in areas where electricity is generated from natural gas, nuclear, hydroelectric or renewable sources, the potential of plug-in electric cars to reduce greenhouse emissions is significant. On the other hand, in regions where a high proportion of power is generated from coal, hybrid electric cars produce less CO
2 equivalent emissions than plug-in electric cars, and the best fuel efficient gasoline-powered subcompact car produces slightly less emissions than a PEV. In the worst-case scenario, the study estimated that for a region where all energy is generated from coal, a plug-in electric car would emit greenhouse gas emissions equivalent to a gasoline car rated at a combined city/highway driving fuel economy of 30 mpg‑US (7.8 L/100 km; 36 mpg‑imp). In contrast, in a region that is completely reliant on natural gas, the PEV would be equivalent to a gasoline-powered car rated at 50 mpg‑US (4.7 L/100 km; 60 mpg‑imp).[45][46]
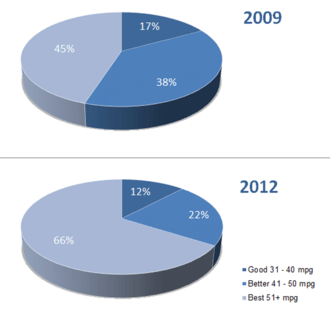
The study concluded that for 45% of the U.S. population, a plug-in electric car will generate lower CO
2 equivalent emissions than a gasoline-powered car capable of combined 50 mpg‑US (4.7 L/100 km; 60 mpg‑imp), such as the Toyota Prius and the Prius c. The UCS also found that for 37% of the population, the electric car emissions will fall in the range of a gasoline-powered car rated at a combined fuel economy of 41 to 50 mpg‑US (5.7 to 4.7 L/100 km; 49 to 60 mpg‑imp), such as the Honda Civic Hybrid and the Lexus CT200h. Only 18% of the population lives in areas where the power-supply is more dependent on burning carbon, and the greenhouse gas emissions will be equivalent to a car rated at a combined fuel economy of 31 to 40 mpg‑US (7.6 to 5.9 L/100 km; 37 to 48 mpg‑imp), such as the Chevrolet Cruze and Ford Focus.[46][47][48] The study found that there are no regions in the U.S. where plug-in electric cars will have higher greenhouse gas emissions than the average new compact gasoline engine automobile, and the area with the dirtiest power supply produces CO
2 emissions equivalent to a gasoline-powered car rated at 33 mpg‑US (7.1 L/100 km).[45]
In September 2014 the UCS published an updated analysis of its 2012 report. The 2014 analysis found that 60% of Americans, up from 45% in 2009, live in regions where an all-electric car produces fewer CO
2 equivalent emissions per mile than the most efficient hybrid. The UCS study found several reasons for the improvement. First, electric utilities have adopted cleaner sources of electricity to their mix between the two analysis. The 2014 study used electric-utility emissions based on EPA's 2010 estimates, but since coal use nationwide is down by about 5% from 2010 to 2014, actual efficiency in 2014 is better than estimated in the UCS study. Second, electric vehicles have become more efficient, as the average 2013 all-electric vehicle used 0.33 kWh per mile, representing a 5% improvement over 2011 models. Also, some new models are cleaner than the average, such as the BMW i3, which is rated at 0.27 kWh by the EPA. An i3 charged with power from the Midwest grid would be as clean as a gasoline-powered car with about 50 mpg‑US (4.7 L/100 km), up from 39 mpg‑US (6.0 L/100 km) for the average electric car in the 2012 study. In states with a cleaner mix generation, the gains were larger. The average all-electric car in California went up to 95 mpg‑US (2.5 L/100 km) equivalent from 78 mpg‑US (3.0 L/100 km) in the 2012 study. States with the dirtier generation that rely heavily on coal still lag, such as Colorado, where the average BEV only achieves the same emissions as a 34 mpg‑US (6.9 L/100 km; 41 mpg‑imp) gasoline-powered car. The author of the 2014 analysis noted that the benefits are not distributed evenly across the U.S. because electric car adoptions are concentrated in the states with cleaner power.[49][50]
In November 2015 the Union of Concerned Scientists published a new report comparing two battery electric vehicles (BEVs) with similar gasoline vehicles by examining their global warming emissions over their full life-cycle, cradle-to-grave analysis. The two BEVs modeled, midsize and full-size, are based on the two most popular BEV models sold in the United States in 2015, the Nissan Leaf and the Tesla Model S. The study found that all-electric cars representative of those sold today, on average produce less than half the global warming emissions of comparable gasoline-powered vehicles, despite taking into account the higher emissions associated with BEV manufacturing. Considering the regions where the two most popular electric cars are being sold, excess manufacturing emissions are offset within 6 to 16 months of average driving. The study also concluded that driving an average EV results in lower global warming emissions than driving a gasoline car that gets 50 mpg‑US (4.7 L/100 km) in regions covering two-thirds of the U.S. population, up from 45% in 2009. Based on where EVs are being sold in the United States in 2015, the average EV produces global warming emissions equal to a gasoline vehicle with a 68 mpg‑US (3.5 L/100 km) fuel economy rating. The authors identified two main reasons for the fact that EV-related emissions have become even lower in many parts of the country since the first study was conducted in 2012. Electricity generation has been getting cleaner, as coal-fired generation has declined while lower-carbon alternatives have increased. In addition, electric cars are becoming more efficient. For example, the Nissan Leaf and the Chevrolet Volt, have undergone improvements to increase their efficiencies compared to the original models launched in 2010, and other even more efficient BEV models, such as the most lightweight and efficient BMW i3, have entered the market.[51][52]
- National Bureau of Economic Research
One criticism of the UCS study is that the analysis was made using average emissions rates across regions instead of the marginal generation at different times of the day. The former approach does not take into account the generation mix within interconnected electricity markets and shifting load profiles throughout the day.[53][54] An analysis by three economists affiliated with the National Bureau of Economic Research (NBER), published in November 2014, developed a methodology to estimate marginal emissions of electricity demand that vary by location and time of day across the United States. The marginal analysis, applied to plug-in electric vehicles, found that the emissions of charging PEVs vary by region and hours of the day. In some regions, such as the Western U.S. and Texas, CO
2 emissions per mile from driving PEVs are less than those from driving a hybrid car. However, in other regions, such as the Upper Midwest, charging during the recommended hours of midnight to 4 a.m. implies that PEVs generate more emissions per mile than the average car currently on the road. The results show a fundamental tension between electricity load management and environmental goals as the hours when electricity is the least expensive to produce tend to be the hours with the greatest emissions. This occurs because coal-fired units, which have higher emission rates, are most commonly used to meet base-level and off-peak electricity demand; while natural gas units, which have relatively low emissions rates, are often brought online to meet peak demand.[54]
Well-to-wheel GHG emissions in several countries
A study published in the UK in April 2013 assessed the carbon footprint of plug-in electric vehicles in 20 countries. As a baseline the analysis established that manufacturing emissions account for 70 g CO2/km for an electric car and 40 g CO2/km for a petrol car. The study found that in countries with the coal-intensive generation, PEVs are no different from conventional petrol-powered vehicles. Among these countries are China, Indonesia, Australia, South Africa, and India. A pure electric car in India generates emissions comparable to a 20 mpg‑US (12 L/100 km; 24 mpg‑imp) petrol car.[55][56]
The country ranking was led by Paraguay, where all electricity is produced from hydropower, and Iceland, where electricity production relies on renewable power, mainly hydro and geothermal power. Resulting carbon emissions from an electric car in both countries are 70 g CO2/km, which is equivalent to a 220 mpg‑US (1.1 L/100 km; 260 mpg‑imp) petrol car, and correspond to manufacturing emissions. Next in the ranking are other countries with low carbon electricity generation, including Sweden (mostly hydro and nuclear power ), Brazil (mainly hydropower) and France (predominantly nuclear power). Countries ranking in the middle include Japan, Germany, the UK and the United States.[55][56][57]
The following table shows the emissions intensity estimated in the study for those countries where electric vehicle are available, and the corresponding emissions equivalent in miles per US gallon of a petrol-powered car:
| Country comparison of full life cycle assessment of greenhouse gas emissions resulting from charging plug-in electric cars and emissions equivalent in terms of miles per US gallon of a petrol-powered car[55][57] | ||||
|---|---|---|---|---|
| Country | PEV well-to-wheels carbon dioxide equivalent emissions per electric car expressed in (CO2e/km) | Power source | PEV well-to-wheels emissions equivalent in terms of mpg US of petrol-powered car | Equivalent petrol car |
| 81 | Low carbon | 159 mpg‑US (1.48 L/100 km) | Hybrid multiples | |
| 93 | 123 mpg‑US (1.91 L/100 km) | |||
| 115 | Fossil light | 87 mpg‑US (2.7 L/100 km) | Beyond hybrid | |
| 146 | 61 mpg‑US (3.9 L/100 km) | |||
| 175 | Broad mix | 48 mpg‑US (4.9 L/100 km) | New hybrid | |
| 179 | 47 mpg‑US (5.0 L/100 km) | |||
| 189 | 44 mpg‑US (5.3 L/100 km) | |||
| 202 | Fossil heavy | 40 mpg‑US (5.9 L/100 km) | Efficient petrol | |
| 203 | 40 mpg‑US (5.9 L/100 km) | |||
| 258 | Coal-based | 30 mpg‑US (7.8 L/100 km) | Average petrol | |
| 292 | 26 mpg‑US (9.0 L/100 km) | |||
| 370 | 20 mpg‑US (12 L/100 km) | |||
| Note: Electric car manufacturing emissions account for 70 g CO2/km Source: Shades of Green: Electric Cars’ Carbon Emissions Around the Globe, Shrink That Footprint, February 2013.[57] | ||||
Less dependence on imported oil

For many net oil importing countries the 2000s energy crisis brought back concerns first raised during the 1973 oil crisis. For the United States, the other developed countries and emerging countries their dependence on foreign oil has revived concerns about their vulnerability to price shocks and supply disruption. Also, there have been concerns about the uncertainty surrounding peak oil production and the higher cost of extracting unconventional oil. A third issue that has been raised is the threat to national security because most proven oil reserves are concentrated in relatively few geographic locations, including some countries with strong resource nationalism, unstable governments or hostile to U.S. interests.[31][58][59] In addition, for many developing countries, and particularly for the poorest African countries, high oil prices have an adverse impact on the government budget and deteriorate their terms of trade thus jeopardizing their balance of payments, all leading to lower economic growth.[60][61]
Through the gradual replacement of internal combustion engine vehicles for electric cars and plug-in hybrids, electric drive vehicles can contribute significantly to lessen the dependence of the transport sector on imported oil as well as contributing to the development of a more resilient energy supply.[31][58][59][62]
Vehicle-to-grid
Plug-in electric vehicles offer users the opportunity to sell electricity stored in their batteries back to the power grid, thereby helping utilities to operate more efficiently in the management of their demand peaks.[63] A vehicle-to-grid (V2G) system would take advantage of the fact that most vehicles are parked an average of 95 percent of the time. During such idle times the electricity stored in the batteries could be transferred from the PEV to the power lines and back to the grid. In the U.S. this transfer back to the grid have an estimated value to the utilities of up to $4,000 per year per car.[64] In a V2G system it would also be expected that battery electric (BEVs) and plug-in hybrids (PHEVs) would have the capability to communicate automatically with the power grid to sell demand response services by either delivering electricity into the grid or by throttling their charging rate.[63][65][66]
Disadvantages
Cost of batteries and cost of ownership
- Cost of batteries
As of 2015, plug-in electric vehicles are significantly more expensive as compared to conventional internal combustion engine vehicles and hybrid electric vehicles due to the additional cost of their lithium-ion battery pack. According to a 2010 study by the National Research Council, the cost of a lithium-ion battery pack was about US$1,700/kWh of usable energy, and considering that a PHEV-10 requires about 2.0 kWh and a PHEV-40 about 8 kWh, the manufacturer cost of the battery pack for a PHEV-10 is around US$3,000 and it goes up to US$14,000 for a PHEV-40.[67][68] As of June 2012, and based on the three battery size options offered for the Tesla Model S, the New York Times estimated the cost of automotive battery packs between US$400 to US$500 per kilowatt-hour.[69] A 2013 study by the American Council for an Energy-Efficient Economy reported that battery costs came down from US$1,300 per kWh in 2007 to US$500 per kWh in 2012. The U.S. Department of Energy has set cost targets for its sponsored battery research of US$300 per kWh in 2015 and US$125 per kWh by 2022. Cost reductions through advances in battery technology and higher production volumes will allow plug-in electric vehicles to be more competitive with conventional internal combustion engine vehicles.[70]
According to a study published in February 2016 by Bloomberg New Energy Finance (BNEF), battery prices fell 65% since 2010, and 35% just in 2015, reaching US$350 per kWh. The study concludes that battery costs are on a trajectory to make electric vehicles without government subsidies as affordable as internal combustion engine cars in most countries by 2022. BNEF projects that by 2040, long-range electric cars will cost less than US$22,000 expressed in 2016 dollars. BNEF expects electric car battery costs to be well below US$120 per kWh by 2030, and to fall further thereafter as new chemistries become available.[71]
- Cost of ownership
A study published in 2011 by the Belfer Center, Harvard University, found that the gasoline costs savings of plug-in electric cars do not offset their higher purchase prices when comparing their lifetime net present value of purchase and operating costs for the U.S. market at 2010 prices, and assuming no government subidies. According to the study estimates, a PHEV-40 is US$5,377 more expensive than a conventional internal combustion engine, while a battery electric vehicles is US$4,819 more expensive.[72] These findings assumed a battery cost of US$600 per kWh, which means that the Chevrolet Volt battery pack cost around US$10,000 and the Nissan Leaf pack costs US$14,400. The study also assumed a gasoline price of US$3.75 per gallon (as of mid June 2011), that vehicles are driven 12,000 miles (19,000 km) per year, an average price of electricity of US$0.12 per kWh, that the plug-in hybrid is driven in all-electric mode 85% of the time, and that the owner of PEVs pay US$1,500 to install a Level II 220/240 volt charger at home.[73]
The study also includes hybrid electric vehicles in the comparison, and analyzed several scenarios to determine how the comparative net savings will change over the next 10 to 20 years, assuming that battery costs will decrease while gasoline prices increase, and also assuming higher fuel efficiency of conventional cars, among other scenarios. Under the future scenarios considered, the study found that BEVs will be significantly less expensive than conventional cars (US$1,155 to US$7,181 cheaper), while PHEVs, will be more expensive than BEVs in almost all comparison scenarios, and only less expensive than conventional cars in a scenario with very low battery costs and high gasoline prices. The reason for the different savings among PEVs is because BEVs are simpler to build and do not use liquid fuel, while PHEVs have more complicated powertrains and still have gasoline-powered engines. The following table summarizes the results of four of the seven scenarios analyzed by the study.[73]
| Comparison of net lifetime savings among conventional gasoline-powered cars, hybrids and plug-in electric cars for several scenarios (U.S. market at 2010 prices)[73] | ||||
|---|---|---|---|---|
| Description | Conventional ICE | Hybrid electric (HEV) | Plug-in hybrid (PHEV) | Battery electric (BEV) |
| Scenario: 2010 costs (battery US$600 per kWh, gasoline US$3.75 per gallon, and electricity US$0.12 per kWh) | ||||
| Purchase price | US$21,390 | US$22,930 | US$30,235 | US$33,565 |
| Total net present cost | US$32,861 | US$33,059 | US$38,239 | US$37,680 |
| Cost differential with conventional car | - | US$197 | US$5,377 | US$4,819 |
| Scenario: Future Costs – Lower battery cost and higher gasoline and electricity prices (battery US$300 per kWh, gasoline US$4.50 per gallon, and electricity US$0.15 per kWh) | ||||
| Total net present cost | US$34,152 | US$32,680 | US$34,601 | US$30,674 |
| Cost differential with conventional car | - | (US$1,472) | US$449 | (US$3,478) |
| Scenario: Future Costs – Low battery cost and higher gasoline and electricity prices (battery US$150 per kWh, gasoline US$4.50 per gallon, and electricity US$0.15 per kWh) | ||||
| Total net present cost | US$34,152 | US$32,080 | US$32,549 | US$26,971 |
| Cost differential with conventional car | - | (US$2,072) | (US$1,603) | (US$7,181) |
| Scenario: Higher fuel efficiency ICEs:50 miles per US gallon (4.7 L/100 km; 60 mpg‑imp) HEVs and PHEVs: 75 miles per US gallon (3.1 L/100 km; 90 mpg‑imp) (battery US$300 per kWh, gasoline US$4.50 per gallon, and electricity US$0.15 per kWh) | ||||
| Total net present cost | US$32,829 | US$31,366 | US$34,403 | US$30,674 |
| Cost differential with conventional car | - | (US$463) | US$2,574 | (US$1,155) |
| Note: Assumes vehicles are driven 12,000 miles (19,000 km) per year and plug-in hybrid is driven in all-electric mode 85% of the time. Does not take into account other differences in cost of ownership. | ||||
According to a study by the Electric Power Research Institute published in June 2013, the total cost of ownership of the 2013 Nissan Leaf SV is substantially lower than that of comparable conventional and hybrid vehicles. For comparison, the study constructed average hybrid and conventional vehicles and assumed an average US distance per trip distribution. The study took into account the manufacturer's suggested retail price, taxes, credits, destination charge, electric charging station, fuel cost, maintenance cost, and additional cost due to the use of a gasoline vehicle for trips beyond the range of the Leaf.[74]
| Electric Power Research Institute comparison of the Leaf versus average conventional and hybrid cars. | |||||||||
|---|---|---|---|---|---|---|---|---|---|
| Vehicle | Operating mode (powertrain) | Total ownership cost | |||||||
| US Average | California | ||||||||
| Nissan Leaf SV | All-electric | $37,288 | $35,596 | ||||||
| Chevrolet Volt | Plug-in hybrid | $44,176 | $40,800 | ||||||
| Average Conventional | Gasoline | $44,949 | $46,561 | ||||||
| Average Hybrid | Gasoline-electric hybrid | $44,325 | $45,416 | ||||||
| Notes: Costs are based on a gasoline price of $3.64 per gallon, an electricity rate of $0.12/kWh, and a vehicle lifetime of 150,000 miles. The average conventional car was constructed by averaging of Honda Civic EX, Chevrolet Cruze LTZ, Ford Focus Titanium, and Volkswagen Passat. The average hybrid car was constructed from Ford Fusion Hybrid, Honda Civic Hybrid, Toyota Camry Hybrid XLE, and Toyota Prius trim IV. | |||||||||
Availability of recharging infrastructure

Despite the widespread assumption that plug-in recharging will take place overnight at home, residents of cities, apartments, dormitories, and townhouses do not have garages or driveways with available power outlets, and they might be less likely to buy plug-in electric vehicles unless recharging infrastructure is developed.[75][76] Electrical outlets or charging stations near their places of residence, in commercial or public parking lots, streets and workplaces are required for these potential users to gain the full advantage of PHEVs, and in the case of EVs, to avoid the fear of the batteries running out energy before reaching their destination, commonly called range anxiety.[76][77] Even house dwellers might need to charge at the office or to take advantage of opportunity charging at shopping centers.[78] However, this infrastructure is not in place and it will require investments by both the private and public sectors.[77]
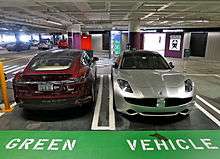
Several cities in California and Oregon, and particularly San Francisco and other cities in the San Francisco Bay Area and Silicon Valley, already have deployed public charging stations and have expansion plans to attend both plug-ins and all-electric cars.[77] Some local private firms such as Google and Adobe Systems have also deployed charging infrastructure. In Google's case, its Mountain View campus has 100 available charging stations for its share-use fleet of converted plug-ins available to its employees.[77][79] Solar panels are used to generate the electricity, and this pilot program is being monitored on a daily basis and performance results are published on the RechargeIT website.[79] As of December 2013, Estonia is the first and only country that had deployed an EV charging network with nationwide coverage, with 165 fast chargers available along highways at a minimum distance of between 40 to 60 km (25 to 37 mi), and a higher density in urban areas.[80][81][82]
The importance to build the infrastructure necessary to support electric vehicles is illustrated by the decision of Car2Go in San Diego, California, that due to insufficient charging infrastructure decided to replace all of its all-electric car fleet with gasoline-powered cars starting on 1 May 2016. When the carsharing service started in 2011, Car2Go expected 1,000 charging stations to be deployed around the city, but only 400 were in place by early 2016. As a result, an average of 20% of the carsharing fleet is unavailable at any given time because the cars are either being charged or because they don't have enough electricity in them to be driven. Also, many of the company's 40,000 San Diego members say they often worry their Car2Go will run out of charge before they finish their trip.[83]
Battery swapping

A different approach to resolve the problems of range anxiety and lack of recharging infrastructure for electric vehicles was developed by Better Place. Its business model considers that electric cars are built and sold separately from the battery pack. As customers are not allowed to purchase battery packs, they must lease them from Better Place which will deploy a network of battery swapping stations thus expanding EVs range and allowing long distance trips. Subscribed users pay a per-distance fee to cover battery pack leasing, charging and swap infrastructure, the cost of sustainable electricity, and other costs.[84][85] Better Place signed agreement for deployment in Australia, Denmark, Israel, Canada, California, and Hawaii.[86] The Renault Fluence Z.E. was the electric car built with switchable battery technology sold for the Better Place network.[87] The robotic battery-switching operation was completed in about five minutes.[88]
After implementing the first modern commercial deployment of the battery swapping model in Israel and Denmark, Better Place filed for bankruptcy in Israel in May 2013. The company's financial difficulties were caused by the high investment required to develop the charging and swapping infrastructure, about US$850 million in private capital, and a market penetration significantly lower than originally predicted by Shai Agassi. Less than 1,000 Fluence Z.E. cars were deployed in Israel and around 400 units in Denmark.[89][90]
Tesla Motors designed its Model S to allow fast battery swapping.[91] In June 2013, Tesla announced their goal to deploy a battery swapping station in each of its supercharging stations. At a demonstration event Tesla showed that a battery swap operation with the Model S takes just over 90 seconds, about half the time it takes to refill a gasoline-powered car used for comparison purposes during the event.[92][93] The first stations are planned to be deployed along Interstate 5 in California where, according to Tesla, a large number of Model S sedans make the San Francisco-Los Angeles trip regularly. These will be followed by the Washington, DC to Boston corridor.[92]
Other charging solutions

The REVA NXR exhibited in the 2009 Frankfurt Motor Show and the Nissan Leaf SV trim both have roof-mounted solar panels. These solar panels are designed to trickle charge the batteries when the car is moving or parked.[94][95][96] Another proposed technology is REVive, by Reva. When the REVA NXR's batteries are running low or are fully depleted, the driver is able to send an SMS to REVive and unlock a hidden reserve in the battery pack. Reva has not provided details on how the system will work.[97][98] The Fisker Karma uses solar panel in the roof to recharge the 12-volt lead-acid accessory battery.[99] The Nissan Leaf SL trim also has a small solar panel at the rear of the roof/spoiler that can trickle charge the auxiliary 12-volt lead-acid battery.[100]
Potential overload of the electrical grid
The existing electrical grid, and local transformers in particular, may not have enough capacity to handle the additional power load that might be required in certain areas with high plug-in electric car concentrations. As recharging a single electric-drive car could consume three times as much electricity as a typical home, overloading problems may arise when several vehicles in the same neighborhood recharge at the same time, or during the normal summer peak loads. To avoid such problems, utility executives recommend owners to charge their vehicles overnight when the grid load is lower or to use smarter electric meters that help control demand. When market penetration of plug-in electric vehicles begins to reach significant levels, utilities will have to invest in improvements for local electrical grids in order to handle the additional loads related to recharging to avoid blackouts due to grid overload. Also, some experts have suggested that by implementing variable time-of-day rates, utilities can provide an incentive for plug-in owners to recharge mostly overnight when rates are lower.[77][101][102]
General Motors is sponsoring the Pecan Street demonstration project in Austin, Texas. The project objective is to learn the charging patterns of plug-in electric car owners and to study how a residential fleet of electric vehicles might strain the electric grid if all owners try to charge them at the same, which is what the preliminary monitoring found when the plug-in cars return home in the evening. The Mueller neighborhood is the testing ground, and as of June 2013, the community has nearly 60 Chevrolet Volt owners alone. This cluster of Volts was achieved thanks to GM's commitment to match the federal government's $7,500 rebate incentive, which effectively halves the purchase price of the plug-hybrid electric cars.[103]
In the 5 years from 2014 to 2019, EVs increased in number and range, and doubled power draw and energy per session. Charging increased after midnight, and decreased in the peak hours of early evening.[104][105]
Risks associated with noise reduction
Electric cars and plug-in hybrids when operating in all-electric mode at low speeds produce less roadway noise as compared to vehicles propelled by an internal combustion engine, thereby reducing harmful noise health effects. However, blind people or the visually impaired consider the noise of combustion engines a helpful aid while crossing streets, hence plug-in electric cars and conventional hybrids could pose an unexpected hazard when operating at low speeds.[106][107] Several tests conducted in the U.S. have shown that this is a valid concern, as vehicles operating in electric mode can be particularly hard to hear below 20 mph (30 km/h) for all types of road users and not only the visually impaired.[108][109][110] At higher speeds the sound created by tire friction and the air displaced by the vehicle start to make sufficient audible noise.[107]
The Japanese Ministry of Land, Infrastructure, Transport and Tourism issued guidelines for hybrid and other near-silent vehicles in January 2010.[111] In the United States the Pedestrian Safety Enhancement Act of 2010 was approved by the U.S. Senate and the House of Representatives in December 2010.[112][113][114] After several delays, the National Highway Traffic Safety Administration (NHTSA) issued its ruling in February 2018. It requires hybrids and electric vehicles traveling at less than 18.6 mph (30 km/h) to emit warning sounds that pedestrians must be able to hear over background noises. The regulation requires full compliance in September 2020, but 50% of "quiet" vehicles must have the warning sounds by September 2019.[115]
In April 2014 the European Parliament approved legislation that requires the mandatory use of the AVAS for all new electric and hybrid electric vehicles and car manufacturers have to comply within 5 years.[116]
Risks of battery fire

Lithium-ion batteries may suffer thermal runaway and cell rupture if overheated or overcharged, and in extreme cases this can lead to combustion.[117] To reduce these risks, lithium-ion battery packs contain fail-safe circuitry that shuts down the battery when its voltage is outside the safe range.[118][119] When handled improperly, or if manufactured defectively, some rechargeable batteries can experience thermal runaway resulting in overheating. Especially prone to thermal runaway are lithium-ion batteries. Reports of exploding cellphones have been reported in newspapers. In 2006, batteries from Apple, HP, Toshiba, Lenovo, Dell and other notebook manufacturers were recalled because of fire and explosions.[120][121][122][123] Also, during the Boeing 787 Dreamliner's first year of service, at least four aircraft suffered from electrical system problems stemming from its lithium-ion batteries, resulting in the whole Dreamliner fleet being voluntarily grounded in January 2013.[124][125]
Several plug-in electric vehicle fire incidents have taken place since the introduction of mass-production plug-in electric vehicles in 2008. Most of them have been thermal runaway incidents related to the lithium-ion batteries and have involved the Zotye M300 EV, Chevrolet Volt, Fisker Karma, BYD e6, Dodge Ram 1500 Plug-in Hybrid, Toyota Prius Plug-in Hybrid, Mitsubishi i-MiEV and Outlander P-HEV. As of November 2013, four fires after a crash have been reported associated with the batteries of all-electric cars involving a BYD e6 and three Tesla Model S cars.
The first modern crash-related fire was reported in China in May 2012, after a high-speed car crashed into a BYD e6 taxi in Shenzhen.[126] The second reported incident occurred in the United States on October 1, 2013, when a Tesla Model S caught fire after the electric car hit metal debris on a highway in Kent, Washington state, and the debris punctured one of 16 modules within the battery pack.[127][128] A second reported fire occurred on October 18, 2013, in Merida, Mexico. In this case the vehicle was being driven at high speed through a roundabout and crashed through a wall and into a tree. On November 6, 2013, a Tesla Model S being driven on Interstate 24 near Murfreesboro, Tennessee caught fire after it struck a tow hitch on the roadway, causing damage beneath the vehicle.[129]
The U.S. National Highway Traffic Safety Administration (NHTSA) is conducting a study due in 2014 to establish whether lithium-ion batteries in plug-electric vehicles pose a potential fire hazard. The research is looking at whether the high-voltage batteries can cause fires when they are being charged and when the vehicles are involved in an accident.[130] Both General Motors and Nissan have published a guide for firefighters and first responders to properly handle a crashed plug-in electric-drive vehicle and safely disable its battery and other high voltage systems.[131][132]
Rare-earth metals availability and supply security
Common technology for plug-ins and electric cars is based on the lithium-ion battery and an electric motor which uses rare-earth elements. The demand for lithium, heavy metals, and other specific elements (such as neodymium, boron and cobalt) required for the batteries and powertrain is expected to grow significantly due to the future sales increase of plug-in electric vehicles in the mid and long term.[133][134] As of 2011, the Toyota Prius battery contains more than 20 lb (9.1 kg) of the rare-earth element lanthanum,[135] and its motor magnets use neodymium and dysprosium.[136] While only 0.25 oz (7 g) of lithium carbonate equivalent (LCE) are required in a smartphone and 1.1 oz (30 g) in a tablet computer, electric vehicles and stationary energy storage systems for homes, businesses or industry use much more lithium in their batteries. As of 2016 a hybrid electric passenger car might use 11 lb (5 kg) of LCE, while one of Tesla's high performance electric cars could use as much as 180 lb (80 kg).[137]
Some of the largest world reserves of lithium and other rare metals are located in countries with strong resource nationalism, unstable governments or hostility to U.S. interests, raising concerns about the risk of replacing dependence on foreign oil with a new dependence on hostile countries to supply strategic materials.[133][134][138][139]
- Lithium

The main deposits of lithium are found in China and throughout the Andes mountain chain in South America. In 2008 Chile was the leading lithium metal producer with almost 30%, followed by China, Argentina, and Australia.[134][141] In the United States lithium is recovered from brine pools in Nevada.[142][143]
Nearly half the world's known reserves are located in Bolivia,[134][138] and according to the US Geological Survey, Bolivia's Salar de Uyuni desert has 5.4 million tons of lithium.[138][142] Other important reserves are located in Chile, China, and Brazil.[134][142] Since 2006 the Bolivian government have nationalized oil and gas projects and is keeping a tight control over mining its lithium reserves. Already the Japanese and South Korean governments, as well as companies from these two countries and France, have offered technical assistance to develop Bolivia's lithium reserves and are seeking to gain access to the lithium resources through a mining and industrialization model suitable to Bolivian interests.[138][144][145]
According to a 2011 study conducted at Lawrence Berkeley National Laboratory and the University of California Berkeley, the currently estimated reserve base of lithium should not be a limiting factor for large-scale battery production for electric vehicles, as the study estimated that on the order of 1 billion 40 kWh Li-based batteries (about 10 kg of lithium per car)[146] could be built with current reserves, as estimated by the U.S. Geological Survey.[147] Another 2011 study by researchers from the University of Michigan and Ford Motor Company found that there are sufficient lithium resources to support global demand until 2100, including the lithium required for the potential widespread use of hybrid electric, plug-in hybrid electric and battery electric vehicles. The study estimated global lithium reserves at 39 million tons, and total demand for lithium during the 90-year period analyzed at 12–20 million tons, depending on the scenarios regarding economic growth and recycling rates.[148]
A 2016 study by Bloomberg New Energy Finance (BNEF) found that the availability of lithium and other finite materials used in the battery packs will not be a limiting factor for the adoption of electric vehicles. BNEF estimated that battery packs will require less than 1% of the known reserves of lithium, nickel, manganese, and copper through 2030, and 4% of the world's cobalt. After 2030, the study states that new battery chemistries will probably shift to other source materials, making packs lighter, smaller, and cheaper.[71]
- Rare-earth elements
China has 48% of the world's reserves of rare-earth elements, the United States has 13%, and Russia, Australia, and Canada have significant deposits. Until the 1980s, the U.S. led the world in rare-earth production, but since the mid-1990s China has controlled the world market for these elements. The mines in Bayan Obo near Baotou, Inner Mongolia, are currently the largest source of rare-earth metals and are 80% of China's production. In 2010 China accounted for 97% of the global production of 17 rare-earth elements.[135] Since 2006 the Chinese government has been imposing export quotas reducing supply at a rate of 5% to 10% a year.[139][149][150]
Prices of several rare-earth elements increased sharply by mid-2010 as China imposed a 40% export reduction, citing environmental concerns as the reason for the export restrictions. These quotas have been interpreted as an attempt to control the supply of rare earths. However, the high prices have provided an incentive to begin or reactivate several rare-earth mining projects around the world, including the United States, Australia, Vietnam, and Kazakhstan.[149][150][151][152]

In September 2010, China temporarily blocked all exports of rare earths to Japan in the midst of a diplomatic dispute between the two countries. These minerals are used in hybrid cars and other products such as wind turbines and guided missiles, thereby augmenting the worries about the dependence on Chinese rare-earth elements and the need for geographic diversity of supply.[150][153] A December 2010 report published by the US DoE found that the American economy vulnerable to rare-earth shortages and estimates that it could take 15 years to overcome dependence on Chinese supplies.[154][155] China raised export taxes for some rare earths from 15 to 25%, and also extended taxes to exports of some rare-earth alloys that were not taxed before. The Chinese government also announced further reductions on its export quotas for the first months of 2011, which represent a 35% reduction in tonnage as compared to exports during the first half of 2010.[156]
On September 29, 2010, the U.S. House of Representatives approved the Rare Earths and Critical Materials Revitalization Act of 2010 (H.R.6160).[157][158] The approved legislation is aimed at restoring the U.S. as a leading producer of rare-earth elements, and would support activities in the U.S. Department of Energy (US DoE) to discover and develop rare-earth sites inside of the U.S. in an effort to reduce the auto industry's near-complete dependence on China for the minerals.[158][159] A similar bill, the Rare Earths Supply Technology and Resources Transformation Act of 2010 (S. 3521), is being discussed in the U.S. Senate.[158][160]
In order to avoid its dependence on rare-earth minerals, Toyota Motor Corporation announced in January 2011 that it is developing an alternative motor for future hybrid and electric cars that do not need rare-earth materials. Toyota engineers in Japan and the U.S. are developing an induction motor that is lighter and more efficient than the magnet-type motor used in the Prius, which uses two rare earths in its motor magnets. Other popular hybrids and plug-in electric cars in the market that use these rare-earth elements are the Nissan Leaf, the Chevrolet Volt and Honda Insight. For its second generation RAV4 EV due in 2012, Toyota is using an induction motor supplied by Tesla Motors that does not require rare-earth materials. The Tesla Roadster and the Tesla Model S use a similar motor.[136]
Car dealers reluctance to sell
With the exception of Tesla Motors, almost all new cars in the United States are sold through dealerships, so they play a crucial role in the sales of electric vehicles, and negative attitudes can hinder early adoption of plug-in electric vehicles.[161][162] Dealers decide which cars they want to stock, and a salesperson can have a big impact on how someone feels about a prospective purchase. Sales people have ample knowledge of internal combustion cars while they do not have time to learn about a technology that represents a fraction of overall sales.[161] As with any new technology, and in the particular case of advanced technology vehicles, retailers are central to ensuring that buyers, especially those switching to a new technology, have the information and support they need to gain the full benefits of adopting this new technology.[162]
There are several reasons for the reluctance of some dealers to sell plug-in electric vehicles. PEVs do not offer car dealers the same profits as a gasoline-powered cars. Plug-in electric vehicles take more time to sell because of the explaining required, which hurts overall sales and sales people commissions. Electric vehicles also may require less maintenance, resulting in loss of service revenue, and thus undermining the biggest source of dealer profits, their service departments. According to the National Automobile Dealers Association (NADS), dealers on average make three times as much profit from service as they do from new car sales. However, a NADS spokesman said there was not sufficient data to prove that electric cars would require less maintenance.[161] According to the New York Times, BMW and Nissan are among the companies whose dealers tend to be more enthusiastic and informed, but as of 2015, only about 10% of dealers were knowledgeable about the new technology.[161]
A study conducted at the Institute of Transportation Studies (ITS), at the University of California, Davis (UC Davis) published in 2014 found that many car dealers are less than enthusiastic about plug-in vehicles. ITS conducted 43 interviews with six automakers and 20 new car dealers selling plug-in vehicles in California's major metro markets. The study also analyzed national and state-level J.D. Power 2013 Sales Satisfaction Index (SSI) study data on customer satisfaction with new car dealerships and Tesla retail stores. The researchers found that buyers of plug-in electric vehicles were significantly less satisfied and rated the dealer purchase experience much lower than buyers of non-premium conventional cars, while Tesla Motors earned industry-high scores. According to the findings, plug-in buyers expect more from dealers than conventional buyers, including product knowledge and support that extends beyond traditional offerings.[162][163]
In 2014 Consumer Reports published results from a survey conducted with 19 secret shoppers that went to 85 dealerships in four states, making anonymous visits between December 2013 and March 2014. The secret shoppers asked a number of specific questions about cars to test the salespeople's knowledge about electric cars. The consumer magazine decided to conduct the survey after several consumers who wanted to buy a plug-in car reported to the organization that some dealerships were steering them toward gasoline-powered models. The survey found that not all sales people seemed enthusiastic about making PEV sales; a few outright discouraged it, and even one dealer was reluctant to even show a plug-in model despite having one in stock. And many sales people seemed not to have a good understanding of electric-car tax breaks and other incentives or of charging needs and costs. Consumer Reports also found that when it came to answering basic questions, sales people at Chevrolet, Ford, and Nissan dealerships tended to be better informed than those at Honda and Toyota. The survey found that most of the Toyota dealerships visited recommended against buying a Prius Plug-in and suggested buying a standard Prius hybrid instead. Overall, the secret shoppers reported that only 13 dealers “discouraged the sale of EV,” with seven of them being in New York. However, at 35 of the 85 dealerships visited, the secret shoppers said sales people recommended buying a gasoline-powered car instead.[164]
The ITS-Davis study also found that a small but influential minority of dealers have introduced new approaches to better meet the needs of plug-in customers. Examples include marketing carpool lane stickers, enrolling buyers in charging networks and preparing incentive paperwork for customers. Some dealers assign seasoned sales people as plug-in experts, many of whom drive plug-ins themselves to learn and be familiar with the technology and relate the car's benefits to potential buyers. The study concluded also that carmakers could do much more to support dealers selling PEVs.[162]
Government incentives and policies
Several national, provincial, and local governments around the world have introduced policies to support the mass market adoption of plug-in electric vehicles. A variety of policies have been established to provide direct financial support to consumers and manufacturers; non-monetary incentives; subsidies for the deployment of charging infrastructure; procurement of electric vehicle for government fleets; and long term regulations with specific targets.[11][165]

Financial incentives for consumers aim to make plug-in electric car purchase price competitive with conventional cars due to the still higher up front cost of electric vehicles. Among the financial incentives there are one-time purchase incentives such as tax credits, purchase grants, exemptions from import duties, and other fiscal incentives; exemptions from road, bridge and tunnel tolls, and from congestion pricing fees; and exemption of registration and annual use vehicle fees. Some countries, like France, also introduced a bonus-malus CO
2 based tax system that penalize fossil-fuel vehicle sales.[11][165][166]
As of 2020, monetary incentives for electrically chargeable vehicles are available, among others, in several European Union member states, China, the United States, the UK, Japan, Norway, some provinces in Canada, South Korea, India, Israel, Colombia, and Costa Rica.[11][167][168]
| Selected countries | Year |
|---|---|
| Norway (100% ZEV sales) | 2025 |
| Denmark | 2030 |
| Iceland | |
| Ireland | |
| Netherlands (100% ZEV sales) | |
| Sweden | |
| United Kingdom | 2040 |
| France | |
| Canada (100% ZEV sales) | |
| Singapore | |
| Sri Lanka (100% HEV or PEV stock) | |
| Germany (100% ZEV sales) | 2050 |
| U.S. (only 10 ZEV states) | |
| Japan (100% HEV/PHEV/ZEV sales) | |
| Costa Rica (100% ZEV sales) |
Among the non-monetary incentives there are several perks such allowing plug-in vehicles access to bus lanes and high-occupancy vehicle lanes, free parking and free charging.[165] In addition, in some countries or cities that restrict private car ownership (purchase quota system for new vehicles), or have implemented permanent driving restrictions (no-drive days), the schemes often exclude electric vehicles from the restrictions to promote their adoption.[166][170][167][171]
For example in Beijing, the license plate lottery scheme specifies a fixed number of vehicle purchase permits each year, but to promote the electrification of its fleet, the city government split the number of purchase permits into two lots, one for conventional vehicles, and another dedicated for all-electric vehicle applicants.[166] In the case of cities with driving alternate-days based on the license plate number, such as San José, Costa Rica, since 2012, São Paulo and Bogotá since 2014, and Mexico City since 2015, all-electric vehicles were excluded from the driving restrictions.[167][171][172][173]
Some government have also established long term regulatory signals with specific target timeframes such as ZEV mandates, national or regional CO
2 emissions regulations, stringent fuel economy standards, and the phase out of internal combustion engine vehicle sales.[11][165] For example, Norway set a national goal that all new car sales by 2025 should be zero emission vehicles (electric or hydrogen).[174][175]

Also, some cities are planning to establish zero-emission zones (ZEZ) restricting traffic access into an urban cordon area or city center where only zero-emission vehicles (ZEVs) are allowed access. In such areas, all internal combustion engine vehicles are banned.[176][177]
As of June 2020, Oxford is slated to be the first city to implement a ZEZ scheme, beginning with a small area scheduled to go into effect by mid 2021. The plan is to expand the clean air zone gradually into a much larger zone, until the ZEZ encompasses the majority of the city center by 2035.[178][179]
As of May 2020, other cities planning to gradually introduce ZEZ, or partial or total ban fossil fuel powered vehicles include, among others, Amsterdam (2030),[180] Athens (2025),[181] Barcelona (2030),[181] Brussels (2030/2035),[176] Copenhagen (2030),[181] London (2020/2025),[176] Los Angeles (2030),[181] Madrid (2025),[182] Mexico City (2025),[182] Milan (2030),[181] Oslo (2024/2030),[176] Paris (2024/2030),[176] Quito (2030),[181] Rio de Janeiro (2030),[181] Rome (2024/2030),[176] [183] Seattle (2030),[181] and Vancouver (2030).[181]
Production plug-in electric vehicles available
_cropped.jpg)
During the 1990s several highway-capable plug-in electric cars were produced in limited quantities, all were battery electric vehicles. PSA Peugeot Citroën launched several electric "Électrique" versions of its models starting in 1991. Other models were available through leasing mainly in California. Popular models included the General Motors EV1 and the Toyota RAV4 EV. Some of the latter were sold to the public and were still in use by the early 2010s.[184]
In the late 2000s began a new wave of mass production plug-in electric cars, motorcycles and light trucks. However, as of 2011, most electric vehicles in the world roads were low-speed, low-range neighborhood electric vehicles (NEVs) or electric quadricycles.[185] Sales of low-speed electric vehicles experienced considerable growth in China between 2012 and 2016, with an estimated NEV stock between 3 million to 4 million units, with most powered by lead-acid batteries.[186]
As of December 2019, according to the International Energy Agency, there were about 250 models of highway-capable plug-in electric passenger cars available for sale in the world, up from 70 in 2014.[11] There are also available several commercial models of electric light commercial vehicles, plug-in motorcycles, all-electric buses, and plug-in heavy-duty trucks.
The Renault–Nissan–Mitsubishi Alliance is the world's leading light-duty electric vehicle manufacturer. Since 2010, the Alliance's global all-electric vehicle sales totaled almost 725,000 units, including those manufactured by Mitsubishi Motors through December 2018, now part of the Alliance.[188] Its best selling all-electric Nissan Leaf was the world's top selling plug-in electric car in 2013 and 2014.[189] Tesla is the world's second largest plug-in electric passenger car manufacturer with global sales since 2012 of over 532,000 units as of December 2018.[190] Its Model S was the world's top selling plug-in car in 2015 and 2016,[189][191] and its Model 3 was the world's best selling plug-in electric car in 2018.[187]
Ranking next is BYD Auto with more than 529,000 plug-in passenger cars delivered in China through December 2018.[192][193][194][195] Its Qin plug-in hybrid is the company's top selling model with almost 137,000 units sold in China through December 2018.[189][196][195] As of December 2018, the BMW Group had sold more than 356,000 plug-in cars since inception of the BMW i3, accounting for global sales its BMW i cars, BMW iPerformance plug-in hybrid models, and MINI brand plug-ins.[197]
BYD Auto ended 2015 as the world's best selling manufacturer of highway legal light-duty plug-in electric vehicles, with 61,722 units sold, followed by Tesla, with 50,580 units.[198][199][200] BYD was again the world's top selling plug-in car manufacturer in 2016, with 101,183 units delivered, one more time followed again by Tesla with 76,243 units.[192][201] In 2017 BYD ranked for the third consecutive year as the global top plug-in car manufacturer with 113,669 units delivered. BAIC ranked second with 104,520 units.[194][196] The BAIC EC-Series all-electric city car ranked as the world's top selling plug-in car in 2017 with 78,079 units sold in China.[202]
After 10 years in the market, Tesla was the world's top selling plug-in passenger car manufacturer in 2018, both as a brand and by automotive group, with 245,240 units delivered and a market share of 12% of all plug-in cars sold globally in 2018.[187][203] BYD Auto ranked second with 227,152 plug-in passenger cars sold worldwide, representing a market share of 11%.[205]
Sales and main markets

The global stock of plug-in electric vehicles between 2005 and 2009 consisted exclusively of all-electric cars, totaling about 1,700 units in 2005, and almost 6,000 in 2009. The plug-in stock rose to about 12,500 units in 2010, of which, only 350 vehicles were plug-in hybrids.[207][208] By comparison, during the Golden Age of the electric car at the beginning of the 20th century, the EV stock peaked at approximately 30,000 vehicles.[206]
After the introduction of the first mass-production plug-in cars by major carmakers in late 2010, plug-in car global sales went from about 50,000 units in 2011, to 125,000 in 2012, almost 213,000 in 2013, and over 315,000 units in 2014.[209] By mid-September 2015, the global stock of highway legal plug-in electric passenger cars and utility vans reached the one million sales milestone,[4][210] almost twice as fast as hybrid electric vehicles (HEV).[4][210]
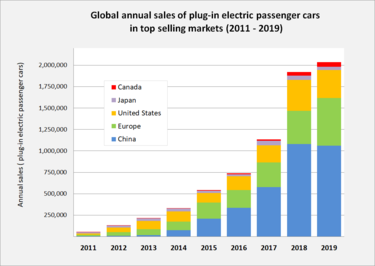
Light-duty plug-in electric vehicle sales in 2015 increased to more than 565,000 units in 2015, about 80% from 2014, driven mainly by China and Europe.[209] Both markets passed in 2015 the U.S. as the largest plug-in electric car markets in terms of total annual sales, with China ranking as the world's best-selling plug-in electric passenger car country market in 2015.[216][217] About 775,000 plug-in cars and vans were sold in 2016, and cumulative global sales passed the 2 million milestone by the end of 2016.[192] The global market share of the light-duty plug-in vehicle segment achieved a record 0.86% of total new car sales in 2016, up from 0.62% in 2015 and 0.38% in 2014.[218]
Cumulative global light-duty plug-in vehicle sales passed the 3 million milestone in November 2017.[219] About 1.2 million plug-ins cars and vans were sold worldwide in 2017, with China accounting for about half of global sales. The plug-in car segment achieved a 1.3% market share.[202][220] Plug-in passenger car sales totaled just over 2 million in 2018, with a market share of 2.1%.[187] The global stock reached 5.3 million light-duty plug-in vehicles in December 2018.[5][211] Despite the rapid growth experienced, the plug-in electric car segment represented just about 1 out of every 250 vehicles on the world's roads by the end of 2018.[7]
By the end of 2019 the stock of light-duty plug-in vehicles totaled 7.55 million units, consisting of 4.79 million all-electric cars, 2.38 million plug-in hybrid cars, and 377,970 electric light commercial vehicles. Plug-in passenger cars still represented less than 1% of the world's car fleet in use.[11] In addition, there were about half a million electric buses in circulation in 2019, most of them in China.[11]
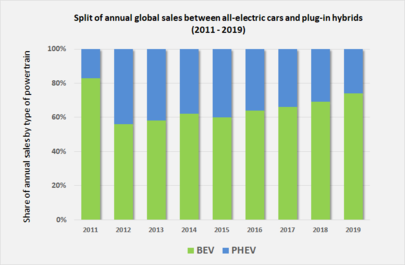
All-electric cars have outsold plug-in hybrids for several years, and by the end of 2019, the shift towards battery electric cars continued. The global ratio between all-electrics (BEVs) and plug-in hybrids (PHEVs) went from 56:44 in 2012, to 60:40 in 2015, increased to 66:34 in 2017, and rose to 69:31 in 2018, and reached 74:26 in 2019.[187][221][222] Out of the 7.2 million plug-in passenger cars in use at the end of 2019, two thirds were all-electric cars (4.8 million).[11]
Since 2016, China has the world's largest fleet of light-duty plug-in electric vehicles, after having overtaken during 2016 both the U.S. and Europe in terms of cumulative sales.[192][223][224] The fleet of Chinese plug-in passenger cars represented 46.7% of the global stock of plug-in cars at the end of 2019. Europe listed next with 24.8%, followed by the U.S. with 20.2% of the global stock in use.[11]
As of December 2017, 25 cities accounted for 44% of the world's stock of plug-in electric cars, while representing just 12% of world passenger vehicle sales. Shanghai led the world with cumulative sales of over 162,000 electric vehicles since 2011, followed by Beijing with 147,000 and Los Angeles with 143,000. Among these cities, Bergen has the highest market share of the plug-in segment, with about 50% of new car sales in 2017, followed by Oslo with 40%.[225]
| Top 5 countries, autonomous territories or regional markets by plug-in electric passenger car market share of total new car sales between 2014 and 2018 | ||||||||||
|---|---|---|---|---|---|---|---|---|---|---|
| Rank | Country or territory /region |
Market share (%) 2018 |
Country or territory /region |
Market share (%) 2017 |
Country or territory /region |
Market share (%) 2016 |
Country or territory /region |
Market share (%) 2015 |
Country or territory /region |
Market share (%) 2014 |
| 1 | 49.1[226] | 39.2[227] | 29.1[228] | 22.4[216] | 13.8[229] | |||||
| 2 | 19[230] | 14[231] | 6.4[228] | 9.7[216] | 3.87[229] | |||||
| 3 | 8.2[232] | 5.2[233] | ~5[234] | 4.84[235] | 3.2[236] | |||||
| 4 | 7.1(1)[237] | 4.8[236] | 4.6[234] | 3.1[236] | 2.71 | |||||
| 5 | 6.5[239] | 2.6[239] | 3.6[236] | 2.93[240] | 1.57 | |||||
| Notes (1) Market share for the first nine months of 2018. | ||||||||||
China
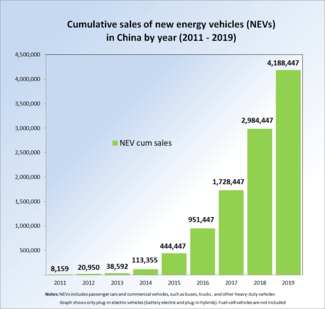
As of December 2019, China had the world's largest stock of highway legal plug-in passenger cars with 3.35 million units, corresponding to 47% of the global plug-in car fleet in use.[11] Domestically produced cars account for about 96% of new energy car sales in China[202][245] A particular feature of the Chinese passenger plug-in market is the dominance of small entry level vehicles.[246]
China also dominates the plug-in light commercial vehicle and electric bus deployment, with its stock reaching over 500,000 buses in 2019, 98% of the global stock, and 247,500 electric light commercial vehicles, 65% of the global fleet. In addition, the country also leads sales of medium- and heavy duty electric trucks, with over 12,000 trucks sold, and nearly all battery electric.[11] Since 2011, combined sales of all classes of new energy vehicles (NEV) totaled almost 4.2 million at the end of 2019.[223][241][242][243][244]
The BAIC EC-Series all-electric city car was Chinese the top selling plug-in car in 2017 with 78,079 units sold in China, making also the city car the world's top selling plug-in car in 2017. BYD Auto was the world's top selling car manufacturer in 2016 and 2017.[194][196][202][247] For the second year running, the BAIC EC-Series was the best selling plug-in car China with 90,637 units delivered.[248]
United States
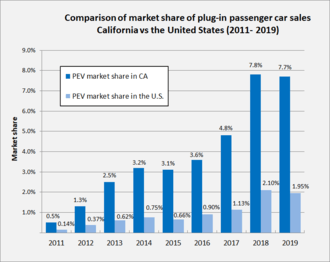
Cumulative sales of highway legal plug-in electric passenger cars in the U.S. since 2010 totaled 1.45 million at the end of 2019.[249][250] Since December 2016 the U.S. has the world's third largest stock of plug-in passenger cars, after having being overtook by Europe in 2015 and China during 2016.[223][224] California is the country's largest plug-in car regional market with a stock of 668,827 units through December 2019.[251][252][253]
Nationwide sales of plug-in electric car sales totaled 157,181 units in 2016,[254] rose to 199,818 in 2017, and achieved a record of 361,307 units in 2018.[255] Sales declined to 329,528 units in 2019.[250] The market share of plug-in electric passenger cars increased from 0.14% of new car sales in 2011 to 0.75% in 2014.[256][257] The segment's market share fell to 0.66% in 2015, then increased to 0.90% in 2016,[256][254] reached 1.13% in 2017,[258] and achieved 2.1% in 2018.[259]
The Tesla Model 3 electric car has been the best selling plug-in car in the U.S. for two consecutive years, 2018 and 2019.[249][250] Cumulative sales of the Model 3 surpassed in 2019 the discontinued Chevrolet Volt plug-in hybrid to become the all-time best selling plug-in car in the country, with an estimated 300,471 units delivered since inception, followed by the Tesla Model S all-electric car with about 157,992, and the Chevrolet Volt with 157,054.[260]
Japan
_front.JPG)
As of December 2019, Japan had a stock of plug-in passenger cars of 294,000 units on the road, consisting of 152,320 all-electric cars (51.8%) and 141,680 plug-in hybrids (48.2%).[11] The fleet of electric light commercial vehicles in use totaled 8,720 units in 2019.[11]
Plug-in sales totaled 24,660 units in 2015 and 24,851 units in 2016.[11] The rate of growth of the Japanese plug-in segment slowed down from 2013, with annual sales falling behind Europe, the U.S. and China during 2014 and 2015.[216][262] The segment market share fell from 0.68% in 2014 to 0.59% in 2016.[186] Sales recovered in 2017, with almost 56,000 plug-in cars sold, and the segment's market share reached 1.1%.[263] Sales fell slightly in 2018 to 52,000 units with a market share of 1.0%.[264]
The decline in plug-in car sales reflects the Japanese government and the major domestic carmakers decision to adopt and promote hydrogen fuel cell vehicles instead of plug-in electric vehicles.[265][266]
Europe

Europe had more than two million plug-in electric passenger cars and light commercial vehicles on the road at the end of April 2020.[267] The European stock of plug-in passenger is the world's second largest market after China, accounting for 25% of the global stock in 2019.[11] Europe also has the second largest electric light commercial vehicle stock, with over 115,000 units, 31% of the global stock in 2019.[11]
Since 2016 the plug-in passenger car segment has experienced rapid growth, its market share rose from 1.3% of new car registrations in 2016 to 3.6% in 2019.[268][269]
As of December 2019, European sales of plug-in cars and vans are led by Norway with 384,000 cumulative registrations.[12] The other leading markets are Germany, UK, France, and the Netherlands.[11] Norway was the top selling plug-in country market in Europe between 2016 and 2018.[228][270] Germany surpassed Norway in 2019 as the best selling plug-in market, leading both the all-electric and the plug-in hybrid segments in Europe.[269]
Norway
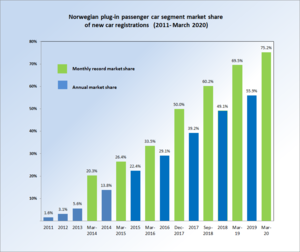
As of December 2019, a total of 384,066 light-duty plug-in electric vehicles have been registered in Norway since 1999.[271] As of December 2019, Norway ranked as the European country with the largest stock of plug-in cars in use, and the third largest in the world.[11] The Norwegian light-duty plug-in fleet consists of 268,024 all-electric passenger cars and vans, and 116,042 plug-in hybrids, including both new and used imports registrations.[271]
The Norwegian plug-in car segment market share has been the highest in the world for several years, reaching 39.2% in 2017, up from 29.1% in 2016,[227][272] 49.1% in 2018,[226] and rose to 55.9% in 2019.[273] The plug-in car market penetration reached 1% in March 2014,[274] passed 5% in December 2016,[228] and achieved 10% of the country's registered passenger car fleet in October 2018.[13]
The Norwegian fleet of plug-in electric cars is one of the cleanest in the world because 98% of the electricity generated in the country comes from hydropower.[275][276] Norway is the country with the largest EV ownership per capita in the world.[277][278][279]
Germany
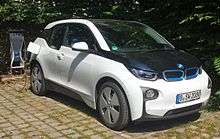
As of December 2019, a total of 305,787 plug-in electric passenger cars have been registered since 2010, consisting of 168,396 all-electric cars and 137,391 plug-in hybrids.[228][282][283][284] In addition, Germany had a stock of 21,890 light-duty electric commercial vehicles in 2019, the second largest in Europe after France.[11]
A total of 54,492 plug-in cars were registered in 2017, up 217% the previous year,[282] and climbed to 67,504 in 2018.[283] Registrations rose to 108,839 plug-in passenger cars in 2019,[284] making Germany the top selling plug-in country market in the European continent in 2019, with sales up 60.9% from 2018.[215]
The plug-in car segment market share was 1.58% in 2017, 1.9% in 2018, and achieved 3.10% in 2019.[282][283]
United Kingdom
About 298,000 light-duty plug-in electric vehicles had been registered in the UK up until April 2020, including about 8,800 plug-in commercial vans.[285] A surge of plug-in car sales took place in Britain beginning in 2014. Total registrations went from 3,586 in 2013, to 37,092 in 2016, and rose to 59,911 in 2018.[286][287][288] The market share of the plug-in segment went from 0.16% in 2013 to 0.59% in 2014, and achieved 2.6% in 2018.[286][289][288]
As of September 2018, the Mitsubishi Outlander P-HEV is the all-time top selling plug-in car in the UK almost 37,000 units registered, followed by the Nissan Leaf nearly 24,000 units. Ranking third is the BMW 330e with more than 13,000 units, followed by the BMW i3 with 11,000 units.[285][285]
France
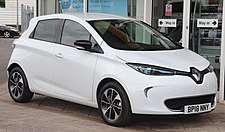
As of June 2020, a total of 344,725 light-duty plug-in electric vehicles have been registered in France since 2010. Cumulative registrations of light-duty plug-in electric vehicles consisted of 267,120 all-electric cars and vans, and 77,605 plug-in hybrids.[291] Of these, over 50,000 were all-electric light commercial vehicles.[11][291]
The market share of all-electric passenger cars increased from 0.30% of new car registered in 2012, to 0.59% in 2014.[292][293] After the introduction of the super-bonus for the scrappage of old diesel-power cars in 2015, sales of both pure electric cars and plug-in hybrids surged, rising the market share to 1.17% in 2015,[294][216] climbed to 2.11% in 2018, and achieved a record market share of 2.8% in 2019.[11][295] Despite the global strong decline in car sales brought by the COVID-19 pandemic, plug-in electric car sales in France during the first six months of 2020 achieved a record sales volume of 65,267 units, and a market share of 9.1%.[291][296]
As of December 2019, France is the country with the world's second largest stock of light-duty electric commercial vehicles after China, with 49,340 utility vans in use.[11] The market share of all-electric utility vans reached a market share of 1.22% in 2014, and 1.77% in 2018.[295][297]
Netherlands
As of 31 March 2020, there were 218,501 highway-legal light-duty plug-in electric vehicles registered in the Netherlands, consisting of 116,148 pure electric cars, 97,553 plug-in hybrids, and 4,800 all-electric light utility vans. When buses (866), trucks (140), motorcycles (812), quadricycles and tricycles (1,446) are accounted for, the Dutch plug-in fleet in use climbs to 221,765 units.[298]
As of July 2016, the Netherlands had the second largest plug-in ownership per capita in the world after Norway.[299] Plug-in sales fell sharply in 2016 due to changes in tax rules, and as a result of the change in government's incentives, the plug-in market share declined from 9.9% in 2015, to 6.7% in 2016, and fell to 2.6% in 2017.[239][300] The intake rate rose to 6.5% in 2018 in anticipation of another change in tax rules that went into effect in January 2019,[239] and increased a record of 15.1% in 2019.[11]
Top selling PEV models
All-electric cars and vans
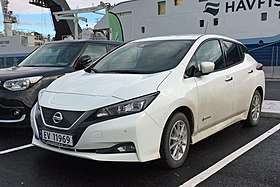
The Tesla Model 3 surpassed the Nissan Leaf in early 2020 to become the world's all-time best selling electric car, with more than 500,000 sold by March 2020.[8] The Model 3 ended 2019 as the world's best selling plug-in electric car for the second consecutive year, with just over 300,000 units delivered.[187][221] The United States is the leading market with an estimated 300,471 units delivered up to December 2019,[260] followed by the European market with over 95,000 units delivered in its first year in that market.[301]
Global sales of the Nissan Leaf totaled more than 470,000 units by May 2020.[9] Europe is the world's largest Leaf market with 150,000 units sold by December 2019, followed by the United States with 141,907 units sold up to December 2019, and Japan almost 140,000 units through March 2020.[260][302][303] The European market is led by Norway with over 61,000 units registered by May 2020.[304][305]
Ranking third is the all-electric Tesla Model S with global deliveries of 263,504 units as of December 2018.[306][307][308][309][310] The United States as its leading market with about 157,992 units units delivered through 2019.[260]
The world's all-time top selling all-electric light utility vehicle is the Renault Kangoo Z.E., with global sales of 50,500 units through March 2020.[311][312][313]
The following table presents global sales of the top selling highway-capable electric cars and light utility vehicles produced since the introduction of the first modern production all-electric car, the Tesla Roadster, in 2008 and March 2020. The table includes all-electric passenger cars and utility vans with cumulative sales of about or over 150,000 units.
| Top selling highway legal electric cars and light utility vehicles produced between 2008 and March 2020(1) | ||||
|---|---|---|---|---|
| Model | Market launch | Global sales | Cumulative sales through | Source |
| Tesla Model 3 | Jul 2017 | ~525,000 | Mar 2020 | [314][310][315][316][317] |
| Nissan Leaf | Dec 2010 | 450,000 | Dec 2019 | [318] |
| Tesla Model S | Jun 2012 | ~291,000(2) | Dec 2019 | [221][306][307][308][309][310] |
| Renault Zoe | Dec 2012 | 203,000 | Mar 2020 | [311][313] |
| BAIC EC-Series | Dec 2016 | 200,200(3) | Dec 2019 | [319][320] |
| BAIC EU-Series | 2016 | 180,400(3) | Dec 2019 | [319] |
| BMW i3 | Nov 2013 | 165,000(4) | Jan 2019 | [321] |
| Tesla Model X | Sep 2015 | ~160,000(2) | Dec 2019 | [221][307][308][309][189][310][322][323][324][325] |
| Notes: (1) Vehicles are considered highway-capable if able to achieve at least a top speed of 100 km/h (62 mph). (2) Tesla began reporting combined sales of the Model S and X since 1Q 2019. Sales for each model in 2019 are estimates from the source provided (EV Sales) which tracks monthly sales by country. The estimated combined total for Model S/X (67,000)[221] adds up close enough to Tesla's combined reported deliveries for 2019 (66,771).[314] (3) Sales in main China only.(4) BMW i3 sales includes the REx variant (split is not available). | ||||
Plug-in hybrids

The Mitsubishi Outlander P-HEV is the world's all-time best selling plug-in hybrid according to JATO Dynamics.[326] Global sales achieved the 250,000 unit milestone in May 2020.[10] Europe is the Outlander P-HEV leading market with 126,617 units sold through January 2019,[327] followed by Japan with 42,451 units through March 2018.[328] European sales are led by the UK with 36,237 units delivered, followed by the Netherlands with 25,489 units, both through March 2018.[328]
Ranking second is the Toyota Prius Plug-in Hybrid (Toyota Prius Prime) with about 209,000 units sold worldwide of both generations through December 2019.[319][329] The United States is the market leader with over 93,000 units delivered through December 2018.[330] Japan ranks next with about 61,200 units through December 2018,[264][329] followed by Europe with almost 14,800 units through June 2018.[329][331]
Combined global sales of the Chevrolet Volt and its rebadged models totaled about 186,000 units by the end of 2018,[330][332][333][334][335] including about 10,000 Opel/Vauxhall Amperas sold in Europe through June 2016.[336] Volt sales are led by the United States with 157,054 units delivered through December 2019,[260] followed by Canada with 17,311 units through November 2018.[333][334] Until the end of 2018, the Chevrolet Volt family listed as the world's top selling plug-in hybrid, when it was surpassed by the Mitsubishi Outlander P-HEV.[326]
The following table presents plug-in hybrid models with cumulative global sales of around or more than 100,000 units since the introduction of the first modern production plug-in hybrid car, the BYD F3DM, in 2008 up until December 2019:
| Top selling highway legal plug-in hybrid electric cars between 2008 and May 2020 | ||||
|---|---|---|---|---|
| Model | Market launch | Global sales | Cumulative sales through | Source |
| Mitsubishi Outlander P-HEV | Jan 2013 | 250,000 | May 2020 | [10] |
| Toyota Prius PHV | Jan 2012 | 209,000 | Dec 2019 | [319] |
| Chevrolet Volt(1) | Dec 2010 | ~186,000 | Dec 2018 | [330][332][333][335] |
| BYD Qin(2) | Dec 2013 | 136,818 | Dec 2018 | [189][195][337] |
| BYD Tang(2) | Jun 2015 | 101,518 | Dec 2018 | [195][337][338][339] |
| Notes: (1) In addition to the Volt sold in North America, combined sales of the Volt/Ampera family includes about 10,000 Vauxhall/Opel Ampera and about 1,750 Volts sold in Europe,[340][341] 246 Holden Volt sold in Australia,[342] and 4,317 units of the Buick Velite 5 sold only in China (rebadged second generation Volt).[335] (2) Sales in China only. BYD Qin total does not include sales of the all-electric variant (Qin EV300). | ||||
See also
- All-electric vehicle (EV) or battery electric vehicle (BEV)
- Electric car
- Electric car use by country
- Electric vehicle battery
- Electric vehicle warning sounds
- Hybrid tax credit (U.S.)
- List of electric cars currently available
- List of modern production plug-in electric vehicles
- Neighborhood electric car
- New energy vehicles in China
- Plug In America
- Plug-in hybrid vehicle, (PHEV)
- RechargeIT (Google.org PHEV program)
- Renewable energy by country
References
- David B. Sandalow, ed. (2009). Plug-In Electric Vehicles: What Role for Washington? (1st. ed.). The Brookings Institution. pp. 2–5. ISBN 978-0-8157-0305-1. See definition on pp. 2.
- "Plug-in Electric Vehicles (PEVs)". Center for Sustainable Energy, California. Archived from the original on 2010-06-20. Retrieved 2010-03-31.
- "PEV Frequently Asked Questions". Duke Energy. Archived from the original on 2012-03-27. Retrieved 2010-12-24.
- Jeff Cobb (2015-09-16). "One Million Global Plug-In Sales Milestone Reached". HybridCars.com. Retrieved 2015-09-16. Cumulative global sales totaled about 1,004,000 highway legal plug-in electric passenger cars and light-duty vehicles by mid-September 2015.
- Watson, Frank (2019-02-11). "December global electric vehicle sales set new record: S&P Global Platts data". S&P Global Platts. London. Retrieved 2019-02-11.
At the end of 2018, some 5.3 million plug-in EVs were on the road
A total of 1.45 million light-duty pure electric vehicles were sold in 2018. - Irle, Roland (2020-02-03). "Global BEV & PHEV Sales for 2019". EV-volumes.com. Retrieved 2020-05-10. At the end of 2019 the global fleet of plug-ins was 7,5 million, counting light vehicles. Medium and heavy commercial vehicles add another 700 000 units to the global stock of plug-ins.
- Coren, Michael J. (2019-01-25). "E-nough? Automakers may have completely overestimated how many people want electric cars". Quartz. Retrieved 2019-01-25.
Despite exponential growth, with a record 2 million or so EVs sold worldwide last year, only one in 250 cars on the road is electric.
- Holland, Maximilian (2020-02-10). "Tesla Passes 1 Million EV Milestone & Model 3 Becomes All Time Best Seller". CleanTechnica. Archived from the original on April 12, 2020. Retrieved 2020-05-15.
- Kane, Mark (2020-05-08). "Nissan Electric Car Sales May Already Exceed 500,000". InsideEVs.com. Retrieved 2020-05-19. More than 470,000 Leaf cars have been sold globally by May 2020.
- Esther de Aragón (2020-06-11). "El Mitsubishi Outlander PHEV consigue llegar a la cifra récord de ventas de 250.000 unidades" [Mitsubishi Outlander PHEV achieves record sales of 250,000 units]. Automotive News Europe (in Spanish). movilidadeléctrica.com. Retrieved 2020-06-16.
- International Energy Agency (IEA), Clean Energy Ministerial, and Electric Vehicles Initiative (EVI) (June 2020). "Global EV Outlook 2020: Enterign the decade of electric drive?". IEA Publications. Retrieved 2020-06-15.CS1 maint: multiple names: authors list (link) See Statistical annex, pp. 247–252 (See Tables A.1 and A.12). The global stock of plug-in electric passenger vehicles totaled 7.2 million cars at the end of 2019, of which, 47% were on the road in China. The stock of plug-in cars consist of 4.8 million battery electric cars (66.6%) and 2.4 million plug-in hybrids (33.3%). In addition, the stock of light commercial plug-in electric vehicles in use totaled 378 thousand units in 2019, and about half a million electric buses were in circulation, most of which are in China.
- Norsk Elbilforening (Norwegian Electric Vehicle Association) (May 2020). "Statistikk elbil: Bestand og markedsandel" [Electric car statistics: Stock and market share] (in Norwegian). Norsk Elbilforening. Retrieved 2020-05-21. Click on the tab "Elbil" for the stock of electric cars and "Ladbar hybrid" for the stock of plug-in hybrid. Place the pointing device over the graph to show the number of vehicles in use (on the road) at the end of each year or month. As of 31 December 2019, the stock of registered light-duty plug-in electric vehicles totaled 375,866 units, consisting of 260,688 battery electric vehicles and 115,178 plug-in hybrids. As of 31 March 2020, the stock of registered light-duty plug-in electric vehicles totaled 390,367 units, consisting of 268,962 battery electric vehicles and 121,405 plug-in hybrids (the difference between the two figures is new registrations in that period less normal fleet attrition - deregistered cars).
- Kane, Mark (2018-10-07). "10% Of Norway's Passenger Vehicles Are Plug Ins". InsideEVs.com. Retrieved 2018-11-07.
- "Electric Vehicles: Turning Buzz into Reality". European Automobile Manufacturers Association. 2010-02-09. Retrieved 2010-04-23.
- "Notice 2009–89: New Qualified Plug-in Electric Drive Motor Vehicle Credit". Internal Revenue Service. 2009-11-30. Retrieved 2010-04-01.
- "Consumer Energy Tax Incentives: Plug-In Hybrid Conversion Kits". U.S. Department of Energy. Retrieved 2010-04-01.
- "An Increasing Number of Member States Levy CO2-Based Taxation or Incentivise Electric Vehicles". European Automobile Manufacturers Association. 2010-04-21. Retrieved 2010-04-23.
- "Plug-in Vehicle Tracker: What's Coming, When". Plug In America. Retrieved 2012-01-15.
- "All-Electric Vehicle Basics". Alternative Fuels & Advanced Vehicles Data Center, US DoE. Retrieved 2010-12-29.
- Kurani; et al. (2007-10-16). "Driving Plug-In Hybrid Electric Vehicles: Reports from U.S. Drivers of HEVs converted to PHEVs, circa 2006–07" (PDF). Institute of Transportation Studies, University of California, Davis. Archived from the original (PDF) on 2010-08-12. Retrieved 2010-12-29. See definitions in pp. 1–2.
- Matthew A. Kromer & John B. Heywood (May 2007). "Electric Powertrains: Opportunities and Challenges in the U.S. Light-Duty Vehicle Fleet" (PDF). Sloan Automotive Laboratory, Massachusetts Institute of Technology. Retrieved 2010-12-29. See definitions in pp. 30–31.
- "Plug-in Hybrid Electric Vehicle Basics". Alternative Fuels & Advanced Vehicles Data Center, US DoE. Retrieved 2010-12-29.
- "Plug-In Hybrid Electric Vehicle (PHEV)". Center for Energy and the Global Environment, Virginia Tech. Archived from the original on 2011-07-20. Retrieved 2010-12-29.
- "What Is A Plug-in Hybrid Car?". HybridCars.com. Retrieved 2010-12-29.
- "How to Get a Plug-In Hybrid". CalCars. Retrieved 2010-12-29.
- "Plug-in Hybrid Conversions". HybridCars.com. Retrieved 2010-12-29.
- "Top 7 Issues for an Electric Car Conversion". HybridCars.com. 2009-06-02. Archived from the original on 2011-05-27. Retrieved 2010-12-29.
- PRTM Management Consultants, Inc. (April 2011). "The China New Energy Vehicles Program – Challenges and Opportunities" (PDF). World Bank. Retrieved 2020-06-19. See Acronyms and Key Terms, pp. v
- "Investing in Charging Infrastructure for Plug-In Electric Vehicles - Center for American Progress". Center for American Progress. Retrieved 2018-08-30.
- Saurin D. Shah (2009). David B. Sandalow (ed.). Chapter 2: Electrification of Transport and Oil Displacement (1st ed.). The Brookings Institution. pp. 29, 37 and 43. ISBN 978-0-8157-0305-1. in "Plug-in Electric Vehicles: What Role for Washington?"
- Sperling, Daniel and Deborah Gordon (2009). Two billion cars: driving toward sustainability. Oxford University Press, New York. pp. 22–26 and 114–139. ISBN 978-0-19-537664-7.
- Emily Masamitsu (2009-10-01). "How Much Is That Hybrid Electric Really Saving You?". Popular Mechanics. Retrieved 2010-07-11.
- "Electric Power Monthly: June 2010 Edition". U.S. Energy Information Administration. June 2010. Retrieved 2010-07-11. Prices correspond to average for March 2010 for the U.S. energy generation mix that month.
- Eric Evarts (2011-12-08). "Leaf, Volt tests show electric cars cost less per mile to operate". Consumer Reports. Archived from the original on 2012-01-08. Retrieved 2011-12-10.
- Edison Electric Institute (EEI) (April 2012). "Plug-In Electric Vehicles: Fueled by Affordable, Diverse, Domestic Energy" (PDF). EEI. Retrieved 2012-05-26.
- Edison Electric Institute(EEI) (April 2012). "National Average Monthly Gasoline Retail Price v. Monthly Residential Electricity Price 1976–2012" (PDF). EEI. Retrieved 2012-05-26.
- "The Dirty Truth about Plug-in Hybrids, Made Interactive". Scientific American. July 2010. Retrieved 2010-10-16. Click on the map to see the results for each region.
- Palm, Erik (2009-05-01). "Study: Electric cars not as green as you think | Green Tech – CNET News". News.cnet.com. Retrieved 2010-04-18.
- "Ricardo study finds electric and hybrid cars have a higher carbon footprint during production than conventional vehicles, but still offer a lower footprint over the full life cycle". Green Car Congress. 2011-06-08. Retrieved 2011-06-11.
- Mike Millikin (2014-03-13). "Volkswagen: e-mobility and sustainability; Part 1, the e-Golf and Golf GTE". Green Car Congress. Retrieved 2014-03-13. See the infograph CO2 emissions over the full life-cycle (t CO2e).
- U. S. Environmental Protection Agency (October 2014). "Light-Duty Automotive Technology, Carbon Dioxide Emissions, and Fuel Economy Trends: 1975 Through 2014" (PDF). EPA. Archived from the original (PDF) on 2014-10-18. Retrieved 2014-10-11. See Table 7.2 – MY 2014 Alternative Fuel Vehicle Powertrain and Range; pp. 98; Table 7.3 for overall fuel economy (mpg-e), pp. 100; Table 7.4 for tailpipe CO2 emissions, pp. 102; and Table 7.5 for upstream CO2 Emission, pp. 105.
- Mike Millikin (2014-10-11). "EPA Trends on EVs and PHEVs; beginning of a "measurable and meaningful impact" on new vehicle fuel economy and emissions". Green Car Congress. Retrieved 2014-10-11.
- United States Environmental Protection Agency and U.S. Department of Energy (2015-12-18). "Model Year 2016 Fuel Economy Guide - Electric vehicles & Plug-in Hybrid Electric Vehicles" (PDF). fueleconomy.gov. Retrieved 2015-12-18. See pp. 27–28 for all-electric vehicles and pp. 30–31 for plug-in hybrid electric vehicles. The average 2016 vehicle gets 25 mpg
- United States Environmental Protection Agency and U.S. Department of Energy (2016-11-16). "Model Year 2017 Fuel Economy Guide - Electric vehicles & Plug-in Hybrid Electric Vehicles" (PDF). fueleconomy.gov. Retrieved 2016-11-19. pp. 32–36.
- Don Anair & Amine Mahmassani (April 2012). "State of Charge: Electric Vehicles' Global Warming Emissions and Fuel-Cost Savings across the United States" (PDF). Union of Concerned Scientists. Retrieved 2012-04-16. pp. 16–20.
- Paul Stenquist (2012-04-13). "How Green Are Electric Cars? Depends on Where You Plug In". The New York Times. Retrieved 2012-04-14.
- Paul Stenquist (2012-04-13). "Carbon In, Carbon Out: Sorting Out the Power Grid". The New York Times. Retrieved 2012-04-14. See map for regional results
- Paul Stenquist (2012-04-13). "When it Comes to Carbon Dioxide, Lower is Better and Zero is Perfect". The New York Times. Retrieved 2012-04-14.
- Paul Stenquist (2014-09-19). "Coal Fades, So Electrics Get Cleaner". The New York Times. Retrieved 2014-10-12.
- Don Anair (2014-09-16). "How do EVs Compare with Gas-Powered Vehicles? Better Every Year…". Union of Concerned Scientists (UCS). Retrieved 2014-10-12.
- Nealer, Rachael; Reichmuth, David; Anair, Don (November 2015). "Cleaner Cars from Cradle to Grave: How Electric Cars Beat Gasoline Cars on Lifetime Global Warming Emissions" (PDF). Union of Concerned Scientists (UCS). Retrieved 2014-11-22.
- Sebastian Blanco (2015-11-17). "UCS: Well-to-wheel, EVs cleaner than pretty much all gas cars". Autoblog (website). Retrieved 2015-11-22.
- "The ZEV's invisible tailpipe – Are zero-emission vehicles cleaner than petrol cars? It all depends..." The Economist. 2014-11-24. Retrieved 2014-12-08.
- Graff Zivina, Joshua S.; Kotchenb, Matthew J.; Mansur, Erin T. (November 2014). "Spatial and temporal heterogeneity of marginal emissions: Implications for electric cars and other electricity-shifting policies" (PDF). Journal of Economic Behavior and Organization. 107 (Part A): 248–268. doi:10.1016/j.jebo.2014.03.010. Published on line 2014-03-24. See pp. 251
- "India named least green country for electric cars". The Guardian. 2013-02-07. Retrieved 2013-07-08.
- Michaël Torregrossa (2013-03-21). "Véhicules électriques et émissions de CO2 – de 70 à 370 g CO2/km selon les pays" [Electric Vehicles and CO2 emissions – 70 to 370 g CO2/km by country] (in French). Association pour l'Avenir du Véhicule Electrique Méditerranéen (AVEM). Retrieved 2013-07-08.
- Lindsay Wilson (February 2013). "Shades of Green: Electric Cars' Carbon Emissions Around the Globe". Shrink That Footprint. Retrieved 2013-07-08.
- Mitchell, William J.; Borroni-Bird, Christopher; Burns, Lawrence D. (2010). Reinventing the Automobile: Personal Urban Mobility for the 21st Century (1st. ed.). The MIT Press. pp. 85–95. ISBN 978-0-262-01382-6. Archived from the original on 2010-06-09. Retrieved 2010-07-18. See Chapter 5: Clean Smart Energy Supply.
- R. James Woolsey and Chelsea Sexton (2009). David B. Sandalow (ed.). Chapter 1: Geopolitical Implications of Plug-in Vehicles (1st ed.). The Brookings Institution. pp. 11–21. ISBN 978-0-8157-0305-1.in "Plug-in Electric Vehicles: What Role for Washington?"
- "High oil prices disastrous for developing countries". Mongabay. 2007-09-12. Retrieved 2010-07-20.
- "Impact of High Oil Prices on African Economies" (PDF). African Development Bank. 2009-07-29. Retrieved 2010-07-20.
- Andrew Grove and Robert Burgelman (December 2008). "An Electric Plan for Energy Resilience". McKinsey Quarterly. Archived from the original on 2014-08-25. Retrieved 2010-07-20.
- Jon Wellinhoff (2009). David B. Sandalow (ed.). Chapter 4: The CashBack Car (1st ed.). The Brookings Institution. pp. 65–82. ISBN 978-0-8157-0305-1. in "Plug-in Electric Vehicles: What Role for Washington?"
- "Car Prototype Generates Electricity, And Cash". Science Daily. December 9, 2007. Retrieved 2010-07-17.
- Cleveland, Cutler J.; Morris, Christopher (2006). Dictionary of Energy. Amsterdam: Elsevier. p. 473. ISBN 0-08-044578-0.
- "Pacific Gas and Electric Company Energizes Silicon Valley With Vehicle-to-Grid Technology". Pacific Gas & Electric. 2007-04-07. Archived from the original on 2009-12-09. Retrieved 2011-01-12.
- National Research Council (2010). "Transitions to Alternative Transportation Technologies—Plug-in Hybrid Electric Vehicles". The National Academies Press. Retrieved 2010-03-03.
- Jad Mouawad & Kate Galbraith (2009-12-14). "Study Says Big Impact of the Plug-In Hybrid Will Be Decades Away". New York Times. Retrieved 2010-03-04.
- Paul Stenquist (2012-06-25). "Tesla Model S Offers a Lesson in Electric-Vehicle Economics". The New York Times. Retrieved 2012-06-25.
- Siddiq Khan & Martin Kushler (June 2013). "Plug-in Electric Vehicles: Challenges and Opportunities" (PDF). American Council for an Energy-Efficient Economy. Retrieved 2013-07-09. ACEEE Report Number T133.
- Randall, Tom (2016-02-25). "Here's How Electric Cars Will Cause the Next Oil Crisis". Bloomberg News. Retrieved 2016-02-25. See embedded video.
- Henry Lee & Grant Lovellette (July 2011). "Will Electric Cars Transform the U.S. Vehicle Market?". Belfer Center for Science and International Affairs, Kennedy School of Government. Retrieved 2011-08-07.
- Henry Lee & Grant Lovellette (July 2011). "WillElectric Cars Transform the U.S. Vehicle Market?" (PDF). Belfer Center for Science and International Affairs, Kennedy School of Government. Retrieved 2011-08-07. Discussion Paper #2011-08, pages 9–18.
- Nikki Gordon-Bloomfield (2013-06-13). "Power Institute Study: Total Cost of Ownership Cheaper for Electric Cars". Retrieved 2013-06-13.
- Alan L. Madian; et al. (2009). David B. Sandalow (ed.). Chapter 5: The Impact of Plug-in Hybrids on U.S. Oil Use and Greenhouse Gas Emissions. The Brookings Institution. p. 96. ISBN 978-0-8157-0305-1. in "Plug-in Electric Vehicles: What Role for Washington?"
- Kevin Morrow; et al. (November 2008). "Plug-in Hybrid Electric Vehicle Charging Infrastructure Review. Final Report" (PDF). U.S. Department of Energy Vehicle Technologies Program. Archived from the original (PDF) on 2009-12-22. Retrieved 2010-03-07.
- Todd Woody & Clifford Krauss (2010-02-14). "Cities Prepare for Life With the Electric Car". New York Times. Retrieved 2010-03-07.
- "Moving Forward in Raleigh PGR Plan". Project Get Ready. Archived from the original on 2009-03-07. Retrieved 2010-03-07.
- RechargeIT Driving Experiment – RechargeIT is a program sponsored by Google.org, a non-profit created by Google. Archived 2010-12-09 at the Wayback Machine
- Adam Palin (2013-11-19). "Infrastructure: Shortage of electric points puts the brake on sales". Financial Times. Retrieved 2013-12-28.
- KredEx (2013-02-20). "Estonia becomes the first in the world to open a nationwide electric vehicle fast-charging network". Estonian World. Retrieved 2013-12-28.
- Adam Vaughan (2013-02-20). "Estonia launches national electric car charging network". The Guardian. Retrieved 2013-12-28.
- Garrick, David (2016-03-16). "Car2Go switching electric cars to gas". The San Diego Union-Tribune. Retrieved 2016-03-25.
- "Renault-Nissan and Project Better Place Sign MoU for Mass Marketed EVs in Israel; Implementing New Ownership Model". Green Car Congress. 2008-01-28. Retrieved 2010-05-16.
- Shai Agassi, David Pogue, Gavin Newsom (2009-03-19). Making The World A 'Better Place' (YouTube). San Francisco, CA: CBS News Sunday Morning; CBS Interactive, Inc. Event occurs at 3:45.
Shai Agassi: "We [Better Place] don't let you [the customer] buy a battery; we [Better Place] buy the battery.
- Woody, Todd (2009-09-15). "Better Place Unveils Electric-Car Software". New York Times. Retrieved 2010-05-16.
- "Better Place. The Renault Fluence ZE". Better Place. 2010-10-22. Archived from the original on 2010-09-12. Retrieved 2010-10-22.
- Jim Motavalli (2011-07-29). "Plug-and-Play Batteries: Trying Out a Quick-Swap Station for E.V.'s". The New York Times. Retrieved 2013-06-23.
- Isabel Kershner (2013-05-26). "Israeli Venture Meant to Serve Electric Cars Is Ending Its Run". The New York Times. Retrieved 2013-05-27.
- Niv Elis (2013-05-26). "Death of Better Place: Electric car co. to dissolve". The Jerusalem Post. Retrieved 2013-05-30.
- Sebastian Blanco (2009-09-27). "REPORT: Tesla Model S was designed with battery swaps in mind". Autoblog Green. Retrieved 2013-06-22.
- Mark Rogowsky (2013-06-21). "Tesla 90-Second Battery Swap Tech Coming This Year". Forbes. Retrieved 2013-06-22.
- "Tesla Motors demonstrates battery swap in the Model S". Green Car Congress. 2013-06-21. Retrieved 2013-06-22.
- "Sunny days ahead for plastic solar modules". Automotive Engineering International. 2009-10-14. Archived from the original on 2012-09-29. Retrieved 2010-07-15.
- Carpenter, Susan (2010-03-30). "Nissan Leaf's promise: An affordable electric". Los Angeles Times. Retrieved 2010-07-15.
- YouTube (2009-11-30). "Nissan Leaf electric vehicle – CNET". YouTube. Retrieved 2010-07-15.
- "Reva Revs Phone-Controlled Charging for Electric Cars". Earth2tech.com. 2009-08-09. Retrieved 2010-07-15.
- "Reva remote charge to be unlocking battery reserve remotely". AutoblogGreen. 2009-09-10. Retrieved 2010-07-15.
- Csere, Csaba (2012-10-31). Car and Driver: Tested : 2012 Fisker Karma – Review – CAR and DRIVER. Beverly Hills, CA: Car and Driver magazine. Event occurs at 13m30s.
- Brian Cooley. "2011 Nissan Leaf – CNET". CNET CNET Car Tech. Retrieved 2011-01-09.
- Jim Motavalli (2010-07-08). "Will Electric Cars Cause More Summer Power Outages?". New York Times. Retrieved 2010-07-11.
- B. Naghibi, M. A. S. Masoum and S. Deilami, "Effects of V2H Integration on Optimal Sizing of Renewable Resources in Smart Home Based on Monte Carlo Simulations," in IEEE Power and Energy Technology Systems Journal, vol. 5, no. 3, pp. 73-84, Sept. 2018. doi: 10.1109/JPETS.2018.2854709
- David Biello (2013-06-18). "Will You or the Grid Control Your Electric Car?". Scientific American. Retrieved 2013-06-23.
- Berman, Bradley (22 April 2020). "Study of 3,900 electric cars: How the Tesla Model 3 transformed EV charging habits". Electrek.
- "Utilities are feeling growing pains from the evolution of electric vehicles". FleetCarma. 22 April 2020. Archived from the original on 23 April 2020.
- Nuckols, Ben (3 March 2007). "Blind people: Hybrid cars pose hazard". USA Today. Retrieved 2009-05-08.
- "Electric cars and noise: The sound of silence". Economist. 7 May 2009. Retrieved 2009-05-08.
- "Incidence of Pedestrian and Bicyclist Crashes by Hybrid Electric Passenger Vehicles" (PDF). National Highway Traffic Safety Administration. September 2009. Retrieved 2009-10-05. Technical Report DOT HS 811 204
- "Hybrid Cars Are Harder to Hear". University of California, Riverside. 2008-04-28. Retrieved 2010-07-03.
- Sarah Simpson (August 2009). "Are Hybrid Cars Too Quiet to Be Safe for Pedestrians?". Scientific American. Retrieved 2010-07-03.
- "TMC to Sell Approaching Vehicle Audible System for 'Prius'". Toyota Motor Company News Release. 2010-08-24. Retrieved 2010-08-25.
- American Council of the Blind Press Release (2010-12-16). "Critical Pedestrian Safety Legislation Moves to White House for President's Signature". PR Newswire. Retrieved 2010-12-17.
- "S. 841 Pedestrian Safety Enhancement Act of 2010". Legislative Digest. 2010-12-15. Archived from the original on 2010-12-22. Retrieved 2010-12-17.
- Larry Dignan (2010-12-16). "Hybrid, electric vehicles to become louder for pedestrian safety". SmartPlanet.com. Archived from the original on 2010-12-19. Retrieved 2010-12-17.
- Shepardson, David (2018-02-26). "U.S. finalizes long-delayed 'quiet cars' rule, extending deadline". Reuters. Retrieved 2018-03-04.
- European Commission Press Release (2014-04-02). "Commission welcomes Parliament vote on decreasing vehicle noise". European Commission. Retrieved 2014-04-03.
- Spotnitz, R.; Franklin, J. (2003). "Abuse behavior of high-power, lithium-ion cells". Journal of Power Sources. 113: 81–100. doi:10.1016/S0378-7753(02)00488-3.
- "Lithium Ion technical handbook" (PDF). Gold Peak Industries Ltd. November 2003. Archived from the original (PDF) on 2007-10-07. Cite journal requires
|journal=(help) - Winter, M.; Brodd, J. (2004). "What Are Batteries, Fuel Cells, and Supercapacitors?". Chemical Reviews. 104 (10): 4245–69. doi:10.1021/cr020730k. PMID 15669155.CS1 maint: ref=harv (link)
- "Apple to recall 1.8 million notebook batteries – Aug. 24, 2006". cnn.com.
- "PC Notebook Computer Batteries Recalled Due to Fire and Burn Hazard". Archived from the original on 2013-01-08.
- "Lenovo and IBM Announce Recall of ThinkPad Notebook Computer Batteries Due to Fire Hazard". Archived from the original on 2013-01-08.
- "THE INQUIRER – News, reviews and opinion for tech buffs". theinquirer.net.
- "Dreamliner: Boeing 787 planes grounded on safety fears". BBC News. Retrieved 2013-06-23.
- "Japanese airlines ground Boeing 787s after emergency landing". Reuters. 2013-01-16. Retrieved 2013-06-23.
- China Autoweb (2012-05-28). "Initial details on fiery crash involving BYD e6 that killed 3". Green Car Congress. Retrieved 2012-08-13.
- Christopher Jensen (2013-10-02). "Tesla Says Car Fire Started in Battery". The New York Times. Retrieved 2013-10-05.
- Steven Russolillo (2013-10-04). "Musk Explains Why Tesla Model S Caught on Fire". The Wall Street Journal. Retrieved 2013-10-05.
- Jaclyn Trop (2013-11-07). "Another Fire Raises Questions for Tesla". The New York Times. Retrieved 2013-11-10.
- Neil Roland (2012-08-09). "Feds Researching Fire Risks from EV Batteries". MSN Autos. Archived from the original on 2013-09-11. Retrieved 2013-06-23.
- General Motors (2011-01-19). "Detroit First Responders Get Electric Vehicle Safety Training". General Motors News. Retrieved 2011-11-12.
- Nissan (2010). "2011 LEAF First Responder's Guide" (PDF). Nissan North America. Retrieved 2011-12-20.
- Irving Mintzer (2009). David B. Sandalow (ed.). Chapter 6: Look Before You Leap: Exploring the Implications of Advanced Vehicles for Import Dependence and Passerger Safety (PDF). The Brookings Institution. pp. 107–126. ISBN 978-0-8157-0305-1. Archived from the original (PDF) on 2016-05-17. Retrieved 2010-05-15. in "Plug-in Electric Vehicles: What Role for Washington?"
- Clifford Krauss (2009-03-09). "The Lithium Chase". New York Times. Retrieved 2010-03-10.
- Tim Folger (June 2011). "Rare Earth Elements: The Secret Ingredients of Everything". National Geographic. Retrieved 2011-06-12.
- Alan Ohnsman (2011-01-14). "Toyota Readying Motors That Don't Use Rare Earths". Bloomberg. Retrieved 2011-01-19.
- Hiscock, Geoff (2015-11-18). "Electric vehicles, storage units drive prices up". The Nikkei. Retrieved 2016-02-29.
- Simon Romero (2009-02-02). "In Bolivia, Untapped Bounty Meets Nationalism". New York Times. Retrieved 2010-02-28.
- Jerry Garret (2010-04-15). "A Case for and Against Electric Cars". New York Times. Retrieved 2010-04-17.
- "Página sobre el Salar (Spanish)". Evaporiticosbolivia.org. Archived from the original on 2011-03-23. Retrieved 2010-11-27.
- Brendan I. Koerner (2008-10-30). "The Saudi Arabia of Lithium". Forbes. Retrieved 2011-05-12. Published on Forbes Magazine dated November 24, 2008.
- "USGS Mineral Commodities Summaries 2009" (PDF). U. S. Geological Survey. January 2009. Retrieved 2010-03-07. See page 95.
- Hammond, C. R. (2000). The Elements, in Handbook of Chemistry and Physics 81st edition. CRC press. ISBN 0-8493-0481-4.
- "Japan To Offer Technical Aid On Lithium To Bolivia". Green Car Congress. 2010-09-12. Retrieved 2010-09-12.
- "S. Korean companies to help Bolivia develop lithium industries". Trading Markets. 2010-04-23. Retrieved 2010-09-12.
- Gaines, LL. Nelson, P. (2010). "Lithium-Ion Batteries: Examining Material Demand and Recycling Issues". Argonne National Laboratory. Archived from the original on 3 August 2016. Retrieved 11 June 2016.CS1 maint: multiple names: authors list (link)
- "Study finds resource constraints should not be a limiting factor for large-scale EV battery production". Green Car Congress. 2011-06-17. Retrieved 2011-06-17.
- "University of Michigan and Ford researchers see plentiful lithium resources for electric vehicles". Green Car Congress. 2011-08-03. Retrieved 2011-08-11.
- Keith Bradsher (2009-08-31). "China Tightens Grip on Rare Minerals". New York Times. Retrieved 2010-09-27.
- "Rare earths and China – Dirty business". The Economist. 2010-09-30. Retrieved 2010-09-30.
- "Rare earths – Digging in". The Economist. 2010-09-02. Retrieved 2010-09-11.
- "Worries mount over China's 'rare earth' export ban". EurActiv.com. 2010-06-11. Retrieved 2010-09-11.
- Keith Bradsher (2010-09-23). "Amid Tension, China Blocks Crucial Exports to Japan". New York Times. Retrieved 2010-09-23.
- "Critical Materials Strategy" (PDF). U.S. Department of Energy. December 2010. Retrieved 2010-12-15.
- Keith Bradsher (2010-12-15). "U.S. Called Vulnerable to Rare Earth Shortages". New York Times. Retrieved 2010-12-15.
- Keith Bradsher (2010-12-28). "China to Tighten Limits on Rare Earth Exports". New York Times. Retrieved 2010-12-29.
- "H.R.6160 – Rare Earths and Critical Materials Revitalization Act of 2010". Open Congress. 2010-09-29. Archived from the original on 2010-10-15. Retrieved 2010-10-16.
- James T. Areddy (2010-10-01). "U.S. Congress Spurs Rare Earth Race". Wall Street Journal. Retrieved 2010-10-16.
- "As Tensions Over Rare Earth Supplies Rise, New Solutions Are Beginning to Emerge". HybridCars.com. 2010-10-12. Archived from the original on 2010-10-16. Retrieved 2010-10-16.
- "S. 3521: Rare Earths Supply Technology and Resources Transformation Act of 2010". Govtrack.us. Retrieved 2010-10-16.
- Matt Ritchel (2015-11-24). "A Car Dealers Won't Sell: It's Electric". The New York Times. Retrieved 2015-11-28.
- Eric Cahill & Dan Sperling (2014-11-03). "The Future Of Electric Vehicles Part 1: Car Dealers Hold The Key". Institute of Transportation Studies (ITS), at the University of California, Davis. Retrieved 2015-11-28.
- Cahill, Eric; Davies-Shawhyde, Jamie; Turrentine, Thomas S. (October 2014). "New Car Dealers and Retail Innovation in California's Plug-In Electric Vehicle Market". Institute of Transportation Studies (ITS), at the University of California, Davis. Retrieved 2015-11-29. Working Paper – UCD-ITS-WP-14-04. Click on the bar "Download PDF"
- Eric Evarts (2014-04-22). "Dealers not always plugged in about electric cars, Consumer Reports' study reveals". Consumer Reports. Retrieved 2015-11-29.
- Wappelhorst, Sandra; Hall, Dale; Nicholas, Mike; Lutsey, Nic (February 2020). "Analyzing Policies to Grow the Electric Vehicle Market in European Cities" (PDF). International Council on Clean Transportation. Retrieved 2020-06-18.
- Zhuge, Chengxiang; Wei, Binru; Shao, Chunfu; Shan, Yuli; Dong, Chunjiao (April 2020). "The role of the license plate lottery policy in the adoption of Electric Vehicles: A case study of Beijing". Energy Policy. 139: 111328. doi:10.1016/j.enpol.2020.111328. Retrieved 2020-06-18. Available online 24 February 2020.
- Camila Salazar (2013-07-06). "Carros híbridos y eléctricos se abren paso en Costa Rica" [Hybrid and electric cars make their way in Costa Rica]. La Nación (San José) (in Spanish). Retrieved 2013-07-06.
- Vallejo Uribe, Felipe (2019-07-13). "Sancionada ley que da beneficios a propietarios de vehículos eléctricos en Colombia" [Went into effec law that gives benefits to owners of electric vehicles in Colombia] (in Spanish). Revista Movilidad Eléctrica Sostenible. Retrieved 2020-06-19.
- Tan, Christopher (18 February 2020). "Singapore Budget 2020: Push to promote electric vehicles in move to phase out petrol and diesel vehicles". The Straits Times. Retrieved 19 June 2020.
- "The great crawl". The Economist. 2016-06-18. Retrieved 2020-06-18. From the print edition.
- "Decreto 575 de 2013 Alcalde Mayor" [Major's Decree 575 of 2013] (in Spanish). Alcaldía de Bogotá. 2014-12-18. Retrieved 2020-06-18.
- "Elétricos e híbridos: São Paulo aprova lei de incentivo" [All-electric and hybrids: São Paulo approves incentives law]. Automotive Business (in Portuguese). 2014-05-28. Retrieved 2014-09-21.
- Notimex (2015-03-01). "Autos eléctricos, exentos de tenencia y Hoy No Circula" [Electric cars exempted from ownership tax and "Hoy No Circula" driving restrictions]. Dinero e Imagen (in Spanish). Retrieved 2020-06-19.
- "Norwegian EV policy". Norsk Elbilforening (Norwegian Electric Vehicle Association). Retrieved 2020-06-18.
- Cobb, Jeff (2016-03-08). "Norway Aiming For 100-Percent Zero Emission Vehicle Sales By 2025". HybridCars.com. Retrieved 2020-06-18.
- Wappelhorst, Sandra (May 2020). "The end of the road? An overview of combustionengine car phase-out announcements across Europe" (PDF). International Council on Clean Transportation. Retrieved 2020-06-21.
- McGrath, Matt (2019-04-08). "London's ULEZ: How does it compare?". Retrieved 2019-06-19.
- Oxford City Council (2020-03-20). "Oxford's Zero Emission Zone - 20/03/2020 update". Oxford City Council. Retrieved 2020-06-18.
- Tobin, Dominic (2019-03-12). "Clean air zone charges: where are Britain's low emission zones?". buyacar.co.uk. Retrieved 2020-03-29.
- "City of Amsterdam to ban polluting cars from 2030". Reuters. 2019-05-02. Retrieved 2019-05-02.
- Burch, Isabella (March 2020). "Survey of Global Activity to Phase Out Internal Combustion Engine Vehicles" (PDF).
- Harvey, Fiona (2016-12-02). "Four of world's biggest cities to ban diesel cars from their centres". the Guardian. Retrieved 2018-04-08.
- "Rome latest city to announce car ban, will ban diesel cars from historical center starting 2024". 28 February 2018.
- Sherry Boschert (2006). Plug-in Hybrids: The Cars that will Recharge America. New Society Publishers, Gabriola Island, Canada. ISBN 978-0-86571-571-4.
- Danny King (2011-06-20). "Neighborhood Electric Vehicle Sales To Climb". Edmunds.com Auto Observer. Archived from the original on 2012-05-27. Retrieved 2012-02-05.
- International Energy Agency (IEA), Clean Energy Ministerial, and Electric Vehicles Initiative (EVI) (June 2017). "Global EV Outlook 2017: Two million and counting" (PDF). IEA Publications. Archived from the original (PDF) on 2017-06-07. Retrieved 2018-01-20.CS1 maint: multiple names: authors list (link) See pp. 5–7, 12–22, 27–28, and Statistical annex, pp. 49–51.
- Jose, Pontes (2019-01-31). "Global Top 20 - December 2018". EVSales.com. Retrieved 2019-01-31. "Global sales totaled 2,018,247 plug-in passenger cars in 2018, with a BEV:PHEV ratio of 69:31, and a market share of 2.1%. The world's top selling plug-in car was the Tesla Model 3, and Tesla was the top selling manufacturer of plug-in passenger cars in 2018, followed by BYD."
- "Alliance members achieve combined sales of 10.76 million units in 2018". Groupe Renault Media (Press release). Paris. 2019-01-30. Retrieved 2019-02-02. As of December 2018, a total of 724,905 electric vehicles have been sold by the Alliance since 2010.
- Cobb, Jeff (2017-01-26). "Tesla Model S Is World's Best-Selling Plug-in Car For Second Year In A Row". HybridCars.com. Retrieved 2017-01-26. See also detailed 2016 sales and cumulative global sales in the two graphs.
- Kane, Mark (2019-01-02). "Tesla Production And Deliveries Graphed Through Q4 2018". InsideEVs.com. Retrieved 2019-01-02.
- Sharan, Zachary (2017-02-04). "Tesla Model S & Nissan LEAF Clocked As World's Best-Selling Electric Cars In 2016". EV Volumes. CleanTechnica.com. Retrieved 2017-02-04.
- Cobb, Jeff (2017-01-16). "The World Just Bought Its Two-Millionth Plug-in Car". HybridCars.com. Retrieved 2017-01-17. An estimated 2,032,000 highway-legal plug-in passenger cars and vans have been sold worldwide at the end of 2016. The top selling markets are China (645,708 new energy cars, including imports), Europe (638,000 plug-in cars and vans), and the United States (570,187 plug-in cars). The top European country markets are Norway (135,276), the Netherlands (113,636), France (108,065), and the UK (91,000). Total Chinese sales of domestically produced new energy vehicles, including buses and truck, totaled 951,447 vehicles. China was the top selling plug-in car market in 2016, and also has the world's largest stock of plug-in electric cars.
- Cobb, Jeff (2016-11-07). "China's BYD Becomes World's Third-Largest Plug-in Car Maker". HybridCars.com. Retrieved 2016-11-07.
- "Top 10 Automakers by 2017 NEV Sales". Gasgoo China Automotive News. 2018-01-18. Retrieved 2018-01-29.
According to the data released by China Passenger Car Association (CPCA), BYD topped the rank with annual NEV delivery of 113,669 units, increasing 11% year on year. With NEV deliveries soaring 125% on an annual basis to 104,520 units, BAIC BJEV took the second place among the top ten automakers.
- Kane, Mark (2019-01-14). "BYD Sold Record 37,000 Electric Cars In December 2018". InsideEVs.com. Retrieved 2019-01-14. BYD Auto sold in China 227,152 plug-in cars, up 109% from 2017. During 2018 BYD Qin sales totaled 47,425 units and BYD Tang sales totaled 37,146 units.
- Kane, Mark (2018-01-26). "BYD #1 In World For Plug-In Electric Car Sales In 2017, Beats Tesla Again". InsideEVs.com. Retrieved 2018-01-29. "BYD sold 108,612 passenger plug-in cars in China in 2017, enough to make it the world's top selling plug-in car manufacturer for the third year in a row."
- Mark Kane (2019-01-11). "BMW Sold 142,617 Plug-In Electric Cars In 2018". Inside EVs. Retrieved 2019-01-12. The BMW Group sold 142,617 plug-in electric cars in 2018, and cumulative sales since inception of the BMW i3 totaled over 356,000 BMW and MINI electrified vehicles. BMW set a target of cumulative sales of 500,000 units by the end of 2019.
- Cobb, Jeff (2016-01-12). "Tesla Model S Was World's Best-Selling Plug-in Car in 2015". HybridCars.com. Retrieved 2016-02-06. The Tesla Model S was the top selling plug-in electric car in 2015 with 50,366 units sold, followed by the Nissan Leaf (about 43,000), the Mitsubishi Outlander P-HEV (over 40,000), the BYD Qin (31,898) and the BMW i3 (24,057). The Model S is also the second-best seller ever with 107,148 sales since its mid-2012 launch, behind the Nissan Leaf and ahead of GM’s Volt/Ampera family, credited with 106,000 sales.
- John Voelcker (2016-01-15). "Who Sold The Most Plug-In Electric Cars In 2015? (It's Not Tesla Or Nissan)". Green Car Reports. Retrieved 2016-01-17. BYD Auto delivered 31,898 Qins, 18,375 Tangs, and 7,029 e6s during 2015. Added to that are small numbers of the T3 small commercial van and e5 battery-electric compact sedan, along with 2,888 Denza EV compact hatchbacks built by its joint venture with Daimler. Altogether, BYD sold a total of 61,722 light-duty plug-in electric vehicles in China in 2015.
- Natasha Li (2016-03-04). "Alternative Energy Vehicles Account HALF of BYD's Profits for the Very First Time in 2015". Gasgoo Automotive News. Archived from the original on 2016-03-08. Retrieved 2016-03-07. BYD Auto delivered 69,222 new energy vehicles in China in 2015, including buses, of which, a total of 61,722 were passenger vehicles, mostly plug-in hybrids, led by the Qin and Tang.
- Jin Peiling (2017-01-10). "谁是2016年电动汽车市场的霸主?" [Who is the dominant electric vehicle market in 2016?] (in Chinese). Daily Observation Car. Archived from the original on 2017-01-16. Retrieved 2017-01-15. BYD sold more than 100,000 new energy passenger cars in China in 2016, about 30,000 more units than Tesla Motors. The BYD Tang was the top selling plug-in car in China in 2016 with 31,405 units delivered.
- Jose Pontes (2018-01-18). "China December 2017". EV Sales. Retrieved 2018-01-19. Sales of plug-in electric cars in China, including imports, totaled 600,174 units in 2017. The BAIC EC-Series was the top selling plug-in with 78,079 units sold in China, making the city car the world's top selling plug-in car in 2017. The top selling plug-in hybrid was the BYD Song PHEV with 30,920 units. BYD Auto was the top selling car manufacturer. Foreign brands captured only about 4% of plug-in sales in 2017, with about half by Tesla. The Chinese plug-in car market represented roughly half of the 1.2 million plug-ins sold worldwide in 2017.
- Jose, Pontes (2019-02-03). "2018 Global Sales by OEM". EVSales.com. Retrieved 2019-02-03. "Tesla led plug-in car sales among automotive groups in 2018, with 245,240 units delivered, followed by BYD with 229,338, and the Renault-Nissan Alliance with 192,711."
- "BYD NEV sales in 2018 exceed 240,000 units". Gasgoo. 2019-01-08. Retrieved 2019-01-14. BYD Auto sold 247,811 new energy vehicles in 2018 (including commercial heavy-duty vehicles), up 118% from 2018, of which, 227,152 were passenger cars, consisting of 103,263 units all-electric cars and 123,889 units were plug-in hybrid vehicles. In addition, 20,659 new energy commercial vehicles were sold in 2018.
- Justin Gerdes (2012-05-11). "The Global Electric Vehicle Movement: Best Practices From 16 Cities". Forbes. Retrieved 2014-10-20.
- International Energy Agency (IEA), Clean Energy Ministerial, and Electric Vehicles Initiative (EVI) (May 2016). "Global EV Outlook 2016: Beyond one million electric cars" (PDF). IEA Publications. Archived from the original (PDF) on 2016-08-24. Retrieved 2016-09-07.CS1 maint: multiple names: authors list (link) See pp. 4–5, and 24–25 and Statistical annex, pp. 34–37.
- Clark, Pilita; Campbell, Peter (2016-08-31). "Motor Industry: Pressure on the Pump". Financial Times. Retrieved 2016-09-01.
- Argonne National Laboratory, United States Department of Energy (2016-03-28). "Fact #918: March 28, 2016 – Global Plug-in Light Vehicles Sales Increased By About 80% in 2015". Office of Energy Efficiency & Renewable Energy. Retrieved 2016-03-29.
- Nic Lutsey (2015-09-29). "Global milestone: The first million electric vehicles". International Council on Clean Transportation (ICCT). Retrieved 2015-10-10.
- International Energy Agency (IEA), Clean Energy Ministerial, and Electric Vehicles Initiative (EVI) (May 2018). "Global EV Outlook 2017: 3 million and counting" (PDF). IEA Publications. Retrieved 2018-10-23.CS1 maint: multiple names: authors list (link) See pp. 9–10, 19–23, 29–28, and Statistical annex, pp. 107–113. The global stock of plug-in electric passenger cars totaled 3,109,050 units, of which, 1,928,360 were battery electric cars..
- European Automobile Manufacturers Association (ACEA) (2017-02-01). "New Passenger Car Registrations By Alternative Fuel Type In The European Union: Quarter 4 2016" (PDF). ACEA. Retrieved 2018-10-23. See table New Passenger Car Registrations By Market In The EU + EFTA - Total Electric Rechargeable Vehicles: Total EU + EFTA in Q1-Q4 2015.
- European Automobile Manufacturers Association (ACEA) (2018-02-01). "New Passenger Car Registrations By Alternative Fuel Type In The European Union: Quarter 4 2017" (PDF). ACEA. Retrieved 2018-10-23. See table New Passenger Car Registrations By Market In The EU + EFTA - Total Electric Rechargeable Vehicles: Total EU + EFTA in Q1-Q4 2017 and Q1-Q4 2016.
- International Energy Agency (IEA), Clean Energy Ministerial, and Electric Vehicles Initiative (EVI) (May 2019). "Global EV Outlook 2019: Scaling-up the transition to electric mobility" (PDF). IEA Publications. Retrieved 2020-05-11.CS1 maint: multiple names: authors list (link) See Statistical annex, pp. 210–213. The global stock of plug-in electric passenger cars totaled 5,122,460 units at the end of 2018, of which, 3,290,800 (64.2%) were battery electric cars (See Tables A.1 and A.2)..
- European Automobile Manufacturers Association (ACEA) (2020-02-06). "New Passenger Car Registrations By Alternative Fuel Type In The European Union: Quarter 4 2019" (PDF). ACEA. Retrieved 2020-05-11. See table New Passenger Car Registrations By Market In The EU + EFTA - Total Electric Rechargeable Vehicles: Total EU + EFTA in Q1-Q4 2018 and 2019.
- Cobb, Jeff (2016-01-18). "Top Six Plug-in Vehicle Adopting Countries – 2015". HybridCars.com. Retrieved 2016-02-12. About 520,000 highway legal light-duty plug-in electric vehicles were sold worldwide in 2015, with cumulative global sales reaching 1,235,000. The United States was the leading market with 411,120 units sold since 2008, followed by China with 258,328 units sold since 2011. Japan ranks third, followed by the Netherlands (88,991), Norway (77,897), France (74,291), and the UK (53,254). Over 21,000 units were sold in Japan in 2015.
- Berman, Brad (2016-02-13). "US Falls Behind Europe and China in Global Plug-in Vehicle Market". Plugincars.com. Retrieved 2016-02-16.
- Staff (February 2017). "Global Plug-in Sales for 2016". EV-Volumes.com. Retrieved 2017-02-05.
- Vaughan, Adam (2017-12-25). "Electric and plug-in hybrid cars whiz past 3m mark worldwide". The Guardian. Retrieved 2018-01-20. "The number of fully electric and plug-in hybrid cars on the world’s roads passed the 3 million mark in November 2017."
- EVvolumes.com (January 2018). "Global Plug-in Sales for 2017-Q4 and the Full Year (prelim.)". EVvolumes.com. Retrieved 2018-02-17. Global registrations totaled around 1.2 million units in 2017, 57 % higher than 2016. These include all global BEV and PHEV passenger cars sales, light trucks in USA/Canada and light commercial vehicle in Europe. The segment market share was 1.3%, and in December the global plug-in share touched the 2 % mark for the first time.
- Jose, Pontes (2020-01-31). "Global Top 20 - December 2019". EVSales.com. Retrieved 2020-05-10. "Global sales totaled 2,209,831 plug-in passenger cars in 2019, with a BEV to PHEV ratio of 74:26, and a global market share of 2.5%. The world's top selling plug-in car was the Tesla Model 3 with 300,075 units delivered, and Tesla was the top selling manufacturer of plug-in passenger cars in 2019 with 367,820 units, followed by BYD with 229,506."
- Hertzke, Patrick; Müller, Nicolai; Schenk, Stephanie; Wu, Ting (May 2018). "The global electric-vehicle market is amped up and on the rise". McKinsey & Company. Retrieved 2019-01-27. See Exhibit 1: Global electric-vehicle sales, 2010-17.
- Cobb, Jeff (2016-12-27). "China Takes Lead As Number One In Plug-in Vehicle Sales". HybridCars.com. Retrieved 2017-01-06. As of November 2016, cumulative sales of plug-in vehicles in China totaled 846,447 units, including passenger and commercial vehicles, making it the world's leader in overall plug-in vehicle sales. With cumulative sales of about 600,000 passenger plug-ins through November 2016, China is also the global leader in the passenger plug-in car segment, ahead of Europe and the U.S.
- King, Danny (2016-12-29). "China far ahead of US, Europe in total electric vehicle sales". Autoblog.com. Retrieved 2017-01-08.
Last year, China overtook both the US and Europe in annual sales of electric vehicles and plug-in hybrids. This year, it will move ahead of both the US and Europe in cumulative plug-in vehicle sales.
- Dale Hall, Hongyang Cui, Nic Lutsey (2018-10-30). "Electric vehicle capitals: Accelerating the global transition to electric drive". The International Council on Clean Transportation. Retrieved 2018-11-01.CS1 maint: multiple names: authors list (link) Click on "Download File" to get the full report, 15 pp.
- Norwegian Road Federation (OFV) (2019-01-02). "Bilsalget i 2018" [Car sales in 2018] (in Norwegian). OFV. Retrieved 2019-01-09.
- Opplysningsrådet for Veitrafikken AS (OFV). "Bilsalget i 2017" [Car sales in 2017] (in Norwegian). OFV. Retrieved 2017-01-10.
- Cobb, Jeff (2017-01-17). "Top 10 Plug-in Vehicle Adopting Countries of 2016". HybridCars.com. Retrieved 2017-01-18.
- Jeff Cobb (2015-02-18). "Top 6 Plug-In Vehicle Adopting Countries – 2014". HybridCars.com. Retrieved 2015-02-18. A total of 303,866 new passenger vehicles were registered in 2014, and a total of 4,656 super clean cars, resulting in a PEV market share of 1.53% of new car sales.
- Jose, Pontes (2019-01-17). "Iceland December 2018". EVSales.com. Retrieved 2019-01-17.
- Jose, Pontes (2018-01-23). "Iceland December 2017". EVSales.com. Retrieved 2018-02-18.
- Bil Sweden (2019-01-07). "Nyregistreringar december 2018 (def)" [Definitive new registrations December 2018 (final)] (in Swedish). Bil Sweden. Retrieved 2018-01-20. Download the pdf file "PressRel1812_DEF.pdf" See tables: "Nyregistrerade supermiljöbilar december 2018", "Nyregistrerade miljöbilar per typ december 2018" and "Nyregistrerade eldrivna lätta lastbilar (högst 3,5 ton) per modell" Passenger car registrations totaled 379,393 units in 2017, of which, the plug-in segment captured a market share of 8.2%.
- Bil Sweden (2018-01-08). "Definitiva nyregistreringar under 2017" [Definitive new registrations in 2017] (in Swedish). Bil Sweden. Retrieved 2018-01-31. Download the pdf file "PressRel1712_DEF.pdf" See tables: "Nyregistrerade supermiljöbilar december 2017", "Nyregistrerade miljöbilar per typ december 2017" and "Nyregistrerade eldrivna lätta lastbilar (högst 3,5 ton) per modell"
- Jose, Pontes (2017-01-31). "Markets Roundup December 2016 (Special Edition)". EVSales.com. Retrieved 2017-02-08. For countries with top PEV market share in 2016 see "II. Engines of Growth: By EV share - Hong Kong ~5%, Iceland 4.6%, Switzerland 1.8%, Belgium 1.8, and 1.6% Austria.
- Jose, Pontes (2016-02-03). "Markets Roundup December 2015 (Special Edition)". EVSales.com. Retrieved 2016-02-17. For countries with top PEV market share in 2015 see "Engines of Growth:" Hong Kong 4.84%, Denmark 2.29%, Sweden 2.62%, and Switzerland 1.98%.
- California New Car Dealers Association (CNCDA) (February 2018). "New Vehicle Registrations in State Predicted to Exceed 2 Million Units Again in 2018" (PDF). CNCDA. Archived from the original (PDF) on 2018-02-17. Retrieved 2018-02-17. Registrations through December 2017 since 2013.
- California New Car Dealers Association (CNCDA) (November 2018). "New Vehicle Registrations in State To Approach 2 million Unit Mark in 2018" (PDF). CNCDA. Retrieved 2018-11-24. Registrations through September 2018 since 2014.
- "Elektrisch Rijden – Personenauto's en laadpunten Analyse over 2018" [Electric Driving - Passenger cars and charging points - Analysis for 2018] (PDF). Rijksdienst voor Ondernemend Nederland (RVO) - Dutch National Office for Enterprising - (in Dutch). RVO. January 2019. Retrieved 2020-05-11. As of 31 December 2018, there were 145,882 highway legal light-duty plug-in electric vehicles registered in the Netherlands, consisting of 97,702 plug-in hybrids, 44,984 pure electric cars, and 3,196 all-electric light utility vans. With a total of 24,273 Mitsubishi Outlander P-HEVs registered by the end of December 2018, the plug-in hybrid is the all-time top selling plug-in electric vehicle in the Netherlands. The Tesla Model S is the best selling all-electric car with 12,990 units registered.
- Jose, Pontes (2016-01-29). "Iceland December 2015". EVSales.com. Retrieved 2016-02-17. Plug-in electric car sales in Iceland reached a market share of 2.93%f of new car sales in 2015.
- Liu Wanxiang (2017-01-12). "中汽协:2016年新能源汽车产销量均超50万辆,同比增速约50%" [China Auto Association: 2016 new energy vehicle production and sales were over 500,000, an increase of about 50%] (in Chinese). D1EV.com. Retrieved 2017-01-12. Chinese sales of new energy vehicles in 2016 totaled 507,000, consisting of 409,000 BEV vehicles and 98,000 PHEVs.
- Automotive News China (2018-01-16). "Electrified vehicle sales surge 53% in 2017". Automotive News China. Retrieved 2018-01-19. Chinese sales of domestically-built new energy vehicles in 2017 totaled 777,000, consisting of 652,000 all-electric vehicles and 125,000 plug-in hybrid vehicles. Sales of domestically-produced new energy passenger vehicles totalled 579,000 units, consisting of 468,000 all-electric cars and 111,000 plug-in hybrids. Only domestically built all-electric vehicles, plug-in hybrids and fuel cell vehicles qualify for government subsidies in China.
- "中汽协:2018年新能源汽车产销均超125万辆,同比增长60%" [China Automobile Association: In 2018, the production and sales of new energy vehicles exceeded 1.25 million units, a year-on-year increase of 60%] (in Chinese). D1EV.com. 2019-01-14. Retrieved 2019-01-15. Chinese sales of new energy vehicles in 2018 totaled 1.256 million, consisting of 984,000 all-electric vehicles and 271,000 plug-in hybrid vehicles.
- Kane, Mark (2020-02-04). "Chinese NEVs Market Slightly Declined In 2019: Full Report". InsideEVs.com. Retrieved 2020-05-30. Sales of new energy vehicles totaled 1,206,000 units in 2019, down 4.0% from 2018, and includes 2,737 fuel cell vehicles. Battery electric vehicle sales totaled 972,000 units (down 1.2%) and plug-in hybrid sales totaled 232,000 vehicles (down 14.5%). Sales figures include passenger cars, buses and commercial vehicles..
- Dune, Michael J. (2016-12-14). "China's Automotive 2030 Blueprint: No. 1 Globally In EVs, Autonomous Cars". Forbes. Retrieved 2016-12-14.
- Majeed, Abdul (2016-09-29). "China faces acid test in vehicle emissions". Business Line. Retrieved 2016-09-29.
- "Top 10 NEV Models by 2017 Sales". Gasgoo China Automotive News. 2018-01-18. Retrieved 2019-01-15. Sales of the BAIC EC series totaled 78,079 cars in 2018 and ranked as China's top selling plug-in car.
- "China's new energy PV wholesale volume in 2018 shoots up 83% year on year". Gasgoo. 2019-01-11. Retrieved 2019-01-21. Sales of new energy passenger cars totaled 1,016,002 units in 2018.The BAIC EC series ranked as China's top selling plug-in car in 2018 with 90,637 units delivered.
- Kane, Mark (2019-01-24). "US Plug-In Electric Car Sales Charted: December 2018". InsideEVs. Retrieved 2019-01-24. See Graph: "Top 10 U.S. Plug-in cars (cumulative sales)" and "U.S. Plug-in Car Sales (cumulative)"
- Loveday, Steven (17 January 2020). "FINAL UPDATE: Quarterly Plug-In EV Sales Scorecard". InsideEVs.com. Retrieved 8 May 2020. See Chart: "2019 Monthly/Q4 Sales Chart : Annual" - Cumulative sales in the U.S. totaled 329,528 units in 2019, and the top selling models were the Tesla Model 3 with 158,925 units, the Toyota Prius Prime with 23,630, The Tesla Model X with 19,225, the Chevrolet Bolt EV with 16,418 and the Tesla Model S with 14,100 units.
- Szczesny, Joseph (2018-12-11). "Sales of Electric Vehicles Growing Steadily in California". The Detroit Bureau. Retrieved 2018-12-13.
- "California EV Sales Top 500,000". VELOZ. Environmental Protection Online. 2018-12-11. Retrieved 2018-12-13.
- California New Car Dealers Association (CNCDA) (February 2020). "California Auto Outlook Covering Fourth Quarter 2019: State New Vehicle Market Predicted to Remain Strong in 2020" (PDF). CNCDA. Retrieved 2020-05-10. See section: "Hybrid Vehicle Market Share Increased to 5.5 Percent in 2019 " - registrations between 2015 and 2019. Figures for 2018 were revised.
- Cobb, Jeff (2017-01-05). "December 2016 Dashboard". HybridCars.com and Baum & Associates. Retrieved 2016-12-06. Plug-in electric car sales in the U.S. totaled 157,181 units, consisting of 84,246 all-electric cars and 72,935 plug-in hybrids. The plug-in car segment achieved a market share of 0.90% of new car sales. December sales totaled 23,288 units with a market share of 1.39%. The top selling model in 2016 was the Tesla Model S with 29,156 units sold, followed by the Chevrolet Volt(24,739) and the Tesla Model X (18,028).
- Steven Loveday (2019-01-07). "December 2018 U.S. EV Sales Recap: Over 360K Secured!". Inside EVs. Retrieved 2019-01-20.
- Cobb, Jeff (2016-01-06). "December 2015 Dashboard". HybridCars.com and Baum & Associates. Retrieved 2016-02-13. Plug-in electric car sales in the U.S. totaled 114,248 units in 2015, consisting of 71,105 all-electric cars and 43,143 plug-in hybrids, with corresponding market shares of 0.25% and 0.41%. Sales in 2014 totaled 123,347 units.
- Jeff Cobb (2013-01-08). "December 2012 Dashboard". HybridCars.com and Baum & Associates. Retrieved 2013-01-14. See the section: December 2012 Plug-in Electric Car Sales Numbers. A total of 53,172 plug-in electric vehicles were sold during 2012. Sales of the Fisker Karma, Coda and Wheego are not included, as these carmakers do not report monthly sales on a regular basis.
- Cobb, Jeff (2018-01-04). "December 2017 Dashboard". HybridCars.com and Baum & Associates. Retrieved 2018-01-21. The plug-in car segment achieved a market share of 1.13% of new car sales in 2017.
- Irle, Roland. "USA Plug-in Sales for 2018 Full Year". EV-volumes.com. Retrieved 2019-01-20.
- Kane, Mark (2020-01-11). "The Top 10 Plug-In Electric Cars In U.S. - 2019 Edition". InsideEVs.com. Retrieved 2020-05-19. At the end of 2019, the all-time top selling plug-in cars in the U.S. were the Tesla Model 3 with 300,471 units, Tesla Model S with 157,992, Chevrolet Volt with 157,054 units, Nissan Leaf with 141,907 and the Toyota Prius PHV with 109,003 (by September 2019).
- "Nissan LEAF sales surpass 100,000 in Japan" (Press release). Yokohama: Nissan. 2018-04-20. Retrieved 2018-12-02.
- Kane, Mark (2016-04-02). "Plug-In Electric Car Sales Visualized From 2011 to 2015". InsideEVs.com. Retrieved 2016-06-19.
- Jose Pontes (2018-02-02). "Japan December 2017". EV Sales. Retrieved 2018-02-17. About 56,000 plug-in electric cars were sold in Japan in 2017.
- Pontes, Jose (2019-01-29). "Japan December 2018". EVSales.com. Retrieved 2019-02-01. A total of 52,013 plug-in cars were sold in Japan in 2018, with a market share of 1.0%. The Nissan Leaf was the top selling plug-in model with 25,722 units, followed by the Prius PHEV with 12,401 units.
- Shirouzu, Norihiko; Lienert, Paul (2015-10-28). "Auto power play: Japan's hydrogen car vs China's battery drive". Reuters. Retrieved 2016-06-19.
- Deign, Jason (2015-02-10). "Japan Makes a Big Bet on the Hydrogen Economy". Green Tech Media. Retrieved 2016-06-19.
- France Mobilité Électrique - AVERE France (2020-06-09). "Baromètre mensuel : en mai, les immatriculations de voitures électriques et hybrides rechargeables sont en hausse de + 61 % malgré la crise" [Monthly barometer: in May, registrations of electric and plug-in hybrid cars were up + 61% despite the crisis] (in French). AVERE France. Retrieved 2020-05-21. See infograh "Inmatriculations de Véhicules Electrifiés Neufs Union Europeenne + AELE - Janvier-Avril 2020" - As of April 2020, there were 1,117,330 all-electric vehicles and 910,525 plug-in hybrids in circulation in Europe (total in use is 2,027,855 light-duty plug-in electric vehicles).
- LeSage, Jon (2016-02-06). "Renault Zoe Ekes By Mitsubishi Outlander in 2016 European Plug-in Sales". HybridCars.com. Retrieved 2017-02-06.
- France Mobilité Électrique - AVERE France (2020-02-11). "En Europe, les ventes de voitures électriques en hausse de 80 % en 2019" [In Europe, sales of electric cars up 80% in 2019] (in French). AVERE. Retrieved 2020-05-16.
- Bratzel, Stefan (2019-01-16). "E-Mobility 2019: An International Comparison of Important Automotive Markets" (PDF). Center of Automotive Management. Bergisch Gladbach. Retrieved 2019-01-21.
- Norsk Elbilforening (Norwegian Electric Vehicle Association) (January 2020). "Norwegian EV market". Norsk Elbilforening. Retrieved 2020-05-08. Place the pointing device over the graph to show the cumulative number of electric vehicles and plug-in hybrids in Norway at the end of each year. As of 31 December 2019, the registered light-duty plug-in electric stock totaled 384,066 units, consisting of 268,024 battery electric vehicles and 116,042 plug-in hybrids.
- Norsk Elbilforening (Norwegian Electric Vehicle Association) (2017-01-05). "Elbilsalget: Ned i fjor – venter ny vekst i år" [EV Sales: Down from last year - awaiting new growth this year] (in Norwegian). Norsk Elbilforening. Retrieved 2017-01-18.
- Norwegian Road Federation (OFV) (January 2020). "Bilsalget i 2019" [Car sales in 2019] (in Norwegian). OFV. Retrieved 2020-02-10.
- Klippenstein, Matthew (2014-04-08). "One Percent Of Norway's Cars Are Already Plug-In Electrics". Green Car Reports.
- Figenbaum, Erik; Kolbenstvedt, Marika (June 2016). "Learning from Norwegian Battery Electric and Plug-in Hybrid Vehicle users". Institute of Transport Economics (TØI), Norwegian Centre for Transport Research. Retrieved 2016-08-17. TØI report 1492/2016. See pp. 1.
- Alister Doyle & Nerijus Adomaitis (2013-03-13). "Norway shows the way with electric cars, but at what cost?". Reuters. Retrieved 2013-03-15.
- Joly, David (2015-10-16). "Norway is A Model For Encouraging Electric Car Sales". The New York Times. Retrieved 2016-02-16.
- Agence France-Presse (2011-05-15). "Electric cars take off in Norway". The Independent. Retrieved 2011-10-09.
- AVERE (2012-06-07). "Norwegian Parliament extends electric car initiatives until 2018". AVERE. Archived from the original on 2013-10-24. Retrieved 2012-07-20.
- Kane, Mark (2015-01-26). "Electric Car Sales In Germany Hit New High In December 2014". InsideEVs.com. Retrieved 2015-01-31.
- Pontes, Jose (2017-01-16). "Germany December 2016 (Updated)". EVSales.com. Retrieved 2018-01-14.
- Kraftfahrt-Bundesamtes (KBA) (2018-01-12). "Neuzulassungsbarometer im Dezember 2017" [New Registrations Barometer December 2017] (in German). KBA. Retrieved 2018-01-12. A total of 29,436 plug-in hybrids and 25,056 all-electric cars were registered in Germany in 2017.
- Kraftfahrt-Bundesamt (KBA) (January 2019). "Neuzulassungsbarometer im Dezember 2018" [New registration barometer in December 2018] (in German). KBA. Retrieved 2019-01-15. Click on the tab Kraftstoffarten for the market shares by fuel: Electric was 1.0% in 2018, and plug-in hybrid was 0.9%
- Kraftfahrt-Bundesamtes (KBA) (January 2020). "Neuzulassungsbarometer im Dezember 2019" [New Registrations Barometer December 2019] (in German). KBA. Retrieved 2019-05-14. See the tab Kraftsoffarten: A total of 45,348 plug-in hybrids (market share 1.3%) and 63,321 all-electric cars (market share 1.8%) were registered in Germany in 2019.
- Lane, Ben (May 2020). "Electric car market statistics". UK: Next Green Car. Retrieved 2020-05-12.
- Society of Motor Manufacturers and Traders(SMMT) (2014-01-07). "December 2013 – EV registrations". SMT. Retrieved 2014-01-12. A total of 2,254 plug-in electric cars were registered in 2013.
- Society of Motor Manufacturers and Traders (SMMT) (2018-01-05). "December – EV registrations". SMMT. Retrieved 2018-01-11.Registrations in 2017 totaled 47,263 plug-in electric vehicles consisting of 13,597 all-electric cars and 33,6663 plug-in hybrids. Of these, a total of 45,187 cars were eligible for the Plug-in Car Grant. Since its launch in 2011, a total of 127,509 cars eligible for the PICG have been registered through December 2017. A total of 2,540,617 new cars were registered in 2017, resulting in a plug-in electric car market share of 1.86% of new car sales.
- Society of Motor Manufacturers and Traders (SMMT) (2019-01-07). "December – EV registrations". SMMT. Retrieved 2019-01-17.Registrations in 2018 totaled 59,911 plug-in electric vehicles consisting of 15,474 all-electric cars and 44,437 plug-in hybrids. A total of 2,367,147 new cars were registered in 2018, resulting in a plug-in electric car market share of 2.53% of new car sales.
- Society of Motor Manufacturers and Traders(SMMT) (2015-01-07). "December 2014 – EV registrations". SMT. Retrieved 2015-01-08. A total of 14,518 plug-in electric cars were registered during 2014, consisting of 6,697 pure electrics and 7,821 plug-in hybrids, up from 3,586 plug-in electric cars were registered in 2013. A total of 2,476,435 new cars were registered in 2014.
- Kane, Mark (2020-07-03). "Renault EV Sales In France Is Booming: 17,650 ZOE Sold In H1 2020". InsideEVs.com. Retrieved 2020-07-20.
- France Mobilité Électrique - AVERE France (2020-07-08). "Baromètre mensuel : un mois de juin 2020 record pour les immatriculations de véhicules électriques et hybrides rechargeables" [Monthly barometer: a record June 2020 for electric and plug-in hybrid vehicle registrations] (in French). AVERE France. Retrieved 2020-07-19. See infograh "Parc Roulant et Immatriculations Annuelles depuis Janvier 2010" - As of June 2020, there were 344,725 plug-in electric cars and utility vans, consisting of 267,120 all-electric cars and vans, and 77,605 plug-in hybrids registered since 2010.
- Autoactu.com (May 2016). "Chiffres de vente & immatriculations de voitures électriques en France" [Sales figures & electric car registrations in France] (in French). Automobile Propre. Retrieved 2016-05-14. See "Ventes de voitures électriques en 2016/2015, 2014, 2013, 2012, 2011 and 2010" It shows all electric car registrations between 2010 and 2016.
- Yoann Nussbaumer (2013-01-16). "+115% pour les ventes de voitures électriques en France pour 2012" [Electric car sales in France increased 115% in 2011] (in French). Automobile Propre. Retrieved 2015-02-03.
- France Mobilité Électrique – AVERE France (2016-01-08). "Immatriculations des hybrides rechargeables : La barre des 5.000 est franchie !" [Plug-in hybrid registrations: The 5,000 barrier is achieved!] (in French). AVERE. Retrieved 2016-05-14. A total of 5,006 plug-in hybrids were registered in France in 2015.
- France Mobilité Électrique - AVERE France (2019-01-09). "Baromètre annuel : près de 40 000 véhicules électriques immatriculés en France en 2018 !" [Annual barometer: nearly 40,000 electric vehicles registered in France in 2018!] (in French). AVERE. Retrieved 2019-01-18. A total of 53,745 light-duty plug-in electric vehicles were registered in France in 2018 consisting of 31,055 all-electric cars plus 1,148 REx vehicles, 8,103 electric utility vans, and 13,439 plug-in hybrid cars. The plug-in car segment achieved a market share of 2.1% of new car registrations in the country in 2018. Includes revised figures for 2017
- Jose, Pontes (2020-07-14). "France June 2020". EVSales.com. Retrieved 2020-07-19.
- Automobile Propre (August 2016). "Chiffres de vente & immatriculations d'utilitaires électriques en France" [Sales figures & electric utility van registrations in France] (in French). Automobile Propre. Retrieved 2016-10-02. See "Ventes d’utilitaires électriques en 2016/2015/2014 for all-electric utility van registrations. Light-duty electric vehicles reached a 1.22% market share of new van sales in the country in 2014, and rose to 1.30% in 2015.
- "Statistics Electric Vehicles in the Netherlands (up to and including March 2020)" (PDF). Rijksdienst voor Ondernemend Nederland (RVO) - Dutch National Office for Enterprising -. RVO. April 2020. Retrieved 2020-05-12. As of 31 March 2020, there were 218,501 highway-legal light-duty plug-in electric vehicles registered in the Netherlands, consisting of 116,148 pure electric cars, 97,553 plug-in hybrids, and 4,800 all-electric light utility vans. Includes figures for 2018
- Cobb, Jeff (2016-09-01). "Americans Buy Their Half-Millionth Plug-in Car: Concentration of plug-in electrified car registrations per 1,000 people". HybridCars.com. Retrieved 2016-09-04. As of July 2016, Norway had a concentration of registered plug-in cars per 1,000 people of 21.52, the Netherlands of 5.63, California of 5.83, and the United States national average was 1.52.
- Cobb, Jeff (2016-05-09). "Norway Is Fourth Country To Register 100,000 Plug-in Cars". HybridCars.com. Retrieved 2016-05-09. As of April 2016, the United States is the leading country market with a stock of about 450,000 highway legal light-duty plug-in electric vehicles delivered since 2008. China ranks second with around 300,000 units sold since 2011, followed by Japan with about 150,000 plug-in units sold since 2009, both through March 2016. European sales are led by Norway with over 100,000 units registered by the end of April 2016.
- Gauthier, Michael (2020-02-19). "European Car Sales Climbed To 15.7 Million Units Last Year, Tesla Model 3 Is The EV Champion". Carscoops. Retrieved 2020-05-16. Sales of the Tesla Model 3 in Europe totaled 94,495 units in 2019 (Europe 23) and topped sales in the region in the EV segment.
- Musk, Jonathan (2019-12-19). "Nissan drops Leaf pricing". Fleet World. Retrieved 2020-05-19.
With almost 440,000 sold since 2010, the model remains the world’s best-selling electric vehicle, and also in the UK where it has received more than 32,000 orders. European sales currently stand at 150,000, the company said.
- Kane, Mark (2020-03-06). "Nissan LEAF Sales In Japan Finally Surge To Almost 3,000". InsideEVs.com. Retrieved 2020-05-19.
Cumulative LEAF sales in Japan is approaching 140,000
- "Cumulative EV registrations by Make and Model". Elbil Statistikk. 2020-05-17. Retrieved 2020-05-19.
- Martin Kynningsrud Størbu (2019-01-14). "Elbil-boom i Norge: Nå er det over 200.000 elbiler i Norge" [Electric car boom in Norway: Now there are over 200,000 electric cars in Norway] (in Norwegian). Dinside.no. Retrieved 2019-02-02. By the end of 2018, Nissan Leaf registrations in Norway totaled 49,823 units, making the Leaf the most popular plug-in electric car in the country.
- Cobb, Jeff (2018-01-22). "Tesla Quietly Sold 200,000th Model S Last Year". HybridCars.com. Retrieved 2018-01-22. "Tesla sold its 200,000 Model S in the fourth quarter of 2017, in October or early November, becoming the second plug-in car to cross this sales threshold after the Nissan Leaf (300,000 units by early 2017). As of December 2017, Tesla reported global sales of 212,874 Model S cars."
- "Tesla Q1 2018 Vehicle Production and Deliveries". Palo Alto: Tesla. 2018-04-03. Retrieved 2018-09-02. Q1 deliveries totaled 11,730 Model S cars and 10,070 Model X.
- "Tesla Second Quarter 2018 Delivery". Palo Alto: Tesla. 2018-07-02. Retrieved 2018-09-02. Q2 deliveries totaled 10,930 Model S cars and 11,370 Model X.
- "Tesla Q3 2018 Vehicle Production and Deliveries". Palo Alto: Tesla. 2018-10-02. Retrieved 2018-10-20. Q3 deliveries totaled 55,840 Model 3 cars, 14,470 Model S, and 13,190 Model X.
- "Tesla Fourth Quarter 2018 Delivery". Palo Alto: Tesla. 2019-01-05. Retrieved 2019-01-07.
Q4 deliveries grew to 90,700 vehicles, which was 8% more than our prior all time-high in Q3. This included 63,150 Model 3 (13% growth over Q3), 13,500 Model S, and 14,050 Model X vehicles. In 2018, we delivered a total of 245,240 vehicles: 145,846 Model 3 and 99,394 Model S and X.
- Groupe Renault (January 2017). "Ventes Mensuelles" [Monthly Sales] (in French). Renault.com. Retrieved 2017-01-18. Includes passenger and light utility variants. Click on "(décembre 2016)" to download the file "XLSX - 239 Ko" for CYTD sales in 2016, and open the tab "Sales by Model". Click on "+ Voir plus" (See more) to download the files "Ventes mensuelles du groupe (décembre 2011) (xls, 183 Ko)" "Ventes mensuelles (décembre 2012) (xls, 289 Ko)" - Ventes mensuelles (décembre 2013) (xlsx, 227 Ko)" - "XLSX - 220 Ko Ventes mensuelles (décembre 2014)" - "Ventes mensuelles (décembre 2015)" to download the file "XLSX - 227 Ko" for 2011, 2012, 2013, 2014 and 2015 sales. Sales figures for 2013 were revised in the 2014 report
- Groupe Renault (January 2019). "Ventes Mensuelles - Statistiques commerciales mensuelles du groupe Renault" [Monthly Sales - Monthly sales statistics of the Renault Group] (in French). Renault.com. Retrieved 2019-01-20. Sales figures includes passenger and light utility variants. Click on link "XLSX - 142 Ko Ventes mensuelles du Groupe (Décembre 2018)" to download the file, and open the tab "Sales by Model" to access sales figures for 2017 and 2018.
- Groupe Renault (April 2020). "Ventes Mensuelles - Statistiques commerciales mensuelles du groupe Renault" [Monthly Sales - Monthly sales statistics of the Renault Group] (in French). Renault.com. Retrieved 2020-05-19. Sales figures includes passenger and light utility variants. Click on the corresponding link to download the file, and open the tab "Sales by Model" to access sales figures for 2017, 2018, 2019 and 2020 CYTD.
- "Investor Communication: Tesla Q1 2020 Update". Investor relations (Press release). Tesla, Inc. 2020-04-29. Retrieved 2020-05-16.
Model 3/Y Production 87,282 Deliveries 76,266 (1Q 2020)
Includes updated production and sales figures from 1Q 2019 through 1Q 2020. - "Tesla Fourth Quarter & Full Year 2018 Update". Palo Alto: Tesla. 2019-01-30. Retrieved 2019-01-30.
In Q4, we delivered 63,359 Model 3 vehicles to customers in North America.
- "_Update_Letter_2017-3Q.pdf Tesla Third Quarter 2017 Update". Tesla. 2017-11-01. Archived from the original on 2018-01-11. Retrieved 2018-05-27.
In Q3, we delivered 25,915 Model S and Model X vehicles and 222 Model 3 vehicles, for a total of 26,137 deliveries
- "Tesla Fourth Quarter & Full Year 2017 Update" (PDF). Tesla (Press release). Palo Alto: Tesla. 2017-02-07. Archived from the original (PDF) on 2018-02-08. Retrieved 2018-10-20. A total of 1,542 Model 3 vehicles were delivered in Q4 2018.
- "The "E" side of EV: Nissan brings excitement from the road to the track with LEAF Nismo RC unleashed for the first time in Europe" (Press release). Valencia, Spain: Nissan Europe. 2020-01-20. Retrieved 2020-05-16.
- Zentrum für Sonnenenergieund Wasserstoff-Forschung Baden-Württemberg (ZSW) (2020-02-26). "ZSW analysis shows global number of EVs at 7.9 million". electrive.com. Retrieved 2020-05-17. See table: Global cumulative EV registrations (by models)
- "BAIC Beijing EC180". Carsalesbase.com. January 2019. Retrieved 2019-01-28. Sales of the BAIC EC series totaled 4,128 units in 2016, 78,079 in 2017 and 90,637 in 2018.
- "Six years of BMW i3: Electric vehicle pioneers drive over 200,000 km in their BMW i3" (Press release). Munich: BMW Group. 2020-02-01. Retrieved 2020-05-17.
Since its market launch, the BMW i3 has been the most widely sold electric vehicle in the premium compact segment with more than 165,000 units already sold worldwide
- Tesla, Inc. (2017-04-02). "Tesla Q1 2017 Vehicle Production and Deliveries" (Press release). Palo Alto: Market Wired. Retrieved 2018-05-26.
Tesla (NASDAQ: TSLA) delivered just over 25,000 vehicles in Q1, of which approx 13,450 were Model S and approx 11,550 were Model X.
- "UPDATE - Tesla Q2 2017 Vehicle Production and Deliveries (NASDAQ:TSLA)". ir.tesla.com. Retrieved 2017-09-28.
- "Telsa Production Q3 2017". Retrieved 2018-05-26.
- Tesla, Inc. (2018-01-03). "Tesla Q4 2017 Vehicle Production and Deliveries" (Press release). Palo Alto: Market Wired. Retrieved 2018-05-26.
Tesla (NASDAQ: TSLA) delivered 29,870 vehicles, of which 15,200 were Model S, 13,120 were Model X, and 1,550 were Model 3
- "Mitsubishi Outlander PHEV Hits 200,000 Global Sales Milestones" (Press release). Tokyo: Mitsubishi Motors Corporation (MMC). 2019-04-11. Retrieved 2019-04-12.
- Kane, Mark (2019-03-13). "Outlander PHEV Is Best-Selling Mitsubishi In Europe". InsideEVs.com. Retrieved 2019-04-12.
- "New (MY19) Mitsubishi Outlander PHEV - Summer 2018" (PDF) (Press release). Mitsubishi Motors. 2018. Retrieved 2018-10-29. See tables in pp. 3-4.
- "Toyota sells 1.52 million electrified vehicles in 2017, three years ahead of 2020 target" (Press release). Toyota City, Japan: Toyota. 2018-02-02. Retrieved 2018-10-29.
- Kane, Mark (2019-01-25). "Top 3 Plug-In Hybrid Cars In U.S. In 2018: Prius Prime, Clarity, Volt". InsideEVs.com. Retrieved 2019-01-27. The Chevrolet Volt is the best selling plug-in electric car in the U.S. with 152,144 units sold through the end of 2018. American sales totaled 20,349 units in 2017 and 18,306 in 2018. Combined sales of both generations of the Toyota Prius plug-in hybrid totaled more than 93,000 units
- "46% of Toyota Motor Europe (TME) sales in H1 are self-charging hybrid electric vehicles" (Press release). Brussels: Toyota Europe Newsroom. 2018-07-11. Retrieved 2019-02-01. Toyota sold 1,693 Prius PHEV during the first half of 2018.
- Cobb, Jeff (2017-01-09). "Nissan's Quarter-Millionth Leaf Means It's The Best-Selling Plug-in Car In History". HybridCars.com. Retrieved 2017-01-10. As of December 2016, the Nissan Leaf is the world's best-selling plug-in car in history with more than 250,000 units delivered, followed by the Tesla Model S with over 158,000 sales, and the Volt/Ampera family of vehicles with 134,500 vehicles sold.
- "Chevrolet Volt Sales Numbers". GM Authority. January 2019. Retrieved 2019-02-01. Canadian sales totaled 4,313 units in 2017 and 4,114 in 2018 through November.
- Cain, Timothy (October 2018). "Chevrolet Volt Sales Figures". Good Car Bad Car. Retrieved 2018-12-01.
- "Buick Velite 5 ( Chinese Car Sales Data)". Car Sales Base. Retrieved 2019-02-01. Buick Velite 5 sales in China totaled 1,629 units in 2017 and 2,688 in 2018.
- Cobb, Jeff (2016-12-12). "Chevy Volt and Nissan Leaf Celebrate Their Sixth-Year Anniversary". HybridCars.com. Retrieved 2016-12-14. Global cumulative sales of plug-in electric vehicles totaled about 1.9 million units through November 2016. The Nissan Leaf is the world's leading plug-in car with more than 240,000 units delivered. As of November 2016, the Tesla Model S ranks next with over 151,000, followed by the Vollt/Ampera family of vehicles with 130,500 vehicles sold including over 10,000 Opel/Vauxhall Amperas sold in Europe, the Mitsubishi Outlander PHEV with about 116,500 units, and the Toyota Prius PHV with about 76,200.
- Kane, Mark (2018-01-26). "BYD #1 In World For Plug-In Electric Car Sales In 2017, Beats Tesla Again". InsideEVs.com. Retrieved 2018-10-31. During 2017, BYD Qin sales totaled 20,738 units and BYD Tang totaled 14,592 units.
- Staff (2017-01-19). "Best-selling China-made EVs in 2016". China Auto Web. Retrieved 2017-01-25. Three BYD Auto models topped the Chinese ranking of best-selling new energy passenger cars in 2016. The BYD Tang SUV was the top selling plug-in electric car in China in 2016 with 31,405 units sold, followed by the BYD Qin with 21,868 units sold, and ranking third overall in 2016 was the BYD e6 with 20,605 units.
- Staff (2016-02-13). "Best-selling China-made SUVs in 2015". China Auto Web. Retrieved 2016-01-17. A total of 18,375 Tangs were sold in China in 2015.
- Staff (2016-02-11). "Opel bringt 2017 neues Elektroauto" [Opel brings new electric car in 2017]. Autohaus.de (in German). Retrieved 2019-02-01. About 10,000 Opel Amperas were sold in Europe by the end of 2015.
- Jeff Cobb (2015-11-04). "GM Sells Its 100,000th Volt in October". HybridCars.com. Retrieved 2015-11-04.About 102,000 units of the Volt/Ampera family have been sold worldwide by the end of October 2015.
- Mike Costello (2015-04-25). "The Holden Volt is dead". Car Advice. Retrieved 2019-02-01.
External links
- Application of Life-Cycle Assessment to Nanoscale Technology: Lithium-ion Batteries for Electric Vehicles, U.S. Environmental Protection Agency, April 2013.
- Clean Vehicle Rebate Project website
- Competitive Electric Town Transport, Institute of Transport Economics (TØI), Oslo, August 2015.
- Cradle-to-Grave Lifecycle Analysis of U.S. Light-Duty Vehicle-Fuel Pathways: A Greenhouse Gas Emissions and Economic Assessment of Current (2015) and Future (2025–2030) Technologies (includes BEVs and PHEVs), Argonne National Laboratory, June 2016.
- Driving Electrification – A Global Comparison of Fiscal Incentive Policy for Electric Vehicles, International Council on Clean Transportation, May 2014.
- Effects of Regional Temperature on Electric Vehicle Efficiency, Range, and Emissions in the United States, Tugce Yuksel and Jeremy Michalek, Carnegie Mellon University. 2015
- eGallon Calculator: Compare the costs of driving with electricity, U.S. Department of Energy
- Electric Vehicle Timeline: Electric Cars, Plug-In Hybrids, and Fuel Cell Vehicles (1900–2014), Union of Concerned Scientists
- EV Everywhere Grand Challenge Blueprint, U.S. Department of Energy, January 2013.
- From Fiction to Reality: The Evolution of Electric Vehicles 2013 – 2015, JATO Dynamics, November 2015.
- Global EV Outlook 2013– Understanding the Electric Vehicle Landscape to 2020, International Energy Agency (IEA), April 2013
- Hybrid and Electric Vehicles – The Electric Drive Gains Traction, IA-HEV, International Energy Agency (IEA), May 2013
- Influence of driving patterns on life cycle cost and emissions of hybrid and plug-in electric vehicle powertrains, Carnegie MellonVehicle Electrification Group
- Modernizing vehicle regulations for electrification, International Council on Clean Transportation, October 2018.
- NHTSA Interim Guidance Electric and Hybrid Electric Vehicles Equipped with High Voltage Batteries – Vehicle Owner/General Public
- NHTSA Interim Guidance Electric and Hybrid Electric Vehicles Equipped with High Voltage Batteries – Law Enforcement/Emergency Medical Services/Fire Department
- New Energy Tax Credits for Electric Vehicles purchased in 2009
- Overview of Tax Incentives for Electrically Chargeable Vehicles in the E.U.
- PEVs Frequently Asked Questions
- Plug-in Electric Vehicles: Challenges and Opportunities, American Council for an Energy-Efficient Economy, June 2013
- Powering Ahead – The future of low-carbon cars and fuels, the RAC Foundation and UK Petroleum Industry Association, April 2013.
- Plugging In: A Consumer's Guide to the Electric Vehicle Electric Power Research Institute
- Plug-in America website
- Plug-in Cars website
- Plug-in Electric Vehicle Deployment in the Northeast Georgetown Climate Center
- Plug-In Electric Vehicles: A Case Study of Seven Markets (Norway, Netherlands, California, United States, France, Japan, and Germany), UC Davis, October 2014.
- Plug-in Tracker: A comprehensive list of highway-capable PEVs (cars and trucks, 2- and 3-wheeled and commercial vehicles)
- Plug-in List of Registered Charging Stations in the USA
- RechargeIT plug-in driving experiment (Google.org)
- Shades of Green – Electric Car's Carbon Emissions Around the Globe, Shrink that Footprint, February 2013.
- State of the Plug-in Electric Vehicle Market, Electrification Coalition, July 2013.
- The Great Debate – All-Electric Cars vs. Plug-In Hybrids, April 2014
- UK Plug-in Car Grant website
- Transport Action Plan: Urban Electric Mobility Initiative, United Nations, Climate Summit 2014, September 2014
- U.S. Federal & State Incentives & Laws
- U.S. State and Federal Incentives for EVs, PHEVs and Charge Stations
- US Tax Incentives for Plug-in Hybrids and Electric Cars
- Will Electric Cars Transform the U.S. Vehicle Market? Belfer Center, Harvard University
Books
- David B. Sandalow, ed. (2009). Plug-In Electric Vehicles: What Role for Washington? (1st. ed.). The Brookings Institution. ISBN 978-0-8157-0305-1.
- Mitchell, William J.; Borroni-Bird, Christopher; Burns, Lawrence D. (2010). Reinventing the Automobile: Personal Urban Mobility for the 21st Century (1st. ed.). The MIT Press. ISBN 978-0-262-01382-6. Archived from the original on 2010-06-09. Retrieved 2010-07-18.
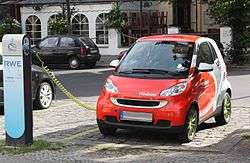
| Africa |
| ||||
|---|---|---|---|---|---|
| Asia | |||||
| Europe |
| ||||
| North America | |||||
| Oceania | |||||
| South America | |||||
| |||||