Renewable energy in the Czech Republic
Renewable energy in the Czech Republic describes the renewable energy related development in the Energy in the Czech Republic.
According to Eurostat, renewables share in the Czech Republic in 2009 was 5% of the energy mix in total (Mtoe) and 6% of gross electricity generation (TWh). The energy consumption by fuel included in 2009: 40% coal, petroleum 21%, gas 15%, nuclear 16% and renewables 5%. Most electricity was produced with coal (55%) and nuclear (33%).[1]
Solar power

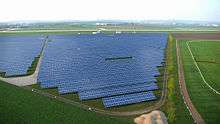
Photovoltaic power station at Brno-Tuřany
Solar power capacity per capita was the second highest in the EU in 2010.
| # | Country | 2005 | 2006 | 2007 | 2008 | 2009 | 2010 |
|---|---|---|---|---|---|---|---|
| – | EU-28 | 2,170 | 3,420 | 4,940 | 10,380 | 15,860 | 29,327 |
| 4 | Czech Republic | 0 | 1 | 4 | 55 | 466 | 1,953 |
| PV per capita 2010[5] | ||
|---|---|---|
| # | Country | W/capita |
| 1 | 212.3 | |
| 2 | 185.9 | |
Wind power
| EU Wind Energy Capacity (MW)[9][10] | ||||||||||||||
|---|---|---|---|---|---|---|---|---|---|---|---|---|---|---|
| No | Country | 2010 | 2009 | 2008 | 2007 | 2006 | 2005 | 2004 | 2003 | 2002 | 2001 | |||
| 18 | Czech Republic | 215 | 192 | 150 | 116 | 54 | 28 | 17 | 9 | 3 | 0 | |||
| Europe (MW) | 86,164 | 76,180 | 65,741 | 57,136 | 48,563 | 40,898 | ||||||||
gollark: Perhaps people just don't actually care much about accurate beliefs in subjects they don't personally use much, and vaguely assume that whatever they know about those things is right enough to discuss politics and whatever.
gollark: There are, I imagine, a lot of issues in other fields I don't know as much about.
gollark: Quantum computing, anything about computers, a decent amount of physics, AI.
gollark: Why would it be *their* fault?
gollark: I don't know exactly why.
See also
- Energy in the Czech Republic
- Solar power in the Czech Republic
- Renewable energy in the European Union
- Renewable energy by country
References
- EU country data
- Photovoltaic energy barometer 2007 – EurObserv’ER Systèmes solaires Le journal des énergies renouvelables n° 178, p. 49-70, 4/2007
- Photovoltaic energy barometer 2009 – EurObserv’ER Systèmes solaires Le journal des énergies renouvelables n° 190, p. 72-102, 3/2009
- Photovoltaic energy barometer 2010 – EurObserv’ER
- Photovoltaic energy barometer 2011 – EurObserv’ER
- Solar Thermal Markets in Europe Trends and Market Statistics 2010 ESTIF June 2011
- Solar Thermal Markets in Europe, Trends and market statistics 2008
- Solar Thermal Markets in Europe, Trends and market statistics 2009
- EWEA Staff (2010). "Cumulative installed capacity per EU Member State 1998 – 2009 (MW)". European Wind Energy Association. Retrieved 22 May 2010.
- EWEA Staff (February 2011). "EWEA Annual Statistics 2010" (PDF). European Wind Energy Association. Retrieved 31 January 2011.
External links
![]()
This article is issued from Wikipedia. The text is licensed under Creative Commons - Attribution - Sharealike. Additional terms may apply for the media files.