Des Moines metropolitan area
The Des Moines metropolitan area, officially known as the Des Moines–West Des Moines, IA Metropolitan Statistical Area (MSA), consists of six counties in central Iowa, United States: Polk, Dallas, Warren, Madison, Guthrie, and Jasper.[1] The 2010 census population of these counties was 606,475, and the 2017 estimated population was 682,877.[2][3]
Greater Des Moines | |
|---|---|
| Des Moines–West Des Moines, IA MSA | |
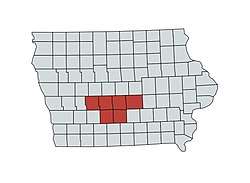 Map of Counties in the Des Moines, Iowa metropolitan area | |
| Coordinates: 41°33′18″N 93°50′09″W | |
| Country | United States |
| State(s) | |
| Largest city | Des Moines |
| Other cities | - West Des Moines - Ankeny - Urbandale |
| Area | |
| • Total | 3,645 sq mi (9,440 km2) |
| Highest elevation | N/A ft (N/A m) |
| Lowest elevation | 750 ft (228.6 m) |
| Population (2019) | |
| • Total | 699,292 |
| • Rank | 83rd in the U.S. |
| • Density | 183.4/sq mi (70.8/km2) |
Two additional counties, Boone and Story, are part of the Des Moines–Ames–West Des Moines Combined Statistical Area (CSA). The area encompasses the separate metropolitan area of Ames (Story County), and the separate micropolitan area of Boone (Boone County). The total population of the CSA was 722,323 in the 2010 census and 806,863 based on 2017 estimates.[4]
Geography
The lowest geographical point in the metropolitan area is the Des Moines River, where it passes the northeast corner of Warren County, and the southeast corner of Polk County.
Historical definitions
Polk County was originally the only county in the Des Moines metropolitan area when the United States Bureau of the Budget (now the United States Office of Management and Budget) began defining metropolitan areas in 1950. Warren County was added in 1973 and Dallas County was added in 1983.[5] Guthrie and Madison counties were added in 2003 after metropolitan areas were redefined. In 2005 the area was renamed the Des Moines–West Des Moines Metropolitan Statistical Area after a special census showed that West Des Moines had topped the 50,000 mark in population.[6] Jasper county was added in September 2018.
Communities
| Historical population | |||
|---|---|---|---|
| Census | Pop. | %± | |
| 1900 | 82,684 | — | |
| 1910 | 110,438 | 33.6% | |
| 1920 | 154,029 | 39.5% | |
| 1930 | 172,837 | 12.2% | |
| 1940 | 195,835 | 13.3% | |
| 1950 | 226,010 | 15.4% | |
| 1960 | 337,169 | 49.2% | |
| 1970 | 363,419 | 7.8% | |
| 1980 | 392,141 | 7.9% | |
| 1990 | 416,346 | 6.2% | |
| 2000 | 481,394 | 15.6% | |
| 2010 | 569,633 | 18.3% | |
| Est. 2019 | 699,292 | 22.8% | |
| U.S. Decennial Census[7] | |||
Places with more than 200,000 inhabitants
- Des Moines (Principal city)
Places with 50,000 to 100,000 inhabitants
Places with 10,000 to 50,000 inhabitants
Places with 1,000 to 10,000 inhabitants
Places with fewer than 1,000 inhabitants
Unincorporated places
Demographics
As of the census[8] of 2000, there were 481,394 people, 189,371 households, and 126,177 families residing within the MSA. The racial makeup of the MSA was 90.24% White, 3.85% African American, 0.24% Native American, 2.15% Asian, 0.05% Pacific Islander, 2.00% from other races, and 1.46% from two or more races. Hispanic or Latino of any race were 4.02% of the population.
The median income for a household in the MSA was $44,667, and the median income for a family was $52,617. Males had a median income of $34,710 versus $25,593 for females. The per capita income for the MSA was $21,253.
References
- https://www.desmoinesregister.com/story/news/2018/09/21/des-moines-west-des-moines-metro-polk-county-jasper-county-dallas-county-census-bureau-growth/1380120002/
- "Table 1. Annual Estimates of the Population of Metropolitan and Micropolitan Statistical Areas: April 1, 2000 to July 1, 2009 (CBSA-EST2009-01)". 2009 Population Estimates. United States Census Bureau, Population Division. March 23, 2010. Archived from the original (CSV) on March 26, 2010. Retrieved March 24, 2010.
- http://businessrecord.com/Content/Default/-All-Latest-News/Article/Metro-population-expands-west---Census-Bureau-/-3/248/62881
- "Table 1. Annual Estimates of the Population of Combined Statistical Ar/s: April 1, 2010 to July 1, 2017 (CBSA-EST2012-02)" (CSV). 2012 Population Estimates. United States Census Bureau, Population Division. March 23, 2013. Retrieved January 29, 2015.
- United States Census Bureau. "Historical Metropolitan Area Definitions". Archived from the original on October 9, 1999. Retrieved July 21, 2006.
- United States Office of Management and Budget. "Update of Statistical Area Definitions and Guidance on Their Uses" (PDF). pp. 5, 36. Archived from the original (PDF) on May 14, 2006. Retrieved July 21, 2006.
- "U.S. Decennial Census". United States Census Bureau. Archived from the original on May 12, 2015. Retrieved April 12, 2020.
- "U.S. Census website". United States Census Bureau. Retrieved 2008-01-31.


Great Lakes megaregion as defined by RPA | ||
|---|---|---|
Note: A few Great Lakes regions cities in Canada are left out. Metropolitan areas have +150,000 according to source at the time estimated. | ||
| Great Lakes region cities | 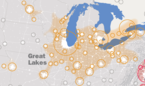 | |
| Surrounding cities |
| |
| Cities of states south of region | ||
| Other metro-regions | ||