Springfield metropolitan area, Massachusetts
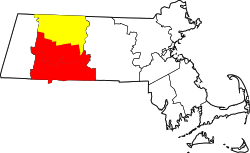
The Springfield metropolitan area, also known as Greater Springfield, is a region that is socio-economically and culturally tied to the City of Springfield, Massachusetts. The U.S. Office of Management and Budget defines the Springfield, MA Metropolitan Statistical Area (MSA) as consisting of three counties in Western Massachusetts. As of July 1, 2018, the metropolitan area's population was estimated at 631,982.[4] Following the 2010 Census, there have been discussions about combining the metropolitan areas of Springfield, Massachusetts and Hartford, Connecticut, into a greater Hartford–Springfield area, due to the region's economic interdependence and close geographic proximity (23.9 miles separate the cities' downtowns). Historically the Census has also identified the region as "Springfield–Chicopee–Holyoke, Mass.–Conn." as those cities were the area's population centers as recently as 1980; since that time the population has become further distributed, including new growth in Amherst, Westfield, and West Springfield, as well as Northern Connecticut.[4][5] Greater Springfield is one of two combined statistical areas in Massachusetts, the other being Greater Boston.
Springfield, MA Metropolitan Statistical Area Springfield-Greenfield Town | |
|---|---|
Metropolitan Statistical Area | |
 Springfield Metro Center from the Hampden County Memorial Bridge at blue hour | |
 Springfield metropolitan area Greenfield town micropolitan area | |
| Coordinates: 42.1°N 72.6°W | |
| Country | |
| States | |
| Principal municipalities | |
| Area | |
| • Total | 1,904 sq mi (4,930 km2) |
| Population | |
| • Density | 367.9/sq mi (142.0/km2) |
| • MSA (2018) | 631,761[1] (91st) |
| • CSA (2018) | 702,724[2] (70th) |
| Time zone | UTC-5 (Eastern Time Zone) |
| Area code(s) | 413 |
| GDP | $30 billion USD [3] |
| GDP per capita | $48,505 |
An alternative system of measuring New England metropolitan areas was developed—called the New England city and town area (NECTA)—because, in New England, towns are a much more important level of government than counties. County government in New England is weak at best, and in Connecticut, Rhode Island, and most of Massachusetts, does not exist at all. In addition, major cities and surrounding towns are often much smaller in land area than in other parts of the United States. For example, the City of Springfield is 33.2 sq. miles, whereas the City of Fort Worth, Texas, is 298.9 sq. miles, nearly 10 times larger in land area than Springfield. Because of the huge discrepancy in land area, in general New England cities like Springfield feature much higher population densities. In addition, New England cities and towns have developed allegiances that transcend state borders; thus, cities in Connecticut are included in Springfield's NECTA. This system is thought to better approximate New England's metropolitan areas because it uses New England's geographically smaller building blocks. In Springfield's case, its NECTA consists of 51 additional cities and towns surrounding the city.
Component cities/towns of the NECTA
- Amherst
- Ashfield
- Agawam
- Belchertown
- Blandford
- Chester
- Chesterfield
- Chicopee
- Conway
- Cummington
- Deerfield
- East Longmeadow
- East Windsor, Connecticut
- Easthampton
- Enfield, Connecticut
- Goshen
- Granby
- Granville
- Hadley
- Hampden
- Hatfield
- Holyoke
- Huntington
- Leverett
- Longmeadow
- Ludlow
- Monson
- Montgomery
- Northampton
- Palmer
- Pelham
- Russell
- Shutesbury
- Somers, Connecticut
- South Hadley
- Southampton
- Southwick
- Springfield (principal city)
- Suffield, Connecticut
- Sunderland
- Tolland
- Wales
- Ware
- Wendell
- West Springfield
- Westfield
- Westhampton
- Whately
- Wilbraham
- Williamsburg
- Windsor Locks, Connecticut
- Worthington
Demographics
As of the census[6] of 2010, there were 692,942 people, 269,091 households, and 168,758 families residing within the MSA. The racial makeup of the MSA was 81.10% White, 6.7% African American, 0.30% Native American, 2.5% Asian, 0.04% Pacific Islander, 6.6% from other races, and 2.7% from two or more races. Hispanic or Latino of any race were 15.4% of the population.
As of the census[6] of 2000, there were 680,014 people, 260,745 households, and 167,924 families residing within the MSA. The racial makeup of the MSA was 83.50% White, 5.96% African American, 0.25% Native American, 1.74% Asian, 0.06% Pacific Islander, 6.35% from other races, and 2.13% from two or more races. Hispanic or Latino of any race were 11.15% of the population. In the 2010 census, the metropolitan area had the highest percentage of Puerto Ricans of any metropolitan statistical area in the continental United States.[6]
The median income for a household in the MSA was $42,195, and the median income for a family was $52,551. Males had a median income of $37,784 versus $28,404 for females. The per capita income for the MSA was $20,633.
The median age for the MSA was 38.9 in 2010 overall, with a median age of 37.4 for males and 40.1 for females.[7] The estimated median age in 2017 was 38.2 overall with a median age 36.6 for males and 39.6 for females.[8] Among the 100 most populous MSAs in the United States, the Springfield metropolitan area had the 10th highest life expectancy in 2016 for the top quartile of income earners, adjusted for race and ethnicity, with an overall life expectancy of 87.2.[9]
Transportation
The Pioneer Valley Transit Authority (PVTA) is the primary operator of public transportation services in the Springfield Metropolitan Area. Headquartered in Springfield, the PVTA maintains a fleet of approximately 174 buses, 144 vans, and "is the largest regional transit authority in Massachusetts."[10] Founded in 1974 with the enactment of Massachusetts General Law Chapter 161B, the PVTA serves 24 member communities in Hampden, Hampshire, and Franklin counties. Each member community pays an assessment fee to the PVTA based "on the number of miles served in that city or town."[10] Alternative sources of revenue mostly originate from federal and state governments.[10] The PVTA itself is governed by an advisory board.[10]
See also
- Massachusetts census statistical areas
References
- "Annual Estimates of the Resident Population: April 1, 2010 to July 1, 2018 – Metropolitan Statistical Area; and for Puerto Rico – 2018 Population Estimates". U.S. Census Bureau. Retrieved April 20, 2019.
- "Annual Estimates of the Resident Population: April 1, 2010 to July 1, 2018 – Combined Statistical Area; and for Puerto Rico – 2018 Population Estimates". U.S. Census Bureau. Archived from the original on February 13, 2020. Retrieved April 20, 2018.
- "Total Real Gross Domestic Product for Springfield, MA (MSA)". Federal Reserve Bank of St. Louis. Archived from the original on December 27, 2017. Retrieved December 27, 2017.
- "Annual Estimates of the Resident Population: April 1, 2010 to July 1, 2015 - United States -- Metropolitan and Micropolitan Statistical Area; and for Puerto Rico". 2015 Population Estimates. United States Census Bureau, Population Division. 2015-07-01. Retrieved 2016-04-01.
- 1980 Census of Population and Housing: Springfield–Chicopee–Holyoke, Mass.–Conn. Washington, D.C.: Bureau of the Census, US Dept. of Commerce. 1983.
- "U.S. Census website". United States Census Bureau. Retrieved 2008-01-31.
- "Table DEC_10_SF1_SF1DP1". American Factfinder. United States Census. Archived from the original on 2020-02-13. Retrieved 2019-02-18.
- "Table ACS_17_5YR_B01002". American Factfinder. United States Census. Archived from the original on 2020-02-13. Retrieved 2019-02-18.
- Chetty, Raj; Stepner, Michael; Abraham, Sarah; Lin, Shelby; Scuderi, Benjamin; Turner, Nicholas; Bergeron, Augustin; Cutler, David (2016). "The Association Between Income and Life Expectancy in the United States, 2001-2014". Journal of the American Medical Association. doi:10.1001/jama.2016.4226. PMC 4866586.
- About the PVTA Pioneer Valley of Massachusetts Transit Authority. Pvta.com. Retrieved on 2013-07-15.