Calanogas
Calanogas, officially the Municipality of Calanogas (Maranao and Iranun: Inged a Calanogas; Tagalog: Bayan ng Calanogas), is a 5th class municipality in the province of Lanao del Sur, Philippines. According to the 2015 census, it has a population of 13,750 people.[3]
Calanogas | |
|---|---|
| Municipality of Calanogas | |
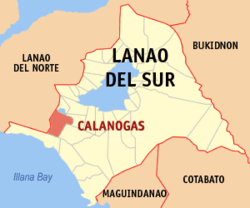 Map of Lanao del Sur with Calanogas highlighted | |
OpenStreetMap 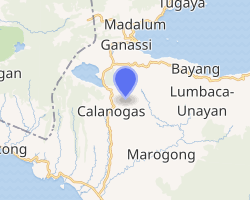
| |
.svg.png) Calanogas Location within the Philippines | |
| Coordinates: 7°45′N 124°06′E | |
| Country | |
| Region | Bangsamoro Autonomous Region in Muslim Mindanao (BARMM) |
| Province | Lanao del Sur |
| District | 2nd District |
| Barangays | 17 (see Barangays) |
| Government | |
| • Type | Sangguniang Bayan |
| • Mayor | Macapado M. Benito Sr. |
| • Vice Mayor | Abdul Hakim A. Benito |
| • Congressman | Yasser A. Balindong |
| • Electorate | 6,386 voters (2019) |
| Area | |
| • Total | 195.00 km2 (75.29 sq mi) |
| Population (2015 census)[3] | |
| • Total | 13,750 |
| • Density | 71/km2 (180/sq mi) |
| • Households | 1,786 |
| Economy | |
| • Income class | 5th municipal income class |
| • Poverty incidence | 68.53% (2015)[4] |
| • Revenue (₱) | 51,917,282.99 (2016) |
| Time zone | UTC+8 (PST) |
| ZIP code | 9319 |
| PSGC | |
| IDD : area code | +63 (0)63 |
| Climate type | tropical climate |
| Native languages | Maranao Tagalog |
| Website | www |
Barangays
Calanogas is politically subdivided into 17 barangays.
- Bubonga Ranao
- Calalanoan (poblacion)
- Gas
- Kanapnapan (not included)
- Inudaran
- Inoma
- Luguna
- Mimbalawag
- Ngingir
- Pagalongan
- Panggawalupa
- Pantaon
- Piksan
- Pindolonan
- Punud
- Tagoranao
- Taliboboka
- Tambac
Climate
| Climate data for Calanogas, Lanao de Sur | |||||||||||||
|---|---|---|---|---|---|---|---|---|---|---|---|---|---|
| Month | Jan | Feb | Mar | Apr | May | Jun | Jul | Aug | Sep | Oct | Nov | Dec | Year |
| Average high °C (°F) | 25 (77) |
26 (79) |
26 (79) |
26 (79) |
26 (79) |
25 (77) |
25 (77) |
25 (77) |
25 (77) |
25 (77) |
25 (77) |
25 (77) |
25 (78) |
| Average low °C (°F) | 19 (66) |
20 (68) |
20 (68) |
21 (70) |
21 (70) |
21 (70) |
20 (68) |
20 (68) |
20 (68) |
20 (68) |
20 (68) |
20 (68) |
20 (68) |
| Average precipitation mm (inches) | 236 (9.3) |
225 (8.9) |
244 (9.6) |
235 (9.3) |
304 (12.0) |
287 (11.3) |
200 (7.9) |
175 (6.9) |
158 (6.2) |
200 (7.9) |
287 (11.3) |
243 (9.6) |
2,794 (110.2) |
| Average rainy days | 24.3 | 22.3 | 26.0 | 27.2 | 28.3 | 27.2 | 25.8 | 24.8 | 22.2 | 25.4 | 27.2 | 25.8 | 306.5 |
| Source: Meteoblue (Use with caution: this is modeled/calculated data, not measured locally.) [5] | |||||||||||||
Demographics
| Year | Pop. | ±% p.a. |
|---|---|---|
| 1980 | 3,834 | — |
| 1990 | 7,559 | +7.03% |
| 1995 | 8,577 | +2.40% |
| 2000 | 9,989 | +3.32% |
| 2007 | 21,847 | +11.40% |
| 2010 | 11,988 | −19.62% |
| 2015 | 13,750 | +2.65% |
| Source: Philippine Statistics Authority[3][6][7][8] | ||
References
- "Municipality". Quezon City, Philippines: Department of the Interior and Local Government. Retrieved 31 May 2013.
- "Province: Lanao del Sur". PSGC Interactive. Quezon City, Philippines: Philippine Statistics Authority. Retrieved 12 November 2016.
- Census of Population (2015). "ARMM – Autonomous Region in Muslim Mindanao". Total Population by Province, City, Municipality and Barangay. PSA. Retrieved 20 June 2016.
- "PSA releases the 2015 Municipal and City Level Poverty Estimates". Quezon City, Philippines. Retrieved 12 October 2019.
- "Calanogas, Lanao del Sur : Average Temperatures and Rainfall". Meteoblue. Retrieved 24 January 2019.
- Census of Population and Housing (2010). "ARMM – Autonomous Region in Muslim Mindanao". Total Population by Province, City, Municipality and Barangay. NSO. Retrieved 29 June 2016.
- Censuses of Population (1903–2007). "ARMM – Autonomous Region in Muslim Mindanao". Table 1. Population Enumerated in Various Censuses by Province/Highly Urbanized City: 1903 to 2007. NSO.
- "Province of Lanao del Sur". Municipality Population Data. Local Water Utilities Administration Research Division. Retrieved 17 December 2016.
External links
- Calanogas Profile at PhilAtlas.com
- Philippine Standard Geographic Code
- Philippine Census Information
- Local Governance Performance Management System
Places adjacent to Calanogas | ||||||||||
|---|---|---|---|---|---|---|---|---|---|---|
| ||||||||||
This article is issued from Wikipedia. The text is licensed under Creative Commons - Attribution - Sharealike. Additional terms may apply for the media files.