Nunungan, Lanao del Norte
Nunungan, officially the Municipality of Nunungan (Maranao: Inged a Nunungan; Cebuano: Lungsod sa Nunungan; Tagalog: Bayan ng Nunungan), is a 3rd class municipality in the province of Lanao del Norte, Philippines. According to the 2015 census, it has a population of 18,367 people.[3]
Nunungan | |
|---|---|
| Municipality of Nunungan | |
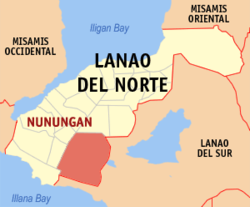 Map of Lanao del Norte with Nunungan highlighted | |
OpenStreetMap 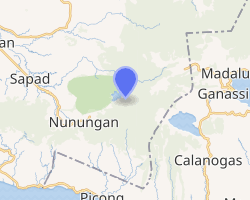
| |
.svg.png) Nunungan Location within the Philippines | |
| Coordinates: 7°49′N 123°58′E | |
| Country | |
| Region | Northern Mindanao (Region X) |
| Province | Lanao del Norte |
| District | 2nd District |
| Founded | July 1, 1968 |
| Barangays | 25 (see Barangays) |
| Government | |
| • Type | Sangguniang Bayan |
| • Mayor | Marcos M. Mamay |
| • Vice Mayor | Jun R. Cawasa |
| • Congressman | Abdullah D. Dimaporo |
| • Electorate | 9,571 voters (2019) |
| Area | |
| • Total | 473.28 km2 (182.73 sq mi) |
| Population (2015 census)[3] | |
| • Total | 18,367 |
| • Density | 39/km2 (100/sq mi) |
| • Households | 3,456 |
| Economy | |
| • Income class | 3rd municipal income class |
| • Poverty incidence | 69.06% (2015)[4] |
| • Revenue (₱) | 103,884,609.14 (2016) |
| Time zone | UTC+8 (PST) |
| ZIP code | 9216 |
| PSGC | |
| IDD : area code | +63 (0)63 |
| Climate type | tropical climate |
| Native languages | Maranao Cebuano Binukid Tagalog |
| Website | www |
Geography
Nunungan is the largest municipality in Lanao del Norte in terms of land area. It is home to the Mount Inayawan Range Natural Park.
Barangays
Nunungan is politically subdivided into 25 barangays.
- Abaga
- Bangco
- Canibongan
- Karcum
- Dimayon
- Inayawan
- Kaludan
- Katubuan
- Cabasaran (Laya)
- Liangan
- Lupitan
- Mangan
- Malaig
- Masibay
- Poblacion
- Notongan
- Putadun (Nunungan Proper)
- Panganapan
- Pantar
- Paridi
- Rarab
- Raraban
- Rebucon
- Songgod
- Taraka
Climate
| Climate data for Nunungan, Lanao del Norte | |||||||||||||
|---|---|---|---|---|---|---|---|---|---|---|---|---|---|
| Month | Jan | Feb | Mar | Apr | May | Jun | Jul | Aug | Sep | Oct | Nov | Dec | Year |
| Average high °C (°F) | 24 (75) |
24 (75) |
25 (77) |
26 (79) |
25 (77) |
24 (75) |
24 (75) |
24 (75) |
25 (77) |
24 (75) |
24 (75) |
24 (75) |
24 (76) |
| Average low °C (°F) | 17 (63) |
17 (63) |
17 (63) |
18 (64) |
19 (66) |
19 (66) |
18 (64) |
18 (64) |
18 (64) |
18 (64) |
18 (64) |
17 (63) |
18 (64) |
| Average precipitation mm (inches) | 69 (2.7) |
58 (2.3) |
67 (2.6) |
60 (2.4) |
109 (4.3) |
114 (4.5) |
83 (3.3) |
78 (3.1) |
76 (3.0) |
92 (3.6) |
86 (3.4) |
63 (2.5) |
955 (37.7) |
| Average rainy days | 12.8 | 11.6 | 14.8 | 17.4 | 24.8 | 23.5 | 20.7 | 18.5 | 17.4 | 22.5 | 21.6 | 15.6 | 221.2 |
| Source: Meteoblue [5] | |||||||||||||
Demographics
|
| |||||||||||||||||||||||||||||||||||||||||||||
| Source: Philippine Statistics Authority[3][6][7][8] | ||||||||||||||||||||||||||||||||||||||||||||||
Local government
Mayors after People Power Revolution 1986:
- 1986 - 1992, Atty. Abdul Malik Manamparan
- 1992 - 1995, Atty. Abdul Malik Manamparan
- 1995 - 1998, Atty. Abdul Malik Manamparan
- 1998 - 2001, Aminoddin C. Manamparan
- 2001 - 2004, Jun R. Cawasa / Atty. Abdul Malik Manamparan
- 2004 - 2007, Atty. Abdul Malik Manamparan
- 2007 - 2010, Atty. Abdul Malik Manamparan
- 2010 - 2013, Atty. Abdul Malik Manamparan
- 2013 - 2016, Abdul C. Manamparan II
- 2016 - present, Marcos M. Mamay
Vice Mayors after People Power Revolution 1986:
- 1986 - 1992,
- 1992 - 1995,
- 1995 - 1998,
- 1998 - 2001,
- 2001 - 2004,
- 2004 - 2007,
- 2007 - 2010,
- 2010 - 2013,
- 2013 - 2016, Atty. Abdul Malik Manamparan
- 2016 - present, Jun R. Cawasa
References
- "Municipality". Quezon City, Philippines: Department of the Interior and Local Government. Retrieved 31 May 2013.
- "Province: Lanao del Norte". PSGC Interactive. Quezon City, Philippines: Philippine Statistics Authority. Retrieved 12 November 2016.
- Census of Population (2015). "Region X (Northern Mindanao)". Total Population by Province, City, Municipality and Barangay. PSA. Retrieved 20 June 2016.
- "PSA releases the 2015 Municipal and City Level Poverty Estimates". Quezon City, Philippines. Retrieved 12 October 2019.
- "Nunungan: Average Temperatures and Rainfall". Meteoblue. Retrieved 5 February 2020.
- Census of Population and Housing (2010). "Region X (Northern Mindanao)". Total Population by Province, City, Municipality and Barangay. NSO. Retrieved 29 June 2016.
- Censuses of Population (1903–2007). "Region X (Northern Mindanao)". Table 1. Population Enumerated in Various Censuses by Province/Highly Urbanized City: 1903 to 2007. NSO.
- "Province of Lanao del Norte". Municipality Population Data. Local Water Utilities Administration Research Division. Retrieved 17 December 2016.
External links
| Wikimedia Commons has media related to Nunungan. |
- Nunungan Profile at PhilAtlas.com
- Philippine Standard Geographic Code
- Philippine Census Information
- Local Governance Performance Management System
Places adjacent to Nunungan, Lanao del Norte | ||||||||||
|---|---|---|---|---|---|---|---|---|---|---|
| ||||||||||
Tubod (capital) | |
| Municipalities | |
| Highly urbanized city |
|
This article is issued from Wikipedia. The text is licensed under Creative Commons - Attribution - Sharealike. Additional terms may apply for the media files.