1964 United States presidential election in Indiana
The 1964 United States presidential election in Indiana took place on November 3, 1964, as part of the 1964 United States presidential election. Indiana voters chose thirteen[2] representatives, or electors, to the Electoral College, who voted for president and vice president.
| ||||||||||||||||||||||||||
| ||||||||||||||||||||||||||
 County Results
| ||||||||||||||||||||||||||
| ||||||||||||||||||||||||||
| Elections in Indiana | ||||||
|---|---|---|---|---|---|---|
 | ||||||
|
||||||
Before this election, Indiana had not voted Democratic since Franklin Roosevelt‘s 46-state landslide of 1936, although native son Wendell Willkie in 1940 and Thomas E. Dewey in 1948 only won by very narrow margins. The pre-election period in the Hoosier State was highlighted by a dramatic Democratic primary challenge from Alabama Governor George Wallace, who won considerable backlash white support in suburban areas.[3] However, Wallace lost by worse than one-to-two against solitary opponent Matthew E. Welsh in Indiana[4] and never had any hope of beating incumbent Lyndon Johnson in the presidential race.
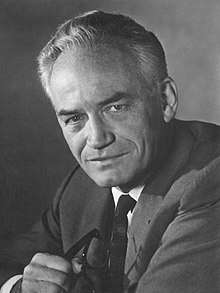
Republican candidate Barry Goldwater naturally considered Indiana critical given its GOP loyalty and campaigned in the state during October, when he argued to a severely hostile reaction that America should use nuclear weapons on Vietnam.[5]
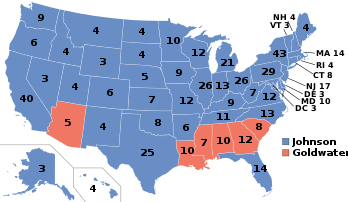
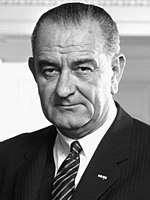
The state was won by incumbent President Lyndon B. Johnson (D–Texas), with 55.98% of the popular vote, against Senator Barry Goldwater (R–Arizona), with 43.56% of the popular vote.[6] Powerful hostility to Goldwater's leanings from its Yankee and Appalachia-influenced Northern and Southern regions[7] allowed Johnson to carry the state, although Indiana was still 10.16% more Republican than the nation at-large.
This would be the last time until 2008 that Indiana would vote for a Democrat in a presidential election.
This is the solitary occasion since the Civil War when Randolph County and Wabash County have voted for a Democratic Presidential candidate.[8] As of the 2016 presidential election, this is the last election in which the following counties voted for a Democratic Presidential candidate: Allen, Adams, Bartholomew, Brown, Benton, Carroll, Cass, Clay, Clinton, Daviess, Decatur, DeKalb, Elkhart, Fayette, Fountain, Franklin, Grant, Hancock, Henry, Howard, Huntington, Jackson, Jay, Jennings, LaGrange County, Lawrence, Marshall, Miami, Montgomery County, Noble, Orange, Parke, Pulaski, Putnam, Ripley, Shelby, Tipton, Union, Warren, Wells, White, and Whitley.[9]
Results
| Party | Candidate | Votes | % | |
|---|---|---|---|---|
| Democratic | Lyndon B. Johnson (inc.) | 1,170,848 | 55.98% | |
| Republican | Barry Goldwater | 911,118 | 43.56% | |
| Prohibition | E. Harold Munn | 8,266 | 0.40% | |
| Socialist Labor | Eric Hass | 1,374 | 0.07% | |
| Total votes | 2,091,606 | 100% | ||
Results by county
| Lyndon Baines Johnson Democratic |
Barry Morris Goldwater Republican |
Various candidates Other parties |
Margin | Total votes cast[11] | |||||
|---|---|---|---|---|---|---|---|---|---|
| County | # | % | # | % | # | % | # | % | # |
| Adams | 6,637 | 60.48% | 4,230 | 38.55% | 106 | 0.97% | 2,407 | 21.94% | 10,973 |
| Allen | 50,706 | 50.53% | 49,284 | 49.11% | 363 | 0.36% | 1,422 | 1.42% | 100,353 |
| Bartholomew | 12,940 | 53.72% | 11,026 | 45.77% | 124 | 0.51% | 1,914 | 7.95% | 24,090 |
| Benton | 2,940 | 50.42% | 2,886 | 49.49% | 5 | 0.09% | 54 | 0.93% | 5,831 |
| Blackford | 4,210 | 61.65% | 2,552 | 37.37% | 67 | 0.98% | 1,658 | 24.28% | 6,829 |
| Boone | 6,716 | 47.36% | 7,419 | 52.32% | 46 | 0.32% | -703 | -4.96% | 14,181 |
| Brown | 2,135 | 60.24% | 1,390 | 39.22% | 19 | 0.54% | 745 | 21.02% | 3,544 |
| Carroll | 4,789 | 54.96% | 3,896 | 44.71% | 29 | 0.33% | 893 | 10.25% | 8,714 |
| Cass | 11,148 | 58.74% | 7,735 | 40.76% | 95 | 0.50% | 3,413 | 17.98% | 18,978 |
| Clark | 17,330 | 68.89% | 7,701 | 30.61% | 125 | 0.50% | 9,629 | 38.28% | 25,156 |
| Clay | 6,528 | 54.28% | 5,412 | 45.00% | 86 | 0.72% | 1,116 | 9.28% | 12,026 |
| Clinton | 8,353 | 53.61% | 7,157 | 45.93% | 72 | 0.46% | 1,196 | 7.68% | 15,582 |
| Crawford | 2,514 | 57.40% | 1,828 | 41.74% | 38 | 0.87% | 686 | 15.66% | 4,380 |
| Daviess | 6,528 | 50.62% | 6,319 | 49.00% | 48 | 0.37% | 209 | 1.62% | 12,895 |
| Dearborn | 7,699 | 58.33% | 5,473 | 41.47% | 26 | 0.20% | 2,226 | 16.87% | 13,198 |
| Decatur | 5,564 | 53.94% | 4,702 | 45.58% | 49 | 0.48% | 862 | 8.36% | 10,315 |
| De Kalb | 7,559 | 54.42% | 6,210 | 44.71% | 120 | 0.86% | 1,349 | 9.71% | 13,889 |
| Delaware | 28,469 | 58.48% | 20,022 | 41.13% | 187 | 0.38% | 8,447 | 17.35% | 48,678 |
| Dubois | 10,114 | 72.56% | 3,800 | 27.26% | 25 | 0.18% | 6,314 | 45.30% | 13,939 |
| Elkhart | 21,679 | 51.72% | 19,870 | 47.41% | 365 | 0.87% | 1,809 | 4.32% | 41,914 |
| Fayette | 6,713 | 58.92% | 4,637 | 40.70% | 43 | 0.38% | 2,076 | 18.22% | 11,393 |
| Floyd | 15,656 | 66.23% | 7,834 | 33.14% | 148 | 0.63% | 7,822 | 33.09% | 23,638 |
| Fountain | 5,574 | 54.23% | 4,666 | 45.40% | 38 | 0.37% | 908 | 8.83% | 10,278 |
| Franklin | 4,021 | 57.48% | 2,956 | 42.26% | 18 | 0.26% | 1,065 | 15.23% | 6,995 |
| Fulton | 4,374 | 49.60% | 4,410 | 50.01% | 34 | 0.39% | -36 | -0.41% | 8,818 |
| Gibson | 10,507 | 63.84% | 5,865 | 35.64% | 86 | 0.52% | 4,642 | 28.21% | 16,458 |
| Grant | 17,574 | 54.08% | 14,688 | 45.20% | 232 | 0.71% | 2,886 | 8.88% | 32,494 |
| Greene | 8,574 | 58.85% | 5,919 | 40.62% | 77 | 0.53% | 2,655 | 18.22% | 14,570 |
| Hamilton | 7,553 | 38.38% | 12,060 | 61.28% | 68 | 0.35% | -4,507 | -22.90% | 19,681 |
| Hancock | 6,573 | 50.59% | 6,370 | 49.03% | 50 | 0.38% | 203 | 1.56% | 12,993 |
| Harrison | 5,949 | 61.28% | 3,671 | 37.81% | 88 | 0.91% | 2,278 | 23.47% | 9,708 |
| Hendricks | 8,857 | 43.41% | 11,497 | 56.34% | 51 | 0.25% | -2,640 | -12.94% | 20,405 |
| Henry | 12,374 | 54.52% | 10,184 | 44.87% | 139 | 0.61% | 2,190 | 9.65% | 22,697 |
| Howard | 17,809 | 57.56% | 12,897 | 41.68% | 235 | 0.76% | 4,912 | 15.88% | 30,941 |
| Huntington | 9,308 | 55.26% | 7,438 | 44.16% | 98 | 0.58% | 1,870 | 11.10% | 16,844 |
| Jackson | 8,572 | 57.26% | 6,285 | 41.98% | 114 | 0.76% | 2,287 | 15.28% | 14,971 |
| Jasper | 3,995 | 46.91% | 4,497 | 52.81% | 24 | 0.28% | -502 | -5.89% | 8,516 |
| Jay | 6,781 | 59.91% | 4,439 | 39.22% | 98 | 0.87% | 2,342 | 20.69% | 11,318 |
| Jefferson | 6,694 | 57.78% | 4,808 | 41.50% | 84 | 0.73% | 1,886 | 16.28% | 11,586 |
| Jennings | 4,307 | 55.14% | 3,469 | 44.41% | 35 | 0.45% | 838 | 10.73% | 7,811 |
| Johnson | 10,099 | 48.87% | 10,472 | 50.68% | 92 | 0.45% | -373 | -1.81% | 20,663 |
| Knox | 12,678 | 62.11% | 7,612 | 37.29% | 121 | 0.59% | 5,066 | 24.82% | 20,411 |
| Kosciusko | 8,759 | 45.18% | 10,488 | 54.10% | 141 | 0.73% | -1,729 | -8.92% | 19,388 |
| Lagrange | 2,818 | 49.96% | 2,785 | 49.38% | 37 | 0.66% | 33 | 0.59% | 5,640 |
| Lake | 134,978 | 64.42% | 73,722 | 35.19% | 823 | 0.39% | 61,256 | 29.24% | 209,523 |
| La Porte | 22,220 | 57.57% | 16,270 | 42.16% | 104 | 0.27% | 5,950 | 15.42% | 38,594 |
| Lawrence | 8,677 | 51.17% | 8,186 | 48.28% | 93 | 0.55% | 491 | 2.90% | 16,956 |
| Madison | 33,325 | 57.73% | 24,171 | 41.87% | 233 | 0.40% | 9,154 | 15.86% | 57,729 |
| Marion | 152,418 | 51.43% | 143,015 | 48.25% | 948 | 0.32% | 9,403 | 3.17% | 296,381 |
| Marshall | 8,397 | 51.15% | 7,895 | 48.10% | 123 | 0.75% | 502 | 3.06% | 16,415 |
| Martin | 3,137 | 60.96% | 2,000 | 38.87% | 9 | 0.17% | 1,137 | 22.09% | 5,146 |
| Miami | 7,667 | 54.53% | 6,270 | 44.59% | 123 | 0.87% | 1,397 | 9.94% | 14,060 |
| Monroe | 11,918 | 53.27% | 10,309 | 46.08% | 145 | 0.65% | 1,609 | 7.19% | 22,372 |
| Montgomery | 8,042 | 50.48% | 7,823 | 49.11% | 65 | 0.41% | 219 | 1.37% | 15,930 |
| Morgan | 7,011 | 45.44% | 8,347 | 54.10% | 70 | 0.45% | -1,336 | -8.66% | 15,428 |
| Newton | 2,547 | 47.70% | 2,780 | 52.06% | 13 | 0.24% | -233 | -4.36% | 5,340 |
| Noble | 7,621 | 57.03% | 5,682 | 42.52% | 60 | 0.45% | 1,939 | 14.51% | 13,363 |
| Ohio | 1,397 | 60.53% | 905 | 39.21% | 6 | 0.26% | 492 | 21.32% | 2,308 |
| Orange | 4,490 | 51.55% | 4,187 | 48.07% | 33 | 0.38% | 303 | 3.48% | 8,710 |
| Owen | 3,339 | 54.20% | 2,788 | 45.26% | 33 | 0.54% | 551 | 8.94% | 6,160 |
| Parke | 4,034 | 52.93% | 3,570 | 46.84% | 17 | 0.22% | 464 | 6.09% | 7,621 |
| Perry | 6,226 | 66.65% | 3,090 | 33.08% | 25 | 0.27% | 3,136 | 33.57% | 9,341 |
| Pike | 4,519 | 62.14% | 2,703 | 37.17% | 50 | 0.69% | 1,816 | 24.97% | 7,272 |
| Porter | 12,975 | 47.00% | 14,480 | 52.45% | 152 | 0.55% | -1,505 | -5.45% | 27,607 |
| Posey | 6,164 | 63.09% | 3,573 | 36.57% | 33 | 0.34% | 2,591 | 26.52% | 9,770 |
| Pulaski | 3,408 | 51.37% | 3,202 | 48.27% | 24 | 0.36% | 206 | 3.11% | 6,634 |
| Putnam | 6,275 | 53.96% | 5,331 | 45.84% | 24 | 0.21% | 944 | 8.12% | 11,630 |
| Randolph | 6,804 | 50.38% | 6,551 | 48.50% | 151 | 1.12% | 253 | 1.87% | 13,506 |
| Ripley | 5,933 | 56.23% | 4,587 | 43.47% | 32 | 0.30% | 1,346 | 12.76% | 10,552 |
| Rush | 4,450 | 49.31% | 4,507 | 49.94% | 68 | 0.75% | -57 | -0.63% | 9,025 |
| St. Joseph | 65,844 | 61.91% | 39,872 | 37.49% | 630 | 0.59% | 25,972 | 24.42% | 106,346 |
| Scott | 4,205 | 67.79% | 1,992 | 32.11% | 6 | 0.10% | 2,213 | 35.68% | 6,203 |
| Shelby | 9,078 | 55.17% | 7,310 | 44.42% | 67 | 0.41% | 1,768 | 10.74% | 16,455 |
| Spencer | 4,834 | 54.72% | 3,980 | 45.05% | 20 | 0.23% | 854 | 9.67% | 8,834 |
| Starke | 4,838 | 58.14% | 3,466 | 41.65% | 17 | 0.20% | 1,372 | 16.49% | 8,321 |
| Steuben | 3,999 | 49.34% | 4,075 | 50.28% | 31 | 0.38% | -76 | -0.94% | 8,105 |
| Sullivan | 7,351 | 65.28% | 3,867 | 34.34% | 42 | 0.37% | 3,484 | 30.94% | 11,260 |
| Switzerland | 2,231 | 61.29% | 1,390 | 38.19% | 19 | 0.52% | 841 | 23.10% | 3,640 |
| Tippecanoe | 20,257 | 51.45% | 19,036 | 48.35% | 79 | 0.20% | 1,221 | 3.10% | 39,372 |
| Tipton | 4,410 | 53.03% | 3,863 | 46.45% | 43 | 0.52% | 547 | 6.58% | 8,316 |
| Union | 1,463 | 48.69% | 1,531 | 50.95% | 11 | 0.37% | -68 | -2.26% | 3,005 |
| Vanderburgh | 45,796 | 62.39% | 27,231 | 37.10% | 380 | 0.52% | 18,565 | 25.29% | 73,407 |
| Vermillion | 5,957 | 63.49% | 3,397 | 36.21% | 28 | 0.30% | 2,560 | 27.29% | 9,382 |
| Vigo | 27,606 | 59.05% | 19,001 | 40.64% | 144 | 0.31% | 8,605 | 18.41% | 46,751 |
| Wabash | 7,485 | 51.50% | 6,905 | 47.51% | 145 | 1.00% | 580 | 3.99% | 14,535 |
| Warren | 2,261 | 51.10% | 2,154 | 48.68% | 10 | 0.23% | 107 | 2.42% | 4,425 |
| Warrick | 7,222 | 62.04% | 4,376 | 37.59% | 42 | 0.36% | 2,846 | 24.45% | 11,640 |
| Washington | 4,943 | 57.66% | 3,598 | 41.97% | 32 | 0.37% | 1,345 | 15.69% | 8,573 |
| Wayne | 15,269 | 49.70% | 15,342 | 49.93% | 113 | 0.37% | -73 | -0.24% | 30,724 |
| Wells | 5,945 | 59.12% | 4,018 | 39.96% | 92 | 0.91% | 1,927 | 19.16% | 10,055 |
| White | 5,407 | 51.72% | 5,015 | 47.97% | 33 | 0.32% | 392 | 3.75% | 10,455 |
| Whitley | 5,798 | 53.95% | 4,896 | 45.56% | 53 | 0.49% | 902 | 8.39% | 10,747 |
| Totals | 1,170,848 | 55.98% | 911,118 | 43.56% | 9,640 | 0.46% | 259,730 | 12.42% | 2,091,606 |
References
- "United States Presidential election of 1964 - Encyclopædia Britannica". Retrieved May 31, 2017.
- "1964 Election for the Forty-Fifth Term (1965-69)". Retrieved May 31, 2017.
- Conway M. Margaret; 'The White Backlash Re-examined: Wallace and the 1964 Primaries'; Social Science Quarterly, vol. 49, no. 3: Black America (December, 1968), pp. 710-719
- Lesher, Stephan (1994). George Wallace: American Populist, p. 295 ISBN 0-201-62210-6
- Matthews, Jeffery J.; ‘To Defeat a Maverick: The Goldwater Candidacy Revisited, 1963-1964’; Presidential Studies Quarterly, vol. 27, no. 4: Rules of the Game: How to Play the Presidency (Fall, 1997), pp. 662-678
- "The American Presidency Project - Election of 1964". Retrieved May 31, 2017.
- Phillips, Kevin P.; The Emerging Republican Majority, pp. 363-364, 397 ISBN 9780691163246
- Menendez, Albert J.; The Geography of Presidential Elections in the United States, 1868-2004, pp. 187-192 ISBN 0786422173
- Sullivan, Robert David; ‘How the Red and Blue Map Evolved Over the Past Century’; America Magazine in The National Catholic Review; June 29, 2016
- "1964 Presidential General Election Results – Indiana". Retrieved May 31, 2017.
- Scammon, Richard M. (compiler); America at the Polls: A Handbook of Presidential Election Statistics 1920-1964; pp. 147-148 ISBN 0405077114