1964 United States presidential election in Florida
The 1964 United States presidential election in Florida was held November 3, 1964. All contemporary fifty states and the District of Columbia took part, and Florida voters selected fourteen electors to the Electoral College, who voted for president and vice president.
| ||||||||||||||||||||||||||
| Turnout | 74% | |||||||||||||||||||||||||
|---|---|---|---|---|---|---|---|---|---|---|---|---|---|---|---|---|---|---|---|---|---|---|---|---|---|---|
| ||||||||||||||||||||||||||
 County results
| ||||||||||||||||||||||||||
| ||||||||||||||||||||||||||
| Elections in Florida | ||||||||||||||
|---|---|---|---|---|---|---|---|---|---|---|---|---|---|---|
 | ||||||||||||||
|
||||||||||||||
|
||||||||||||||
|
|
||||||||||||||
|
North Miami
|
||||||||||||||
|
||||||||||||||
|
|
||||||||||||||
|
| ||||||||||||||
Background
Like all former Confederate States, Florida following the end of Reconstruction had become a one-party Democratic state as the introduction of poll taxes and literacy tests effectively disfranchised the entire black population and many poor whites. Unlike southern states extending into the Appalachian Mountains or Ozarks, or Texas with its German settlements in the Edwards Plateau, Florida completely lacked upland or German refugee whites opposed to secession. Thus its Republican Party between 1872 and 1888 was entirely dependent upon black votes, as one can see from the fact that so late as the landmark court case of Smith v. Allwright, half of Florida’s registered Republicans were still black[1] – although very few blacks in Florida had ever voted within the previous fifty-five years. Thus this disfranchisement of blacks and poor whites by a poll tax introduced in 1889[2] left Florida as devoid of Republican adherents as Louisiana, Mississippi or South Carolina.[3]
Immigration of northerners into the previously undeveloped areas of South Florida, along with fierce anti-Catholicism in the northern Piney Woods, did give Herbert Hoover a freakish victory in 1928,[4] but apart from that the Democratic Party lost only six counties at a presidential level between 1892 and 1944.[5]
Things began to change in the late 1940s, as new migrants from traditionally Republican northern states in Central Florida took their Republican voting habits with them at the presidential level,[6] restricting Harry Truman to under half the statewide vote in 1948 and allowing Dwight D. Eisenhower and Richard Nixon to carry the state in the following three elections. The GOP reached over seventy percent in the retirement areas of the southwest coast, and its success was greatest in areas which had historically not had plantation agriculture and favoured little or no economic regulation.[7] In contrast, North Florida’s Piney Woods had remained loyal to the Democratic Party at all levels despite the 1960 Presidential ticket being headed by another Roman Catholic in John F. Kennedy.
Between the 1960 and 1964 elections, North Florida was severely affected by civil rights protests, especially over school and university integration.[8] Contrariwise, the retirement communities further south that had become powerfully Republican in presidential elections over the previous fifteen years were extremely hostile to GOP nominee Barry Goldwater’s desire to privatize Social Security.[9]
Vote
The two contrasting trends noted previously produced a major reversal in the voting patterns from the previous four presidential elections: indeed at a county level there was essentially zero correlation between 1960 and 1964 party percentages,[10] and as many as 43% of voters switched parties.[11]
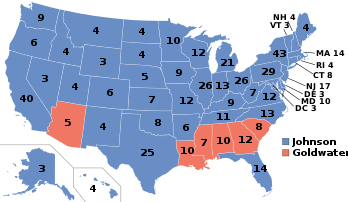
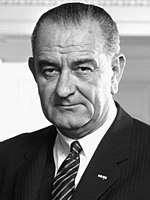
Incumbent President Lyndon Johnson overall won Florida against Goldwater by 42,599 votes, a margin of 2.30%, or a swing of 5.32% from the 1960 result. Increased registration of black voters – it had reached 51% by the time of the election – was crucial to Johnson regaining Florida: in the northern counties of Lafayette and Liberty where no blacks were registered, swings toward Goldwater reached over 100 percentage points.[12]
Florida was the second-closest state win by Johnson after Idaho.[13] As of the 2016 presidential election, this is the last election in which the Democratic candidate carried Charlotte County.[14]
Results
| 1964 United States presidential election in Florida[13] | ||||||||
|---|---|---|---|---|---|---|---|---|
| Party | Candidate | Running mate | Popular vote | Electoral vote | ||||
| Count | % | Count | % | |||||
| Democratic | Lyndon Baines Johnson of Texas | Hubert Horatio Humphrey of Minnesota | 948,540 | 51.15% | 14 | 100.00% | ||
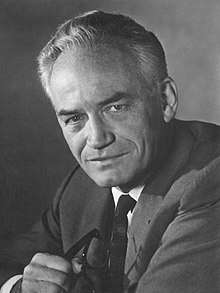
| Republican | Barry Goldwater of Arizona | William E. Miller of New York | 905,941 | 48.85% | 0 | 0.00% | ||
| Total | 1,854,841 | 100.00% | 14 | 100.00% | ||||
Results by county
| County | Lyndon Baines Johnson Democratic |
Barry Morris Goldwater Republican |
Margin | Total votes cast | |||
|---|---|---|---|---|---|---|---|
| # | % | # | % | # | % | ||
| Alachua | 13,483 | 54.73% | 11,151 | 45.27% | 2,332 | 9.47% | 24,634 |
| Baker | 1,137 | 50.35% | 1,121 | 49.65% | 16 | 0.71% | 2,258 |
| Bay | 7,846 | 37.91% | 12,849 | 62.09% | -5,003 | -24.17% | 20,695 |
| Bradford | 2,320 | 53.87% | 1,987 | 46.13% | 333 | 7.73% | 4,307 |
| Brevard | 24,833 | 50.29% | 24,551 | 49.71% | 282 | 0.57% | 49,384 |
| Broward | 68,406 | 44.51% | 85,264 | 55.49% | -16,858 | -10.97% | 153,670 |
| Calhoun | 980 | 35.34% | 1,793 | 64.66% | -813 | -29.32% | 2,773 |
| Charlotte | 4,831 | 53.71% | 4,163 | 46.29% | 668 | 7.43% | 8,994 |
| Citrus | 2,521 | 51.98% | 2,329 | 48.02% | 192 | 3.96% | 4,850 |
| Clay | 3,114 | 45.01% | 3,805 | 54.99% | -691 | -9.99% | 6,919 |
| Collier | 2,877 | 44.55% | 3,581 | 55.45% | -704 | -10.90% | 6,458 |
| Columbia | 3,249 | 43.94% | 4,145 | 56.06% | -896 | -12.12% | 7,394 |
| Dade | 208,941 | 64.01% | 117,480 | 35.99% | 91,461 | 28.02% | 326,421 |
| DeSoto | 1,777 | 47.22% | 1,986 | 52.78% | -209 | -5.55% | 3,763 |
| Dixie | 923 | 50.41% | 908 | 49.59% | 15 | 0.82% | 1,831 |
| Duval | 79,365 | 49.45% | 81,116 | 50.55% | -1,751 | -1.09% | 160,481 |
| Escambia | 25,371 | 43.91% | 32,414 | 56.09% | -7,043 | -12.19% | 57,785 |
| Flagler | 940 | 56.69% | 718 | 43.31% | 222 | 13.39% | 1,658 |
| Franklin | 1,366 | 49.05% | 1,419 | 50.95% | -53 | -1.90% | 2,785 |
| Gadsden | 4,556 | 46.67% | 5,207 | 53.33% | -651 | -6.67% | 9,763 |
| Gilchrist | 711 | 56.83% | 540 | 43.17% | 171 | 13.67% | 1,251 |
| Glades | 441 | 44.91% | 541 | 55.09% | -100 | -10.18% | 982 |
| Gulf | 1,659 | 45.33% | 2,001 | 54.67% | -342 | -9.34% | 3,660 |
| Hamilton | 1,302 | 52.93% | 1,158 | 47.07% | 144 | 5.85% | 2,460 |
| Hardee | 1,908 | 45.12% | 2,321 | 54.88% | -413 | -9.77% | 4,229 |
| Hendry | 1,352 | 45.04% | 1,650 | 54.96% | -298 | -9.93% | 3,002 |
| Hernando | 2,320 | 49.82% | 2,337 | 50.18% | -17 | -0.37% | 4,657 |
| Highlands | 4,233 | 47.14% | 4,747 | 52.86% | -514 | -5.72% | 8,980 |
| Hillsborough | 71,289 | 58.48% | 50,616 | 41.52% | 20,673 | 16.96% | 121,905 |
| Holmes | 1,193 | 27.00% | 3,225 | 73.00% | -2,032 | -45.99% | 4,418 |
| Indian River | 5,122 | 45.28% | 6,191 | 54.72% | -1,069 | -9.45% | 11,313 |
| Jackson | 4,386 | 38.31% | 7,064 | 61.69% | -2,678 | -23.39% | 11,450 |
| Jefferson | 1,504 | 47.18% | 1,684 | 52.82% | -180 | -5.65% | 3,188 |
| Lafayette | 545 | 45.68% | 648 | 54.32% | -103 | -8.63% | 1,193 |
| Lake | 7,773 | 37.61% | 12,897 | 62.39% | -5,124 | -24.79% | 20,670 |
| Lee | 10,204 | 44.19% | 12,886 | 55.81% | -2,682 | -11.62% | 23,090 |
| Leon | 10,927 | 41.85% | 15,181 | 58.15% | -4,254 | -16.29% | 26,108 |
| Levy | 1,986 | 55.69% | 1,580 | 44.31% | 406 | 11.39% | 3,566 |
| Liberty | 377 | 29.29% | 910 | 70.71% | -533 | -41.41% | 1,287 |
| Madison | 2,121 | 42.91% | 2,822 | 57.09% | -701 | -14.18% | 4,943 |
| Manatee | 13,074 | 43.26% | 17,147 | 56.74% | -4,073 | -13.48% | 30,221 |
| Marion | 9,112 | 45.58% | 10,879 | 54.42% | -1,767 | -8.84% | 19,991 |
| Martin | 3,621 | 45.76% | 4,292 | 54.24% | -671 | -8.48% | 7,913 |
| Monroe | 8,936 | 64.86% | 4,842 | 35.14% | 4,094 | 29.71% | 13,778 |
| Nassau | 2,781 | 47.02% | 3,134 | 52.98% | -353 | -5.97% | 5,915 |
| Okaloosa | 7,890 | 44.20% | 9,961 | 55.80% | -2,071 | -11.60% | 17,851 |
| Okeechobee | 1,016 | 43.57% | 1,316 | 56.43% | -300 | -12.86% | 2,332 |
| Orange | 38,248 | 43.90% | 48,884 | 56.10% | -10,636 | -12.21% | 87,132 |
| Osceola | 3,531 | 43.88% | 4,516 | 56.12% | -985 | -12.24% | 8,047 |
| Palm Beach | 43,836 | 46.91% | 49,614 | 53.09% | -5,778 | -6.18% | 93,450 |
| Pasco | 8,135 | 51.68% | 7,606 | 48.32% | 529 | 3.36% | 15,741 |
| Pinellas | 98,381 | 55.02% | 80,414 | 44.98% | 17,967 | 10.05% | 178,795 |
| Polk | 29,355 | 44.98% | 35,906 | 55.02% | -6,551 | -10.04% | 65,261 |
| Putnam | 4,995 | 49.62% | 5,072 | 50.38% | -77 | -0.76% | 10,067 |
| St. Johns | 4,357 | 36.90% | 7,450 | 63.10% | -3,093 | -26.20% | 11,807 |
| St. Lucie | 7,748 | 51.82% | 7,204 | 48.18% | 544 | 3.64% | 14,952 |
| Santa Rosa | 3,570 | 37.37% | 5,983 | 62.63% | -2,413 | -25.26% | 9,553 |
| Sarasota | 13,937 | 38.87% | 21,917 | 61.13% | -7,980 | -22.26% | 35,854 |
| Seminole | 9,125 | 47.52% | 10,078 | 52.48% | -953 | -4.96% | 19,203 |
| Sumter | 2,259 | 58.07% | 1,631 | 41.93% | 628 | 16.14% | 3,890 |
| Suwannee | 2,393 | 44.36% | 3,002 | 55.64% | -609 | -11.29% | 5,395 |
| Taylor | 1,708 | 39.09% | 2,661 | 60.91% | -953 | -21.81% | 4,369 |
| Union | 740 | 51.03% | 710 | 48.97% | 30 | 2.07% | 1,450 |
| Volusia | 34,901 | 58.28% | 24,988 | 41.72% | 9,913 | 16.55% | 59,889 |
| Wakulla | 753 | 37.22% | 1,270 | 62.78% | -517 | -25.56% | 2,023 |
| Walton | 2,449 | 39.49% | 3,753 | 60.51% | -1,304 | -21.03% | 6,202 |
| Washington | 1,500 | 35.50% | 2,725 | 64.50% | -1,225 | -28.99% | 4,225 |
| Totals | 948,540 | 51.15% | 905,941 | 48.85% | 42,599 | 2.30% | 1,854,481 |
References
- See Price, Hugh Douglas; ‘The Negro and Florida Politics, 1944-1954’; The Journal of Politics, Vol. 17, No. 2 (May, 1955), pp. 198-220
- Silbey, Joel H. and Bogue, Allan G.; The History of American Electoral Behavior, p. 210 ISBN 140087114X
- Phillips, Kevin P.; The Emerging Republican Majority, pp. 208, 210 ISBN 9780691163246
- Phillips; The Emerging Republican Majority; pp. 212-214
- Menendez, Albert J.; The Geography of Presidential Elections in the United States, 1868-2004, p. 164-165 ISBN 0786422173
- Seagull, Louis M.; Southern Republicanism, p. 73 ISBN 0470768762
- Doherty, Herbert J. (junior); ‘Liberal and Conservative Politics in Florida’; The Journal of Politics, nol. 14, no. 3 (August 1952), pp. 403-417
- Encyclopedia of African American History: 5-Volume Set, p. 228 ISBN 0195167791
- Phillips; The Emerging Republican Majority, p. 224
- Lamis, Alexander P.; The Two-Party South, p. 180 ISBN 0195065794
- Gimpel, James Graydon and Schuknecht, Jason E.; Patchwork Nation: Sectionalism and Political Change in American Politics; pp. 102-103 ISBN 0472022911
- Bullock, Charles S. and Gaddie, Ronald Keith; The Triumph of Voting Rights in the South, p. 254 ISBN 0806185309
- Leip, David. "Dave Leip's Atlas of U.S. Presidential Elections". uselectionatlas.org. Retrieved 2017-04-07.
- Sullivan, Robert David; ‘How the Red and Blue Map Evolved Over the Past Century’; America Magazine in The National Catholic Review; June 29, 2016