1964 United States presidential election in Maryland
The 1964 United States presidential election in Maryland took place on November 3, 1964, as part of the 1964 United States presidential election. Maryland voters chose 10[2] representatives, or electors, to the Electoral College, who voted for president and vice president.
| ||||||||||||||||||||||||||
| ||||||||||||||||||||||||||
 County Results
| ||||||||||||||||||||||||||
| ||||||||||||||||||||||||||
| Elections in Maryland | ||||||||
|---|---|---|---|---|---|---|---|---|
.svg.png) | ||||||||
|
||||||||
|
||||||||
|
Elections by year |
||||||||
|
| ||||||||
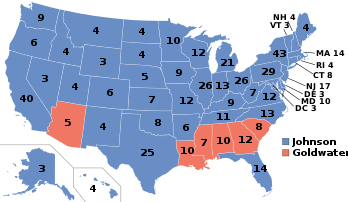
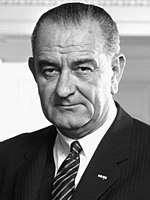
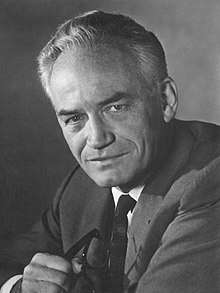
Maryland was won by incumbent President Lyndon B. Johnson (D–Texas), with 65.47% of the popular vote, against Senator Barry Goldwater (R–Arizona), with 34.53% of the popular vote.[3][4] As of the 2016 presidential election, this is the last election in which Harford County, Frederick County, Carroll County, Washington County, Wicomico County, Worcester County, Queen Anne's County, Talbot County, and Caroline County voted for a Democratic Presidential candidate.[5] Anne Arundel County would not vote Democratic again until 2016.[5]
Results
| 1964 United States presidential election in Maryland[3] | ||||||
|---|---|---|---|---|---|---|
| Party | Candidate | Running mate | Votes | Percentage | Electoral votes | |
| Democratic | Lyndon B. Johnson | Hubert Humphrey | 730,912 | 65.47% | 10 | |
| Republican | Barry Goldwater | William E. Miller | 385,495 | 34.53% | 0 | |
Results by county
| County | Lyndon Baines Johnson Democratic |
Barry Morris Goldwater Republican |
Margin | Total votes cast[6] | |||
|---|---|---|---|---|---|---|---|
| # | % | # | % | # | % | ||
| Allegany | 20,425 | 62.25% | 12,384 | 37.75% | 8,041 | 24.51% | 32,809 |
| Anne Arundel | 37,981 | 58.70% | 26,725 | 41.30% | 11,256 | 17.40% | 64,706 |
| Baltimore County | 117,153 | 60.07% | 77,870 | 39.93% | 39,283 | 20.14% | 195,023 |
| Baltimore City | 240,716 | 75.98% | 76,089 | 24.02% | 164,627 | 51.96% | 316,805 |
| Calvert | 3,335 | 65.39% | 1,765 | 34.61% | 1,570 | 30.78% | 5,100 |
| Caroline | 3,710 | 57.91% | 2,696 | 42.09% | 1,014 | 15.83% | 6,406 |
| Carroll | 8,451 | 50.35% | 8,332 | 49.65% | 119 | 0.71% | 16,783 |
| Cecil | 7,854 | 59.57% | 5,330 | 40.43% | 2,524 | 19.14% | 13,184 |
| Charles | 6,546 | 65.45% | 3,455 | 34.55% | 3,091 | 30.91% | 10,001 |
| Dorchester | 4,564 | 46.14% | 5,327 | 53.86% | -763 | -7.71% | 9,891 |
| Frederick | 14,548 | 61.10% | 9,264 | 38.90% | 5,284 | 22.19% | 23,812 |
| Garrett | 3,515 | 49.24% | 3,624 | 50.76% | -109 | -1.53% | 7,139 |
| Harford | 13,550 | 57.62% | 9,968 | 42.38% | 3,582 | 15.23% | 23,518 |
| Howard | 8,185 | 54.50% | 6,833 | 45.50% | 1,352 | 9.00% | 15,018 |
| Kent | 4,113 | 67.19% | 2,008 | 32.81% | 2,105 | 34.39% | 6,121 |
| Montgomery | 103,113 | 66.24% | 52,554 | 33.76% | 50,559 | 32.48% | 155,667 |
| Prince George's | 81,806 | 63.80% | 46,413 | 36.20% | 35,393 | 27.60% | 128,219 |
| Queen Anne's | 4,052 | 67.45% | 1,955 | 32.55% | 2,097 | 34.91% | 6,007 |
| Somerset | 4,527 | 58.93% | 3,155 | 41.07% | 1,372 | 17.86% | 7,682 |
| St. Mary's | 5,831 | 66.95% | 2,878 | 33.05% | 2,953 | 33.91% | 8,709 |
| Talbot | 4,671 | 55.85% | 3,693 | 44.15% | 978 | 11.69% | 8,364 |
| Washington | 19,858 | 60.89% | 12,756 | 39.11% | 7,102 | 21.78% | 32,614 |
| Wicomico | 8,695 | 53.86% | 7,448 | 46.14% | 1,247 | 7.72% | 16,143 |
| Worcester | 3,713 | 55.53% | 2,973 | 44.47% | 740 | 11.07% | 6,686 |
| Totals | 730,912 | 65.47% | 385,495 | 34.53% | 345,417 | 30.94% | 1,116,407 |
References
- "United States Presidential election of 1964 - Encyclopædia Britannica". Retrieved May 30, 2017.
- "1964 Election for the Forty-Fifth Term (1965-69)". Retrieved May 30, 2017.
- Maryland Manual 1965–1966. The Hall of Records Commission of the State of Maryland. p. 477. Retrieved May 12, 2019.
- "The American Presidency Project - Election of 1964". Retrieved May 30, 2017.
- Sullivan, Robert David; ‘How the Red and Blue Map Evolved Over the Past Century’; America Magazine in The National Catholic Review; June 29, 2016
- Scammon, Richard M. (compiler); America at the Polls: A Handbook of Presidential Election Statistics 1920-1964; p. 211 ISBN 0405077114