Grant County, Indiana
Grant County is a county in central Indiana in the United States Midwest. At the time of the 2010 census, the population was 70,061.[1] The county seat is Marion.[2] Important paleontological discoveries, dating from the Pliocene epoch, have been made at the Pipe Creek Sinkhole in Grant County.
Grant County | |
|---|---|
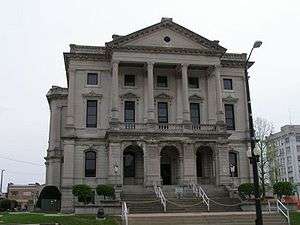 Grant County Courthouse in Marion | |
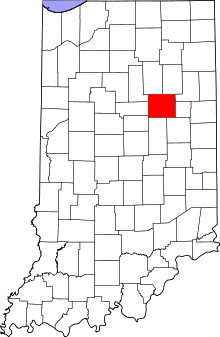 Location within the U.S. state of Indiana | |
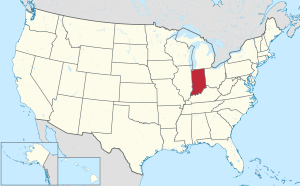 Indiana's location within the U.S. | |
| Coordinates: 40°31′N 85°39′W | |
| Country | |
| State | |
| Founded | 1831 |
| Named for | Samuel and Moses Grant |
| Seat | Marion |
| Largest city | Marion |
| Area | |
| • Total | 414.90 sq mi (1,074.6 km2) |
| • Land | 414.07 sq mi (1,072.4 km2) |
| • Water | 0.82 sq mi (2.1 km2) 0.20%% |
| Population | |
| • Estimate (2018) | 65,936 |
| • Density | 159/sq mi (61.4/km2) |
| Time zone | UTC−5 (Eastern) |
| • Summer (DST) | UTC−4 (EDT) |
| Congressional district | 5th |
| Website | www |
| Indiana county number 27 | |
History
Grant County was formed in 1831 by settlers from Kentucky and Virginia. It was named for Captains Samuel and Moses Grant of Kentucky, who were killed fighting indigenous warriors north of the Ohio River.[3] Their home county was also named for them, Grant County, Kentucky.
In 1831, Martin Boots and David Branson each donated 30 acres of land to begin a settlement called Marion. This land was on the north side of a fast-flowing and scenic river which the Miami Indians called Mississinewa. Marion was designated as the County Seat.[4]
As the county was developed for agriculture, the county seat became a center of trade and business, as well as government and the court system. On 7 August 1930, a mob of an estimated 5,000 people took three African-American men, Thomas Shipp and Abram Smith, both 19, and James Cameron, 16, from the county jail. They were suspects in a robbery/murder and rape. The first two were hanged from trees in the courthouse square. Cameron was spared and later became a civil rights activist. This was the last lynching in Indiana.[5]
In 1982, Stephen Johnson was elected as Grant County's first full-time prosecutor. He served for five terms, from 1983 through 2002.
Geography
Grant County consists of low rolling hills, covered with vegetation and devoted to agriculture or urban development.[6] The Mississinewa River flows northwesterly through the center of the county toward Mississinewa Lake in adjacent Miami County. The highest terrain consists of two rises in southeast Upland, at 950' (290m) ASL.[7] According to the 2010 census, the county has a total area of 414.90 square miles (1,074.6 km2), of which 414.07 square miles (1,072.4 km2) (or 99.80%) is land and 0.82 square miles (2.1 km2) (or 0.20%) is water.[8]

Adjacent counties
- Huntington County - northeast
- Wells County - northeast
- Blackford County - east
- Delaware County - southeast
- Madison County - south
- Tipton County - southwest
- Howard County - west
- Miami County - northwest
- Wabash County - northwest
Climate and weather
| Marion, Indiana | ||||||||||||||||||||||||||||||||||||||||||||||||||||||||||||
|---|---|---|---|---|---|---|---|---|---|---|---|---|---|---|---|---|---|---|---|---|---|---|---|---|---|---|---|---|---|---|---|---|---|---|---|---|---|---|---|---|---|---|---|---|---|---|---|---|---|---|---|---|---|---|---|---|---|---|---|---|
| Climate chart (explanation) | ||||||||||||||||||||||||||||||||||||||||||||||||||||||||||||
| ||||||||||||||||||||||||||||||||||||||||||||||||||||||||||||
| ||||||||||||||||||||||||||||||||||||||||||||||||||||||||||||
In recent years, average temperatures in Marion have ranged from a low of 16 °F (−9 °C) in January to a high of 85 °F (29 °C) in July, although a record low of −23 °F (−31 °C) was recorded in January 1985 and a record high of 108 °F (42 °C) was recorded in July 1936. Average monthly precipitation ranged from 2.03 inches (52 mm) in February to 4.73 inches (120 mm) in July.[9]
Government
The county government is a constitutional body, granted specific powers by the Constitution of Indiana and the Indiana Code.
County Council: The legislative branch of the county government; controls spending and revenue collection in the county. Representatives, elected to four-year terms from county districts, are responsible for setting salaries, the annual budget, and special spending. The council also has limited authority to impose local taxes, in the form of an income and property tax that is subject to state level approval, excise taxes, and service taxes.[10][11]
Board of Commissioners: The executive body of the county; commissioners are elected county-wide to staggered four-year terms. One commissioner serves as president. The commissioners are charged with executing the acts legislated by the council, collecting revenue, and managing the day-to-day functions of the county government.[10][11]
Court: The county maintains a small claims court that can handle some civil cases. The judge on the court is elected to a term of four years and must be a member of the Indiana Bar Association. The judge is assisted by a constable who is also elected to a four-year term. In some cases, court decisions can be appealed to the state level circuit court.[11]
County Officials: The county has several other elected offices, including sheriff, coroner, auditor, treasurer, recorder, surveyor and circuit court clerk, electded to four-year terms. Members elected to county government positions are required to declare party affiliations and to be residents of the county.[11]
Grant County is part of Indiana's 5th congressional district; Indiana Senate districts 17, 19 and 21;[12] and Indiana House of Representatives districts 31, 32 and 82.[13]
| Year | Republican | Democratic | Third parties |
|---|---|---|---|
| 2016 | 66.5% 17,008 | 27.4% 7,010 | 6.1% 1,554 |
| 2012 | 59.8% 15,151 | 37.9% 9,589 | 2.3% 589 |
| 2008 | 55.9% 14,734 | 42.9% 11,293 | 1.2% 317 |
| 2004 | 68.4% 18,769 | 31.0% 8,509 | 0.7% 182 |
| 2000 | 61.2% 16,153 | 36.8% 9,712 | 2.0% 521 |
| 1996 | 50.8% 13,443 | 37.1% 9,818 | 12.2% 3,217 |
| 1992 | 48.0% 13,806 | 32.1% 9,211 | 19.9% 5,721 |
| 1988 | 62.8% 18,441 | 36.8% 10,799 | 0.5% 131 |
| 1984 | 66.8% 20,482 | 32.6% 9,986 | 0.7% 205 |
| 1980 | 61.7% 19,078 | 33.6% 10,390 | 4.7% 1,441 |
| 1976 | 55.1% 16,847 | 44.1% 13,468 | 0.8% 239 |
| 1972 | 72.4% 20,969 | 27.3% 7,912 | 0.3% 77 |
| 1968 | 52.5% 16,170 | 35.5% 10,938 | 12.1% 3,718 |
| 1964 | 45.2% 14,688 | 54.1% 17,574 | 0.7% 232 |
| 1960 | 57.9% 19,021 | 41.5% 13,642 | 0.5% 178 |
| 1956 | 64.5% 17,548 | 34.8% 9,455 | 0.8% 203 |
| 1952 | 59.7% 16,678 | 38.1% 10,646 | 2.2% 599 |
| 1948 | 50.3% 13,138 | 46.8% 12,212 | 2.9% 765 |
| 1944 | 55.1% 14,527 | 41.8% 11,031 | 3.1% 821 |
| 1940 | 52.8% 15,187 | 46.1% 13,257 | 1.2% 335 |
| 1936 | 44.8% 11,774 | 52.0% 13,655 | 3.2% 831 |
| 1932 | 43.9% 11,398 | 51.6% 13,390 | 4.5% 1,173 |
| 1928 | 66.0% 14,659 | 32.7% 7,273 | 1.3% 284 |
| 1924 | 55.1% 11,173 | 35.0% 7,086 | 10.0% 2,017 |
| 1920 | 55.1% 12,349 | 35.3% 7,900 | 9.6% 2,156 |
| 1916 | 43.4 6,059 | 41.7% 5,827 | 14.9% 2,081 |
| 1912 | 30.2% 3,939 | 33.7% 4,390 | 36.1% 4,707[15] |
| 1908 | 49.4% 7,181 | 40.1% 5,819 | 10.5% 1,531 |
| 1904 | 58.3% 9,550 | 28.5% 4,668 | 13.2% 2,170 |
| 1900 | 57.8% 8,832 | 34.8% 5,312 | 7.5% 1,140 |
| 1896 | 59.0% 7,723 | 38.7% 5,072 | 2.3% 305 |
| 1892 | 52.2% 4,916 | 38.1% 3,590 | 9.7% 909 |
| 1888 | 53.9% 3,929 | 41.0% 2,990 | 5.1% 374 |
Demographics
| Historical population | |||
|---|---|---|---|
| Census | Pop. | %± | |
| 1840 | 4,875 | — | |
| 1850 | 11,092 | 127.5% | |
| 1860 | 15,797 | 42.4% | |
| 1870 | 18,487 | 17.0% | |
| 1880 | 23,618 | 27.8% | |
| 1890 | 31,493 | 33.3% | |
| 1900 | 54,693 | 73.7% | |
| 1910 | 51,426 | −6.0% | |
| 1920 | 51,353 | −0.1% | |
| 1930 | 51,066 | −0.6% | |
| 1940 | 55,813 | 9.3% | |
| 1950 | 62,156 | 11.4% | |
| 1960 | 75,741 | 21.9% | |
| 1970 | 83,955 | 10.8% | |
| 1980 | 80,934 | −3.6% | |
| 1990 | 74,169 | −8.4% | |
| 2000 | 73,403 | −1.0% | |
| 2010 | 70,061 | −4.6% | |
| Est. 2018 | 65,936 | [16] | −5.9% |
| US Decennial Census[17] 1790-1960[18] 1900-1990[19] 1990-2000[20] 2010-2013[1] | |||
2010 United States Census
As of the 2010 United States Census, there were 70,061 people, 27,245 households, and 18,000 families in the county.[8] The population density was 169.2 inhabitants per square mile (65.3/km2). There were 30,443 housing units at an average density of 73.5 per square mile (28.4/km2).[21] The racial makeup of the county was 88.2% white, 7.0% black or African American, 0.6% Asian, 0.3% American Indian, 1.4% from other races, and 2.4% from two or more races. Those of Hispanic or Latino origin made up 3.6% of the population.[8] In terms of ancestry, 19.5% were German, 12.4% were American, 10.0% were Irish, and 9.0% were English.[22]
Of the 27,245 households, 29.4% had children under the age of 18 living with them, 48.0% were married couples living together, 13.4% had a female householder with no husband present, 33.9% were non-families, and 28.8% of all households were made up of individuals. The average household size was 2.39 and the average family size was 2.89. The median age was 39.5 years.[8]
The median income for a household in the county was $47,697 and the median income for a family was $49,860. Males had a median income of $40,146 versus $28,588 for females. The per capita income for the county was $19,792. About 12.0% of families and 17.0% of the population were below the poverty line, including 25.0% of those under age 18 and 9.4% of those age 65 or over.[23]
Localities
Unincorporated communities
References
- "Grant County QuickFacts". US Census Bureau. Archived from the original on 7 June 2011. Retrieved 17 September 2011.
- "Find a County". National Association of Counties. Archived from the original on 31 May 2011. Retrieved 7 June 2011.
- Gannett, Henry (1905). The Origin of Certain Place Names in the United States. Govt. Print. Off. p. 14.
- Grant County History, Grant County website
- David Bradley, "Anatomy of a Murder", The Nation, 24 May 2006; accessed 1 June 2018.
- Grant County IN (Google Maps, accessed 20 January 2020)
- Grant County High Point, Indiana (PeakBagger.com, accessed 20 January 2020)
- "Profile of General Population and Housing Characteristics: 2010 Demographic Profile Data". US Census Bureau. Archived from the original on 13 February 2020. Retrieved 10 July 2015.
- "Monthly Averages for Marion IN". The Weather Channel. Retrieved 27 January 2011.
- Indiana Code. "Title 36, Article 2, Section 3". IN.gov. Retrieved 16 September 2008.
- Indiana Code. "Title 2, Article 10, Section 2" (PDF). IN.gov. Retrieved 16 September 2008.
- "Indiana Senate Districts". State of Indiana. Retrieved 14 July 2011.
- "Indiana House Districts". State of Indiana. Retrieved 14 July 2011.
- Leip, David. "Atlas of US Presidential Elections". uselectionatlas.org. Retrieved 9 April 2018.
- The leading "other" candidate, Progressive Theodore Roosevelt, received 2,185 votes, while Socialist candidate Eugene Debs received 1,323 votes, Prohibition candidate Eugene Chafin received 1,015 votes, and Socialist Labor candidate Arthur Reimer received 184 votes.
- "Population and Housing Unit Estimates". Retrieved 26 July 2019.
- "US Decennial Census". US Census Bureau. Retrieved 10 July 2014.
- "Historical Census Browser". University of Virginia Library. Retrieved 10 July 2014.
- "Population of Counties by Decennial Census: 1900 to 1990". US Census Bureau. Retrieved 10 July 2014.
- "Census 2000 PHC-T-4. Ranking Tables for Counties: 1990 and 2000" (PDF). US Census Bureau. Retrieved 10 July 2014.
- "Population, Housing Units, Area, and Density: 2010 - County". US Census Bureau. Archived from the original on 12 February 2020. Retrieved 10 July 2015.
- "Selected Social Characteristics in the US – 2006-2010 American Community Survey 5-Year Estimates". US Census Bureau. Archived from the original on 14 February 2020. Retrieved 10 July 2015.
- "Selected Economic Characteristics – 2006-2010 American Community Survey 5-Year Estimates". US Census Bureau. Archived from the original on 14 February 2020. Retrieved 10 July 2015.
Places adjacent to Grant County, Indiana | ||||||||||
|---|---|---|---|---|---|---|---|---|---|---|
| ||||||||||
Municipalities and communities of Grant County, Indiana, United States | ||
|---|---|---|
| Cities | Map of Indiana highlighting Grant County | |
| Towns | ||
| Townships | ||
| CDPs | ||
| Unincorporated communities | ||
| Footnotes | ‡This populated place also has portions in an adjacent county or counties | |

| Authority control |
|
|---|