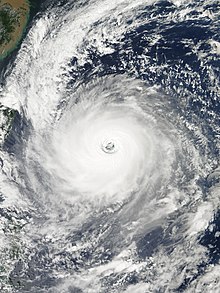
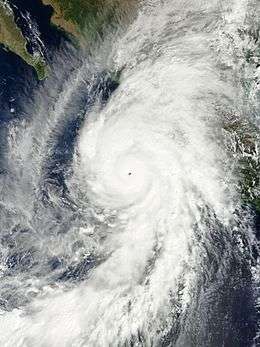
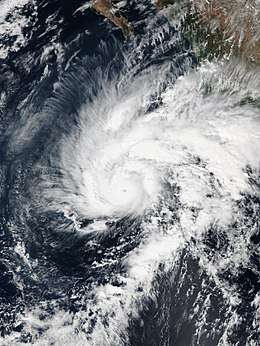
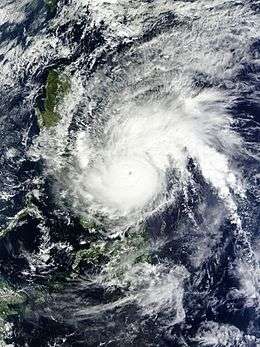
Tropical cyclones in 2015
During 2015, tropical cyclones formed within seven different tropical cyclone basins, located within various parts of the Atlantic, Pacific and Indian Oceans. During the year, a total of 133 tropical cyclones had formed this year to date. 92 tropical cyclones had been named by either a Regional Specialized Meteorological Center (RSMC) or a Tropical Cyclone Warning Center (TCWC).
| Tropical cyclones in 2015 | |
|---|---|
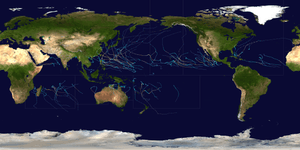 Year summary map | |
| Year boundaries | |
| First system | 05U |
| Formed | January 2, 2015 |
| Last system | Ula |
| Dissipated | January 12, 2016 |
| Strongest system | |
| Name | Patricia |
| Lowest pressure | 872 mbar/hPa; 25.75 inHg |
| Longest lasting system | |
| Name | Kilo |
| Duration | 21 days |
| Year statistics | |
| Total systems | 133 |
| Named systems | 92 |
| Total fatalities | 980 total |
| Total damage | $15.02 billion (2015 USD) |
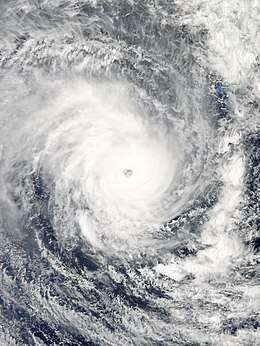
The most active basin in the year was the Eastern Pacific which documented 26 named systems, was its basin's most active since 1992, despite only amounting to 25 named systems in the Western Pacific. Conversely, both the North Atlantic hurricane and North Indian Ocean cyclone seasons experienced the fewest cyclones reaching tropical storm intensity in recorded history, numbering 11 and 4, respectively. Activity across the southern hemisphere's three basins—South-West Indian, Australian, and South Pacific—was spread evenly, with each region recording seven named storms apiece. That hemisphere's strongest tropical cyclone was Cyclone Pam, which bottomed out with a barometric pressure of 896 mbar (hPa; 26.46 inHg) in the South-Pacific Ocean.
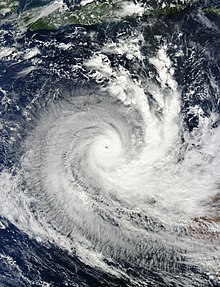
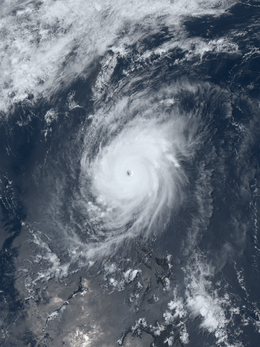
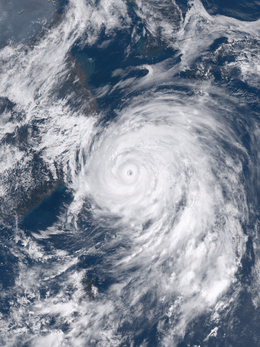
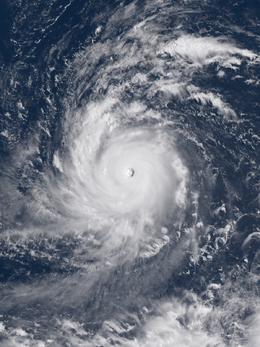
The strongest of these tropical cyclones was Hurricane Patricia, which strengthened to a minimum barometric pressure of 872 mbar (hPa; 25.75 inHg) before striking the east coast of Colima in Mexico. The costliest tropical cyclone of the year was Typhoon Mujigae, which struck in China area in October, causing US$4.25 billion in damage. Cyclone Komen was also the year's deadliest storm, killing 280 people primarily in Southeast India.
Global atmospheric and hydrological conditions
North Atlantic Ocean
In the North Atlantic Ocean, atmospheric and hydrological conditions were generally unfavorable for tropical cyclogenesis for the 2014-16 El Niño event. In the tropical Atlantic, sea surface temperatures were cooler than average, characteristic of a negative phase of the Atlantic Multidecadal Oscillation (AMO). Additionally, high quantities of Saharan dust along with stronger than average upper-level wind shear over the tropical Atlantic created an unfavorable atmospheric environment. Despite the unfavorable conditions present, activity in the tropical Atlantic was plentiful.
Eastern Pacific Ocean
Summary
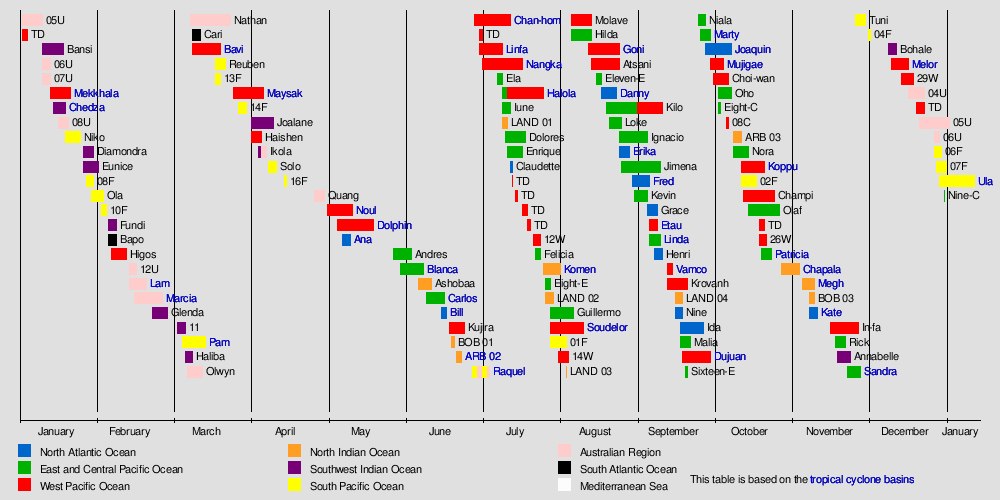
Systems
A total of 139 systems formed globally in 2015 with 52 of them causing significant damage, deaths, and/or setting records for their basin.
January
| Storm Name | Dates Active | Max wind km/h (mph) | Min pressure (mbar) | Areas Affected | Damage (USD) | Deaths | Refs |
|---|---|---|---|---|---|---|---|
| 05U | January 2–10 | Unspecified | Unspecified | Western Australia | Minimal | None | |
| TD | January 2–4 | Unspecified | 1006 | Borneo | None | None | |
| Bansi | January 10–18 | 220 (140) | 910 | Mascarene Islands | Minimal | None | |
| 06U | January 10–13 | Unspecified | Unspecified | None | None | None | |
| 07U | January 10–13 | 55 (35) | 998 | Solomon Islands | None | None | |
| Mekkhala (Amang) | January 13–21 | 110 (70) | 975 | Yap State, Philippines | $7.8 million | 3 | [1][2] |
| Chedza | January 14–19 | 110 (65) | 975 | Zimbabwe, Malawi, Mozambique, Madagascar, Réunion | $40 million | 80 | [3][4] |
| 08U | January 16–20 | 30 (15) | 1003 | Western Australia | None | None | |
| Niko | January 19–25 | 100 (65) | 982 | French Polynesia | Minimal | None | |
| Diamondra | January 26–30 | 85 (50) | 986 | None | None | None | |
| Eunice | January 26–February 1 | 230 (145) | 915 | None | None | None | |
| 08F | January 27–30 | Unspecified | 1000 | Wallis and Futuna, Samoan Islands | None | None | |
| Ola | January 29–February 3 | 150 (90) | 955 | New Caledonia, Lord Howe Island | None | None | |
February
| Storm Name | Dates Active | Max wind km/h (mph) | Min pressure (mbar) | Areas Affected | Damage (USD) | Deaths | Refs |
|---|---|---|---|---|---|---|---|
| 10F | February 2–4 | Unspecified | 1001 | Tuvalu | None | None | |
| Fundi | February 5–8 | 100 (65) | 978 | Madagascar | Unknown | 5 | |
| Bapo | February 5–8 | 65 (40) | 992 | None | None | None | |
| Higos | February 6–12 | 165 (105) | 940 | None | None | None | |
| 12U | February 13–16 | Unspecified | Unspecified | None | None | None | |
| Lam | February 13–20 | 185 (115) | 943 | Queensland, Northern Territory, Western Australia | $64.4 million | None | |
| Marcia | February 15–26 | 205 (125) | 930 | Queensland | $591 million | None | |
| Glenda | February 22–28 | 95 (60) | 974 | None | None | None | |
March
| Storm Name | Dates Active | Max wind km/h (mph) | Min pressure (mbar) | Areas Affected | Damage (USD) | Deaths | Refs |
|---|---|---|---|---|---|---|---|
| 11 | March 4–7 | 55 (35) | 998 | Mozambique, Madagascar | None | None | |
| Pam | March 6–15 | 250 (155) | 896 | Fiji, Kiribati, Solomon Islands, Tuvalu, Vanuatu, New Caledonia, New Zealand | $360 million | 16 | |
| Haliba | March 7–10 | 85 (50) | 993 | Madagascar, Réunion, Mauritius | $6.3 million | 26 | |
| Olwyn | March 8–14 | 145 (85) | 955 | Western Australia | $76.1 million | 1 | |
| Nathan | March 9–25 | 165 (105) | 963 | Queensland, Northern Territory, Western Australia | Major | None | |
| Cari | March 10–13 | 65 (40) | 998 | None | None | None | |
| Bavi (Betty) | March 10–21 | 85 (40) | 985 | Vietnam, China | $16.6 million | 9 | |
| Reuben | March 19–23 | 75 (45) | 990 | Fiji, Tonga | None | None | |
| 13F | March 19–21 | Unspecified | 1004 | French Polynesia | None | None | |
| Maysak (Chedeng) | March 26—April 7 | 195 (120) | 910 | Micronesia, Philippines | $8.5 million | 5 | |
| 14F | March 28–31 | 55 (35) | 998 | Southern Cook Islands | None | None | |
April
| Storm Name | Dates Active | Max wind km/h (mph) | Min pressure (mbar) | Areas Affected | Damage (USD) | Deaths | Refs |
|---|---|---|---|---|---|---|---|
| Joalane | April 2–11 | 140 (85) | 962 | None | None | None | |
| Haishen | April 2–6 | 65 (40) | 998 | Caroline Islands | $200 thousand | None | |
| Ikola | April 5–8 | 175 (110) | 953 | None | None | None | |
| Solo | April 9–12 | 100 (65) | 985 | Solomon Islands, New Caledonia | Significant | None | |
| 16F | April 15–16 | Unspecified | 1008 | None | None | None | |
| Quang | April 27—May 1 | 185 (115) | 950 | Western Australia | Minimal | None | |
| Katie | April 29—May 6 | 185 (115) | 933 | Easter Island, Chile | None | None | |
May
| Storm Name | Dates Active | Max wind km/h (mph) | Min pressure (mbar) | Areas Affected | Damage (USD) | Deaths | Refs |
|---|---|---|---|---|---|---|---|
| Noul (Dodong) | May 2–12 | 205 (125) | 920 | Caroline Islands, Taiwan, Philippines, Japan | $23.5 million | 2 | |
| Dolphin | May 6–20 | 185 (115) | 925 | Caroline Islands, Mariana Islands | $10 million | None | |
| Ana | May 8–11 | 95 (60)4 | 998 | Southeastern United States | Minimal | 2 | |
| Andres | May 28—June 4 | 230 (145)4 | 937 | Southwestern United States | None | None | |
| Blanca | May 31—June 9 | 230 (145)4 | 936 | Western Mexico, Baja California Peninsula, Southwestern United States | $133 thousand | 4 | |
June
| Storm Name | Dates Active | Max wind km/h (mph) | Min pressure (mbar) | Areas Affected | Damage (USD) | Deaths | Refs |
|---|---|---|---|---|---|---|---|
| Ashobaa | June 7–12 | 85 (50) | 990 | Oman, United Arab Emirates | Minimal | None | |
| Carlos | June 10–17 | 150 (90) | 978 | Southwestern Mexico, Western Mexico | $1.04 million | None | |
| Bill | June 16–18 | 95 (60) | 997 | Central America, Yucatán Peninsula, Southern United States (Texas), Midwestern United States | $100 million | 8 (1) | |
| Kujira | June 19–25 | 85 (50) | 985 | Vietnam, China | $16 million | 9 | |
| BOB 01 | June 20–21 | 45 (30) | 994 | East India | Minimal | 15 | |
| ARB 02 | June 22–24 | 55 (35) | 988 | West India | $260 million | 81 | |
| Raquel | June 28–July 5 | 65 (40) | 996 | Solomon Islands | Minimal | 1 | |
| Chan-hom (Falcon) | June 29–July 13 | 165 (105) | 935 | Mariana Islands, China, Taiwan, Korea, Russia | $1.58 billion | 18 |
July
| Storm Name | Dates Active | Max wind km/h (mph) | Min pressure (mbar) | Areas Affected | Damage (USD) | Deaths | Refs |
|---|---|---|---|---|---|---|---|
| TD | July 1–2 | Not specified | 1000 | Caroline Islands | None | None | |
| Linfa (Egay) | July 1–10 | 95 (60) | 980 | Philippines, Taiwan, China, Vietnam | $285 million | 1 | |
| Nangka | July 2–18 | 185 (115) | 925 | Marshall Islands, Caroline Islands, Mariana Islands, Japan | $200 million | 2 | |
| Ela | July 8–10 | 75 (45) | 1002 | None | None | None | |
| Halola (Goring) | July 10–26 | 150 (90) | 955 | Wake Island, Japan, Korea | $1.24 million | None | |
| Iune | July 10–13 | 65 (40) | 1004 | None | None | None | |
| LAND 01 | July 10–12 | 45 (30) | 994 | North India, Nepal | None | None | |
| Dolores | July 11–19 | 215 (130) | 946 | Southwestern Mexico, Western Mexico, Baja California Peninsula, Southwestern United States | $50.477 million | 1 | |
| Enrique | July 12–18 | 85 (50) | 1000 | None | None | None | |
| Claudette | July 13–14 | 85 (60) | 1003 | East Coast of the United States, Newfoundland | None | None | |
| TD | July 14 | Not specified | 1000 | None | None | None | |
| TD | July 15–16 | Not specified | 1000 | None | None | None | |
| TD | July 18–20 | Not specified | 1004 | Japan | None | None | |
| TD | July 20–21 | Not specified | 1000 | China | None | None | |
| 12W | July 22–25 | 65 (40) | 1008 | Philippines | None | None | |
| Felicia | July 23–25 | 65 (40) | 1004 | None | None | None | |
| Komen | July 26–August 2 | 75 (45) | 986 | Bangladesh, Myanmar, Northeastern India | $617 million | 187 | |
| Eight-E | July 27–29 | 55 (35) | 1006 | None | None | None | |
| LAND 02 | July 27–30 | 55 (35) | 994 | Central India | None | None | |
| Guillermo | July 29–August 7 | 175 (110) | 967 | Hawaii, Northern California | None | None | |
| Soudelor (Hanna) | July 29–August 11 | 215 (130) | 900 | Mariana Islands, Philippines, Taiwan, Ryukyu Islands, China, Korea, Japan | $4.09 billion | 59 | |
| 01F | July 29–August 4 | Not specified | 1000 | Solomon Islands, Vanuatu | None | None |
August
| Storm Name | Dates Active | Max wind km/h (mph) | Min pressure (mbar) | Areas Affected | Damage (USD) | Deaths | Refs |
|---|---|---|---|---|---|---|---|
| 12W | August
1—5 |
55 (35) | 1008 | Japan | None | None | |
| LAND 03 | August 4 | 45 (30) | 998 | Central India | None | None | |
| Molave | August
6—14 |
85 (50) | 985 | None | None | None | |
| Hilda | August
6—14 |
230 (145) | 937 | Hawaii | None | None | |
| Goni (Ineng) | August 13—25 | 185 (115) | 930 | Mariana Islands, Philippines, Taiwan Japan, Korea,China, Russia | $1.05 billion | 74 | |
| Atsani | August 14—25 | 185 (115) | 925 | Mariana Islands | Nonr | None | |
| Eleven-E | August 16—17 | 55 (35) | 1003 | None | None | None | |
| Danny | August 18—24 | 205 (125) | 960 | Lesser Antilles, Puerto Rico | Minimal | None | |
| Loke | August 21—26 | 120 (75) | 985 | Hawaii | None | None | |
| Kilo | August 22 — September 1 | 220 (140) | 940 | Hawaii, Johnston Atoll | None | None | |
| Ignacio | August 25 — September 5 | 230 (145) | 942 | Hawaii | None | None | |
| Erika | August
25—29 |
85 (50) | 1001 | Lesser Antilles, Greater Antilles, Florida | $511.4 million | 31 | |
| Jimena | August 26— September 9 | 250 (155) | 932 | None | None | None | |
| Fred | August 30 — September 6 | 140 (85) | 986 | West Africa, Cape Verde | $2.5 million | 9 | |
| Kevin | August 31 — September 5 | 95 (60) | 998 | Baja California Peninsula, Southwestern United States | None | None |
September
| Storm Name | Dates Active | Max wind km/h (mph) | Min pressure (mbar) | Areas Affected | Damage (USD) | Deaths | Refs |
|---|---|---|---|---|---|---|---|
| Grace | September 5—9 | 95 (60) | 1000 | None | None | None | |
| Linda | September 5—14 | 205 (125) | 950 | Sinaloa, Zacatecas, Southwestern United States | $2.59 million | 22 | |
| Etau | September 6—11 | 95 (60) | 985 | Japan, Russia | $2.41 billion |
8 | |
| Henry | September 8—11 | 85 (50) | 1003 | None | None | None | |
| Vamco | September 13—15 | 65 (40) | 998 | Vietnam, Laos, Cambodia, Thailand, Indochina | $14.1 million | 15 | |
| Krovanh | September 13—21 | 155 (100) | 945 | None | None | None | |
| Land 04 | September 16—19 | 55 (35) | 994 | Central India | |||
| Nine | September 16—19 | 55 (35) | 1006 | None | None | None | |
| Ida | September 18—27 | 85 (50) | 1001 | None | None | None | |
| Malia | September 18—22 | 85 (50) | 992 | Hawaii | None | None | |
| Dujuan (Jenny) | September 19—30 | 205 (125) | 925 | Mariana Islands, Taiwan, China | $407 million | 3 | |
| Sixteen-E | September 20—21 | 55 (35) | 1001 | Baja California Peninsula, Mexico, Southwestern United States | $17.8 million | 1 | |
| Niala | September 25—28 | 100 (65) | 992 | Hawaii | None | None | |
| Marty | September 26—30 | 130 (80) | 987 | Mexico | $30 million | None | |
| Joaquin | September 28 — October 8 | 250 (155) | 931 | Turks and Caicos Islands, The Bahamas, Cuba, Haiti Southeastern United States, Bermuda, Azores, Iberian Peninsula | $200 million | 34 | |
| Mujidae (kabayan) | September 30 — October 5 | 155 (100) | 950 | Philippines, China, Vietnam | $4.26 billion | 29 |
October
| Storm Name | Dates Active | Max wind km/h (mph) | Min pressure (mbar) | Areas Affected | Damage (USD) | Deaths | Refs |
|---|---|---|---|---|---|---|---|
| Choi-wan | October 1—7 |
110 (70) | 965 | Wake Island, Japan, Russia | None | None | |
| Oho | October 3—8 | 175 (110) | 957 | Western Canada, Alaska | None | None | |
| Eight-C | October 3—4 | 55 (35) | 1001 | None | None | None | |
| 08C | October 6—7 | Not Specified | 1002 | None | None | None | |
| ARB 03 | October
9—12 |
55 (35) | 1000 | None | None | None | |
| Nora | October 9—15 | 110 (70) | 993 | None | None | None | |
| 02F | October 12—18 | 45 (30) | 1001 | Vanuatu | None | None | |
| Koppu (Lando) | October 12—21 | 185 (115) | 925 | Mariana Islands, Philippines, Taiwan, Japan | $313 million | 62 | |
| Champi | October 13—25 | 175 (110) | 930 | Marshall Islands, Mariana Islands | None | None | |
| Olaf | October 15—27 | 240 (150) | 938 | None | None | None | |
| TD | October 19—21 | Not specified | Not specified | None | None | None | |
| 26W | October 19—22 | 55 (35) | 1004 | None | None | None | |
| Patricia | October 20—24 | 345 (215) | 872 | Central America, Mexico, Texas | $462.8 million | 8 | |
| Chapala | October 28 — November 4 | 215 (130) | 940 | Oman, Yemen, Somaliland | >$100 million | 9 |
November
| Storm Name | Dates Active | Max wind km/h (mph) | Min pressure (mbar) | Areas Affected | Damage (USD) | Deaths | Refs |
|---|---|---|---|---|---|---|---|
| Megh | November 5—10 | 175 (110) | 964 | Oman, Somaliland | Unknown | 18 | |
| BOB 03 | November 8—10 | 55 (35) | 991 | South India, Sri Lanka |
Unknown | 71 | |
| Kate | November 6—11 | 140 (85) | 980 | The Bahamas, United Kingdom, Ireland | Minimal | None | |
| In-fa (Marilyn) | November 16—27 | 175 (110) | 935 | Micronesia, Guam | None | None | |
| Rick | November 18—22 | 65 (40) | 1002 | Nonr | None | None | |
| Annabelle | November 19—24 | 100 (65) | 983 | None | None | None | |
| Sandra | November 23—28 | 240 (150) | 935 | Central America, Baja California, Mexico | Minimal | 4 | |
| Tuni | November 26—30 | 75 (45) | 992 | Tuvalu, Samoan Islands, Niue, Tonga | $5 million | None |
December
| Storm Name | Dates Active | Max wind km/h (mph) | Min pressure (mbar) | Areas Affected | Damage (USD) | Deaths | Refs |
|---|---|---|---|---|---|---|---|
| 04F | December 1—2 | Not Specified | 1003 | French Polynesia | None | None | |
| Bohale | December 9—12 | 65 (40) | 995 | None | None | None | |
| Melor (Nona) | December 10—17 | 175 (110) | 935 | Caroline Islands, Philippines | $148 million | 51 | |
| 29W (Onyok) | December 14—19 | 55 (35) | 1002 | Caroline Islands,Philippines | $23.3 thousand | None | |
| 04U | December 17—23 | Not Specified | 1006 | None | None | None | |
| TD | December 20—23 | Not Specified | 1008 | Borneo, Malaysia | None | None | |
| 05U | December 21 — January 2 | 55 (35) | 994 | Northern Territory, Queensland | None | None | |
| 06F | December 27—30 | Not Specified | 997 | Wallis and Futuna | None | None | |
| 06U | December 27—29 | Not Specified | Not Specified | None | None | None | |
| 07F | December 28 — January 1 | Not Specified | 995 | Solomon Islands, Tuvalu, Fiji | None | 3 | |
| Ula | December 29 — January 12 | 185 (115) | 944 | Tuvalu, Samoan Islands, Tonga, Fiji, Vanuatu, New Caledonia | None | 1 | |
| Nine-C | December 31 | 55 (35) | 1001 | None | None | None |
Global effects
Notes
1 Only systems that formed either on or after January 1, 2015 are counted in the seasonal totals.
2 Only systems that formed either before or on December 31, 2015 are counted in the seasonal totals.
3 The wind speeds for this tropical cyclone/basin are based on the IMD Scale which uses 3-minute sustained winds.
4 The wind speeds for this tropical cyclone/basin are based on the Saffir Simpson Scale which uses 1-minute sustained winds.
5The wind speeds for this tropical cyclone are based on Météo-France which uses gust winds.
See also
- List of earthquakes in 2015
- Tornadoes of 2015
- 2015 Pacific typhoon season
- 2015 Pacific hurricane season
- 2015 Atlantic hurricane season
- 2015 North Indian Ocean cyclone season
- Australian region cyclone seasons: 2014–15, 2015–16
- South-West Indian Ocean cyclone seasons: 2014–15, 2015–16
- South Pacific cyclone seasons: 2014–15, 2015–16
References
- Mar S. Arguelles (January 21, 2015). "Storm 'Amang' leaves 3 people dead, P318.7M in damages in Bicol". Philippine News Agency. Interaksyon. Archived from the original on April 2, 2015. Retrieved March 24, 2015.
- "SitRep No. 10 re Effects of Tropical Storm "Amang" (MEKKHALA)" (PDF). National Disaster Risk Reduction and Management Council. January 20, 2015. Archived from the original (PDF) on February 6, 2015. Retrieved January 23, 2015.
- "Flood death toll across Southern Africa reaches 260". Chicago Tribune. Retrieved 21 January 2015.
- "Madagascar tropical storm claims 46 lives". Yahoo News! via AP. Retrieved 21 January 2015.
External links
Regional Specialized Meteorological Centers
- US National Hurricane Center – North Atlantic, Eastern Pacific
- Central Pacific Hurricane Center – Central Pacific
- Japan Meteorological Agency – NW Pacific
- India Meteorological Department – Bay of Bengal and the Arabian Sea
- Météo-France – La Reunion – South Indian Ocean from 30°E to 90°E
- Fiji Meteorological Service – South Pacific west of 160°E, north of 25° S
Tropical Cyclone Warning Centers
- Meteorology, Climatology, and Geophysical Agency of Indonesia – South Indian Ocean from 90°E to 141°E, generally north of 10°S
- Australian Bureau of Meteorology (TCWC's Perth, Darwin & Brisbane) – South Indian Ocean & South Pacific Ocean from 90°E to 160°E, generally south of 10°S
- Papua New Guinea National Weather Service – South Pacific Ocean from 141°E to 160°E, generally north of 10°S
- Meteorological Service of New Zealand Limited – South Pacific west of 160°E, south of 25°S
![]()
.jpg)
