Poujols
Poujols is a commune in the Hérault department in the Occitanie region in southern France.
Poujols | |
|---|---|
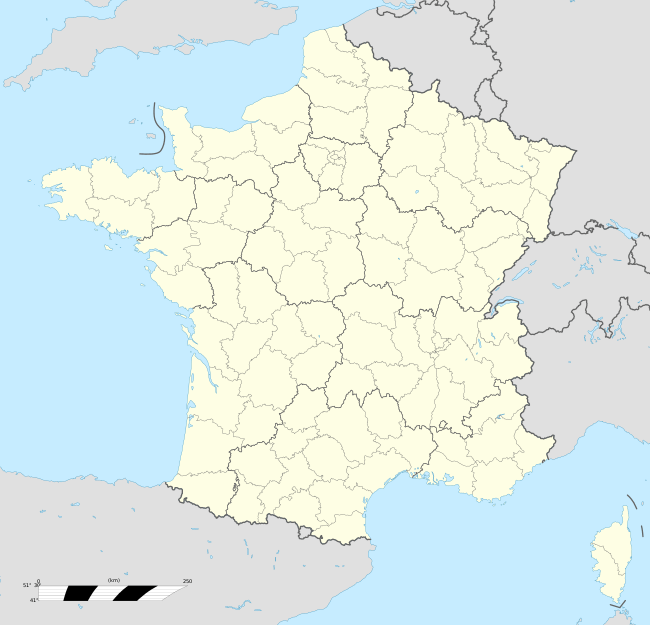
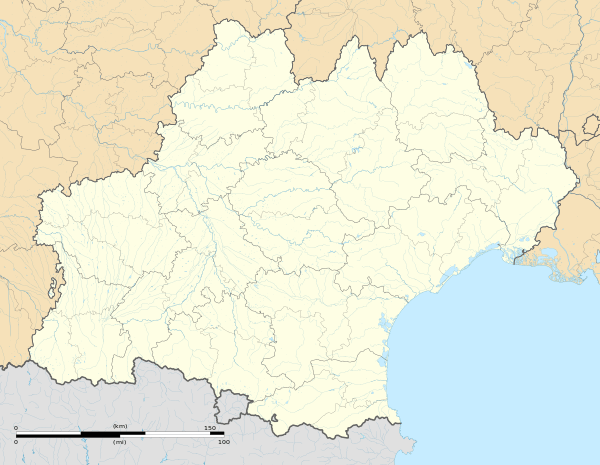
Location of Poujols 
| |
 Poujols  Poujols | |
| Coordinates: 43°45′55″N 3°19′30″E | |
| Country | France |
| Region | Occitanie |
| Department | Hérault |
| Arrondissement | Lodève |
| Canton | Lodève |
| Intercommunality | Lodévois - Larzac |
| Government | |
| • Mayor (2008–2014) | Roger Caylar |
| Area 1 | 2.86 km2 (1.10 sq mi) |
| Population (2017-01-01)[1] | 164 |
| • Density | 57/km2 (150/sq mi) |
| Time zone | UTC+01:00 (CET) |
| • Summer (DST) | UTC+02:00 (CEST) |
| INSEE/Postal code | 34212 /34700 |
| Elevation | 192–652 m (630–2,139 ft) (avg. 250 m or 820 ft) |
| 1 French Land Register data, which excludes lakes, ponds, glaciers > 1 km2 (0.386 sq mi or 247 acres) and river estuaries. | |

Population
At the 2016 census the Population of the municipality was 163 inhabitants a rise of 8.67% from the 2011 census, creating a population densité of 57 inhabitants/km2.
The evolution of the number of inhabitants is known through the censuses of the population carried out in the commune since 1793. From 2006, the legal populations of the communes are published annually by INSEE. The census is now based on an annual collection of information, successively covering all municipal territories over a period of five years. For municipalities with fewer than 10,000 inhabitants, a census survey of the whole population is carried out every five years, the legal populations of the intermediate years being estimated by interpolation or extrapolation.[2] For the municipality, the first comprehensive census within the framework of the new system was carried out in 2005.[3]
The town reached peak population in the half a century following the French revolution but dwindled to a low following the Second World War, but has seen some growth in the early 21st century.

| Year | Pop. | ±% |
|---|---|---|
| 1793 | 267 | — |
| 1800 | 184 | −31.1% |
| 1806 | 320 | +73.9% |
| 1821 | 288 | −10.0% |
| 1831 | 289 | +0.3% |
| 1836 | 305 | +5.5% |
| 1841 | 277 | −9.2% |
| 1846 | 297 | +7.2% |
| 1851 | 278 | −6.4% |
| 1856 | 300 | +7.9% |
| 1861 | 304 | +1.3% |
| 1866 | 258 | −15.1% |
| 1872 | 242 | −6.2% |
| 1876 | 221 | −8.7% |
| 1881 | 222 | +0.5% |
| 1891 | 200 | −9.9% |
| 1896 | 175 | −12.5% |
| 1906 | 168 | −4.0% |
| 1911 | 144 | −14.3% |
| 1921 | 145 | +0.7% |
| 1926 | 131 | −9.7% |
| 1931 | 116 | −11.5% |
| 1936 | 120 | +3.4% |
| 1946 | 115 | −4.2% |
| 1954 | 98 | −14.8% |
| 1962 | 97 | −1.0% |
| 1968 | 105 | +8.2% |
| 1975 | 113 | +7.6% |
| 1982 | 120 | +6.2% |
| 1990 | 127 | +5.8% |
| 1999 | 125 | −1.6% |
| 2008 | 155 | +24.0% |
See also
References
- "Populations légales 2017". INSEE. Retrieved 6 January 2020.
- https://www.insee.fr/fr/information/2383265
- https://www.insee.fr/fr/information/2383410
| Wikimedia Commons has media related to Poujols. |